- Table of Contents
- Related Documents
-
| Title | Size | Download |
|---|---|---|
| 01-Text | 841.57 KB |
U-Center 2.0 overview
Product orientation
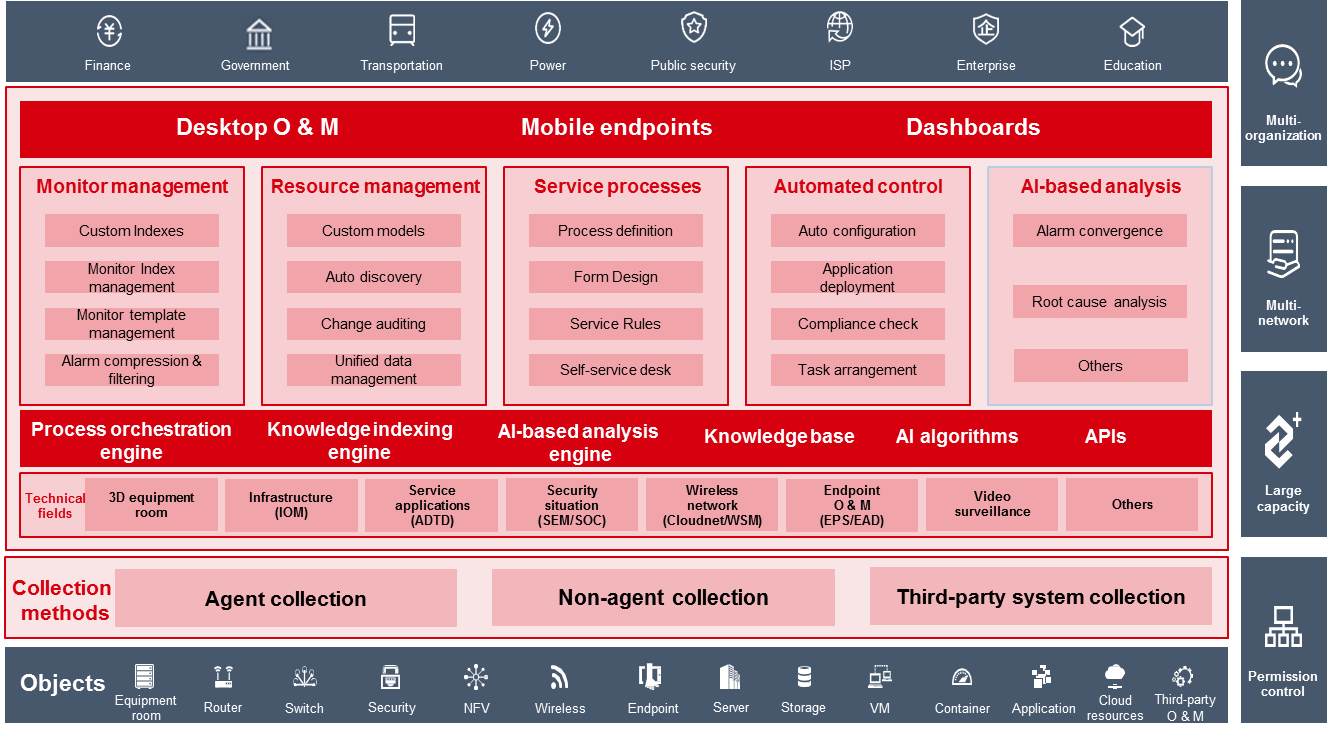
H3C U-Center orients toward the enterprise-level, comprehensive O & M solution in the aspects of monitoring, management, and control. It applies to the multi-organization, multi-network, large capacity, and permission control scenarios, implementing one-stop management for all resources of the cloud, networks, and endpoints. Figure 1 shows the overall framework of U-Center 2.0.
Figure 1 Overall framework of U-Center 2.0
Components
· Configuration Management Database (CMDB)
· Infrastructure Operation Management (IOM)
· IT Service Management (ITSM)
· Business Service Management (BSM)
· User Experience Management (UEM)
· Application Discovery Tracing and Diagnostics (ADTD)
· Network Traffic Analyzer (NTA)
· Automated Operations Management (AOM)
· Synthetic Transaction Monitor (STM)
· Operations and maintenance Data Analysis (ODA)
· Application Performance Analytics (APA)
· Quick Report (QuickReport)
Capabilities
U-Center 2.0 adopts the microservice infrastructure and containerized Unified Platform. Based on CMDB data, monitor templates, custom indexes, process orchestration engine, and service management, U-Center 2.0 provides the following capabilities:
· Aggregation—Aggregates the cloud, network, endpoint, and security technical fields through the microservice-integrated Unified Platform to implement unified O & M.
· Application—Based on CMDB data and OBASHI methodology (that describes relationships and data flows between services and IT resources), U-Center 2.0 generates topologies for service applications to implement unified resource management.
· AIOps—Adopts big data and machine learning to solve exceptions, predict capacity, and analyze root causes.
· Agility—Uses monitor templates, predefined resource models, custom indexes, and automation for agile product delivery.
Quick start
U-Center 2.0 provides users with an intuitive, interactive Web interface that can be accessed through a Web browser. The following information covers these topics:
· Explore the U-Center 2.0 GUI
Access U-Center 2.0
U-Center 2.0 is developed based on the browser/server model. Users can access U-Center 2.0 directly by entering the URL of the U-Center server in the Web browser.
Table 1 lists the Web browsers supported by U-Center 2.0.
Table 1 Recommended Web browsers
|
Browser |
Version |
|
Chrome |
Chrome 70 or later |
|
Firefox |
Firefox 78 or later |
U-Center 2.0 can be accessed through both HTTP and HTTPS, by using URLs in the following formats:
· http://<IP address>:<port>
· https://<IP address>:<port>
The IP address is the virtual IP address configured in Matrix for northbound services. By default, the port number is 30000, which is configurable during installation.
|
|
NOTE: · You can use the predefined administrator account (with username admin and password Pwd@12345) for initial access to U-Center 2.0. After login, change the default account password as soon as possible for security purposes. · To view the northbound service virtual IP address, navigate to the DEPLOY > Clusters > Cluster Parameters page in Matrix. |
Explore the U-Center 2.0 GUI
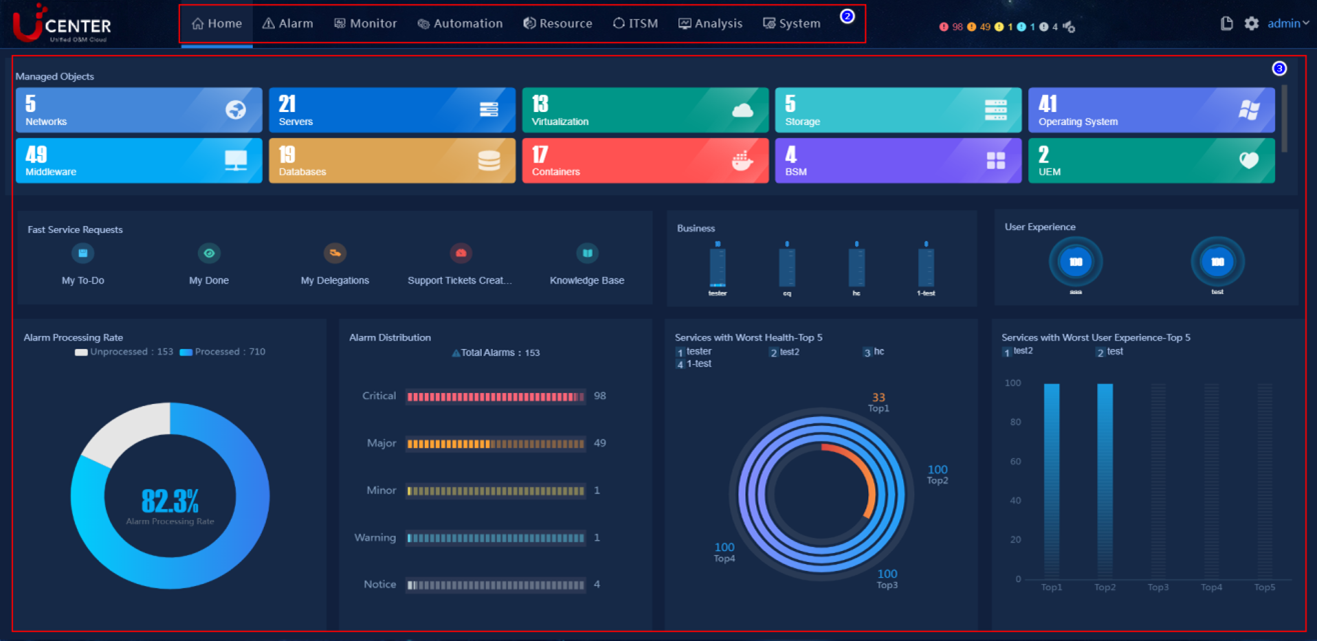
U-Center displays the overview page after you log in.
The U-Center 2.0 overview page contains the top navigation bar and O&M work pane, as shown in Figure 2.
Figure 2 U-Center 2.0 overview page
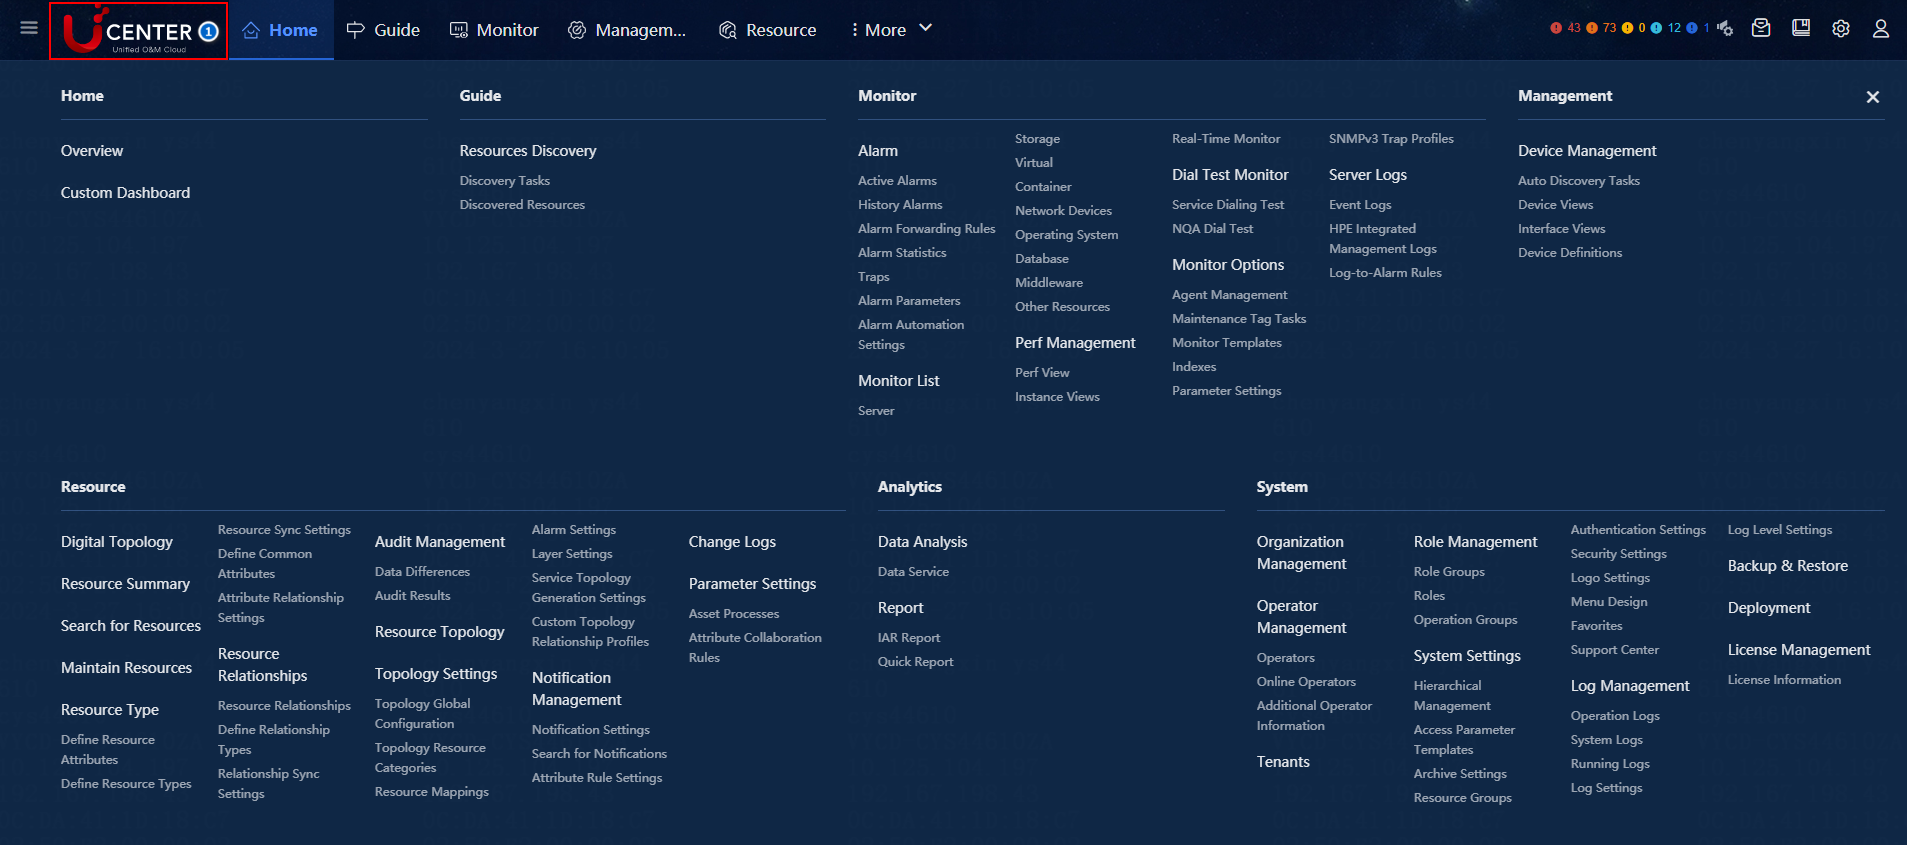
You can hover over the logo in the top left corner to display the U-Center 2.0 function modules, as shown in Figure 3.
Figure 3 U-Center 2.0 function menus
|
Item |
Name |
Description |
|
1 |
Logo |
Provides access to all function modules of U-Center 2.0. |
|
2 |
Top navigation bar |
Provides one-key access to the function modules of U-Center. |
|
3 |
O&M work pane |
Displays the objects managed by the system, as well as the alarm information in the network. |
|
4 |
Left navigation pane |
Provides access to all resources and functions pertaining to the function module selected on the top navigation bar. |
|
5 |
Configuration page |
Allows you to configure the objects added to the system. |
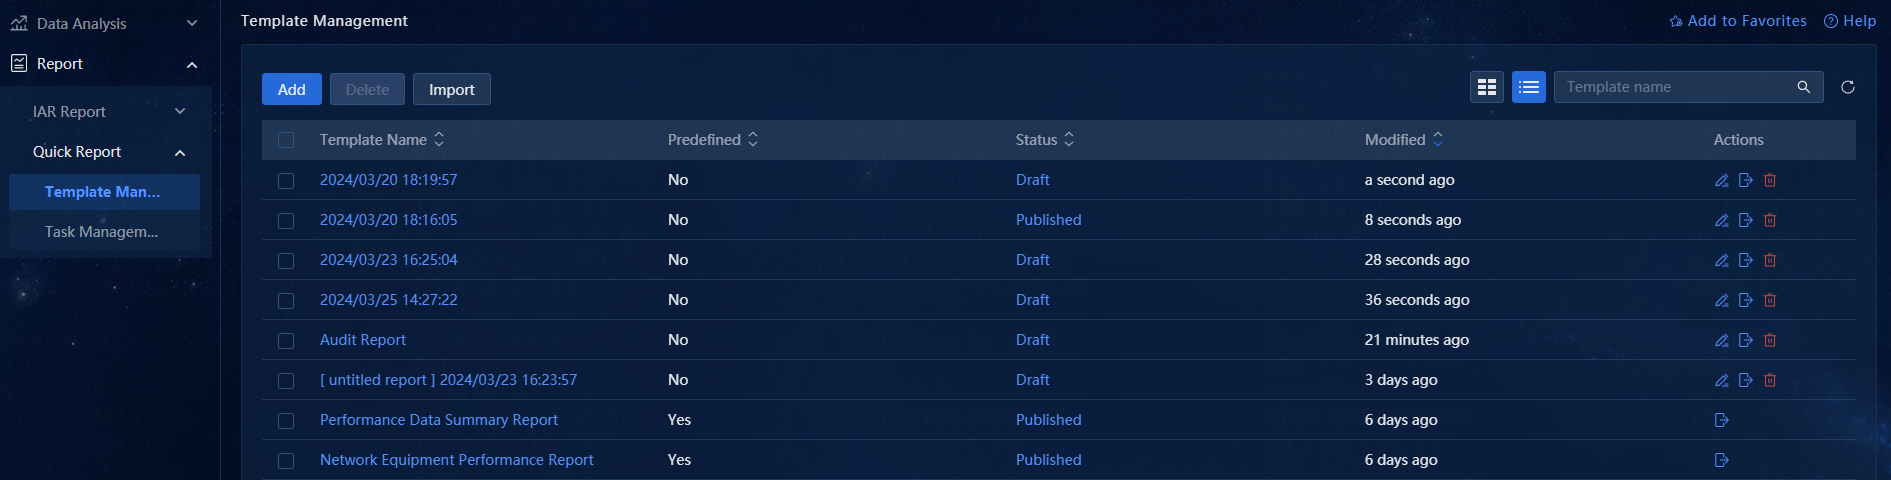
Click a tab on the top navigation bar to open the operation interface of the corresponding function module. To access the quick report template management page, select Report > Quick Report > Template Management from the left navigation pane.
Figure 4 Quick report template management page
|
|
NOTE: You can perform the following tasks on web page: · Add to favorites: Click a. On the top navigation bar, click System. b. From the navigation pane, select System Settings > Favorites. c. On this page, view the pages that have been added to favorites. · Open online help: Click |
Manage operators
U-Center 2.0 implements role-based permission control on operators. An operator with a role has the operation and data permissions on a specific resource type. A role is a collection of permissions. To implement operation and data permission control for an operator, assign permissions to a role, specify the role for a group, and then add the operator to the group.
U-Center 2.0 allows provides various groups for you to add operators and assign permissions to them for implementing secure O & M.
Modify the default password of the admin account
U-Center 2.0 provides a predefined account with login name admin and password Pwd@12345. You can use the account for initial access to U-Center 2.0.
Upon logging in to the system for the first time, you must first change the password for the operator account admin to ensure system security. Use any of the following methods to change the operator password:
· Follow the guide that opens upon login to change the password:
a. After you log in, the system will open the New Password dialog box.
b. Click Change Password Now.
c. In the New Password window that opens, change the password.
d. Click OK.
· Change the password of the current account:
a. Hover over the admin link in the upper right corner of the page.
b. Select New Password from the drop-down menu.
c. In the New Password window that opens, change the password.
d. Click OK.
· Manage the operator:
a. On the top navigation bar, click System.
b. From the navigation pane, select Operator Management > Operators.
c. Click ![]() in the Actions column for the admin operator.
in the Actions column for the admin operator.
d. Turn on the Change
Password option ![]() , and then enter the new password in the Login
Password and Confirm Password fields.
, and then enter the new password in the Login
Password and Confirm Password fields.
e. Click OK.
Add an operator
To manage a medium- or large-sized network, you can add multiple operators with associated permissions for secure O & M.
To add an operator:
1. On the top navigation bar, click System.
2. From the navigation pane, select Operator Management > Operators.
3. Click Add.
4. Configure the basic operator information:
¡ Operator Name: Enter the login account name, a case-insensitive string of 2 to 32 characters that can contain only letters, digits, underscores (_), hyphens (-), dots (.), and backslashes (\).
¡ Tenant: Specify a tenant for the operator.
¡ Organization: Specify an organization for the operator.
¡ Authentication Method: Select an authentication method. The system provides the following authentication methods:
- Simple Password Authentication: Requires a password when you add the operator. The operator uses local password authentication for login.
- LDAP/RADIUS/TACACS Authentication: Requires the operator to perform authentication with the associated authentication server for login.
- Third-Party Authentication: Requires the operator to log in through third-party authentication and custom modules.
¡ Login Password: If the simple password authentication method is selected, the login password field will appear. Enter the login password of the operator in this field.
¡ Confirm Password: If the simple password authentication method is selected, the confirm password field will appear. Confirm the login password of the operator in this field.
¡ Tel: Enter the phone number of the operator. This field is optional.
¡ Email: Enter the Email account of the operator. This field is optional.
5. Configure the advanced operator information:
¡ Last Name: Enter the last name of the operator. This field is optional.
¡ First Name: Enter the first name of the operator. This field is optional.
¡ Full Name: Enter the full name of the operator. This field is optional.
¡ Permitted Login Time Span: Specify a login time range for the operator. The operator is not allowed to log in to the system at a time out of this range.
¡ Description: Enter a description of the operator. The description information facilitates maintenance.
¡ Enable Password Validity Period: When
the simple password authentication method is selected, the Password Validity Period switch will appear. Click ![]() to limit the
password validity period.
to limit the
password validity period.
- Password Validity Period: After the password expires, the operator will be disabled and cannot log in to the system.
- Password Expiration Notification Threshold (Days): When the remaining validity period of a password reaches the threshold, the system sends an alarm to notify the user to change the password each time the user logs in. The system automatically clears the alarm when the password is changed.
¡ Enable Account Validity Period: Click
![]() to limit the validity period of the account.
to limit the validity period of the account.
- Account Expiration Time: After the account expires, the operator will be disabled and cannot log in to the system.
- Account Expiration Notification Threshold (Days): When the remaining validity period for an account reaches the threshold, the system sends an alarm to notify the user to change the account validity period each time the user logs in. The system automatically clears the alarm when the account validity period is changed.
¡ Maximum Concurrent Logins: Set the maximum number of concurrent users that use this operator account. If the number of concurrent users has reached the upper limit, the system blocks the login request of a new user using this account. The value of this parameter must be an integer in the range of 0 to 999. If you set the value to 0, no concurrent login limit is set.
6. Configure operator permissions.
¡ By Role Group: Specify role groups for the operator. The operator has the permissions of the specified role groups.
¡ By Role: Specify roles for the operator. The operator has the permissions of the specified roles.
¡ By Direct Assignment: Specify the maximum number of concurrent logins for the operator. If the number of concurrent logins has reached the upper limit, the system will block the login request of the operator.
7. Click OK.
|
|
NOTE: To use the RADIUS, LDAP, or TACACS authentication type, you must configure the authentication server settings on the Authentication Server page. |
Quick report
Quick report is a software tool that enables the rapid and flexible creation of visual reports by connecting to various data sources. It uses built-in report templates and chart design features to quickly extract, integrate, and visually display data.
· It offers a variety of visualization options, including charts, dashboards, and maps, and allows you to customize multiple common chart types.
· You can easily create interactive dashboards by combining various visual charts and achieve a what you see is what you get (WYSIWYG) experience through drag-and-drop operations.
· This feature allows you to create a scheduled task for a report template, which periodically generates reports based on configured parameters and conditions.
· This feature supports configuring emails to send the download addresses of report files generated in scheduled tasks, helping users view and download report files.
The quick report generation tool is widely used in data analysis, decision-making, and daily report generation scenarios of enterprises, such as finance reports, sales reports, and market analysis reports. Use this tool to quickly generate reports that meet business requirements, enhancing work efficiency and data visualization.
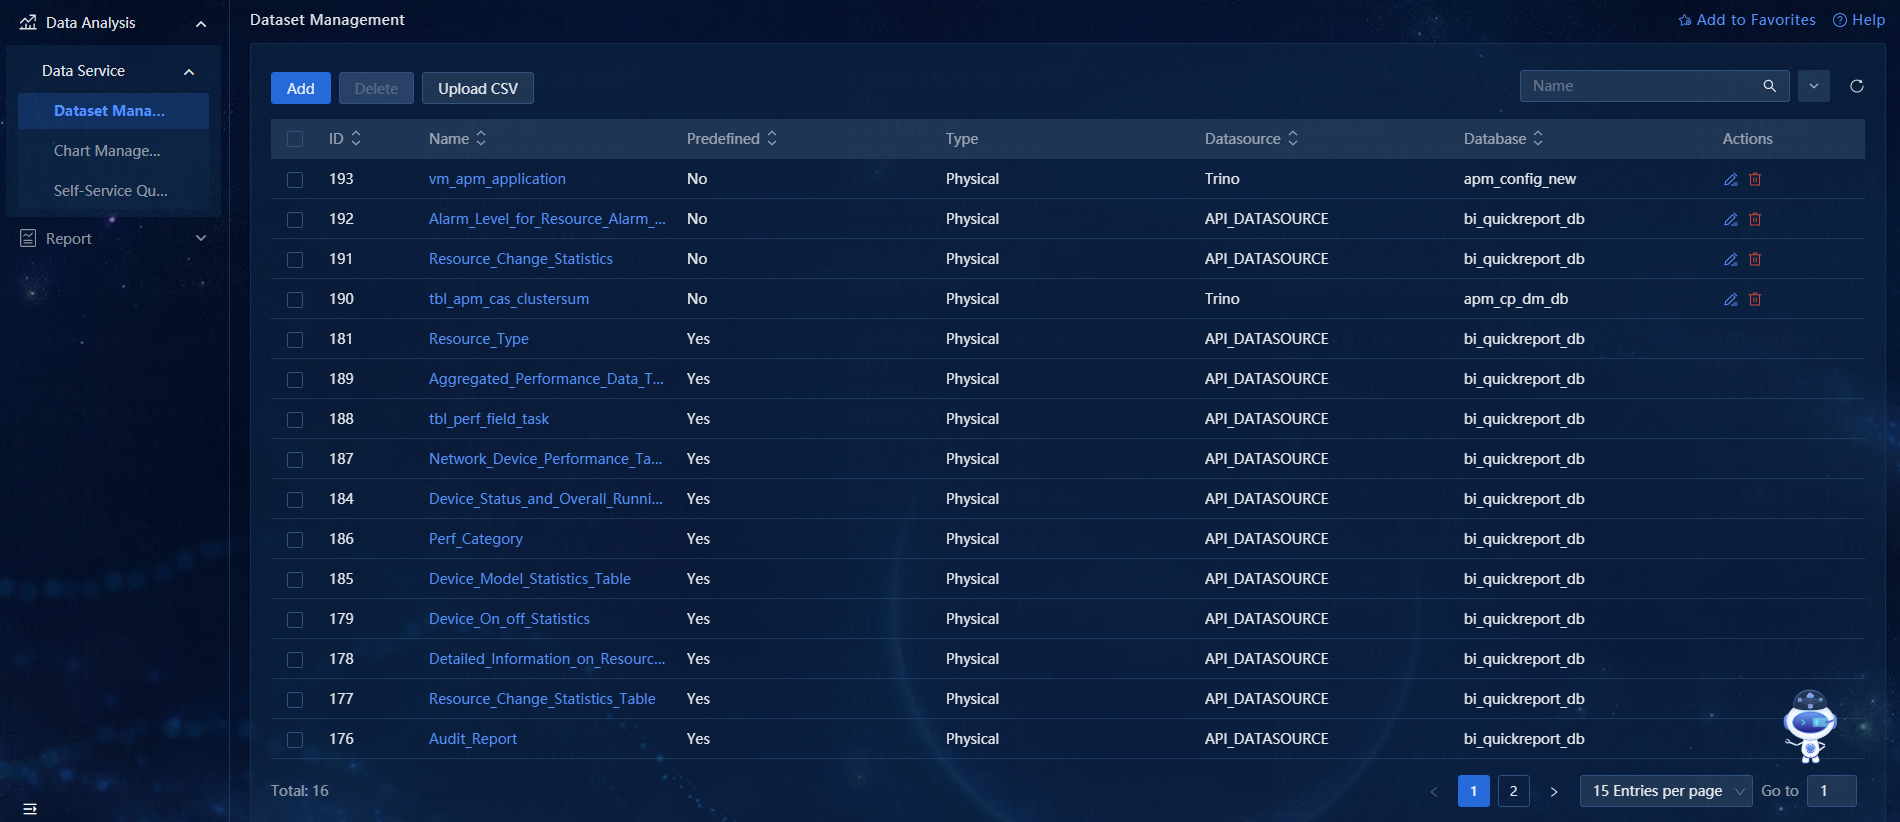
Manage datasets
Perform this task to create a dataset from a database's physical table or view and provide a data source for creating charts. Datasets include both physical and virtual types. Create physical datasets by performing the Create a dataset and Upload CSV tasks, and generate virtual datasets by Save the dataset in the Self-service query section.
Figure 5 Dataset management page
Create a dataset
1. On the top navigation bar, click Analytics. From the navigation pane, select Data Analysis > Data Service > Dataset Management.
2. Click Add.
3. Select a data source, Trino mode (available when the data source is Trino), database, and database table or view to display the field information. Click OK to create a dataset, or click Create dataset and create chart to add a dataset and then directly access the Create a chart page.
|
|
NOTE: Once you have created a dataset's tables and views, you cannot use them to create datasets. However, you can reuse the dataset. |
Upload CSV
Perform this task to import a CSV data file into the database to generate a corresponding data table as a dataset.
1. On the top navigation bar, click Analytics. From the navigation pane, select Data Analysis > Data Service > Dataset Management.
2. Click Upload CSV.
3. Configure the data, file settings, columns, and rows. For parameter descriptions, see the help on this page.
4. Click OK.
Manage datasets
You can view, edit, delete, and copy datasets.
View datasets
1. On the top navigation bar, click Analytics. From the navigation pane, select Data Analysis > Data Service > Dataset Management.
2. On the dataset management page, view the generated dataset list, which displays fields such as dataset name, predefined status, dataset type, data source, and more.
3. To filter and view datasets, perform the following tasks:
a. Enter a dataset name in the input box in the upper right corner to view the filtered datasets.
b. Click the ![]() icon on the right
of the input box to expand the filter conditions. Select or enter the filter
values and click Search to view the filtered
datasets. Click Reset to cancel the filter.
icon on the right
of the input box to expand the filter conditions. Select or enter the filter
values and click Search to view the filtered
datasets. Click Reset to cancel the filter.
4. Click the name of a dataset to access the Create a chart page, where you can directly create charts based on that dataset.
Edit a dataset
Edit dataset properties.
|
|
NOTE: · Predefined datasets cannot be edited. · Editing a dataset associated with a chart will affect the chart's display information. Perform this operation with caution. |
1. On the top navigation bar, click Analytics. From the navigation pane, select Data Analysis > Data Service > Dataset Management.
2. Click the ![]() icon in the Actions column for a dataset in the dataset list. In the
dialog box that opens, edit the source, metrics, columns, and calculated column
for that dataset.
icon in the Actions column for a dataset in the dataset list. In the
dialog box that opens, edit the source, metrics, columns, and calculated column
for that dataset.
¡ Source: Click the Source tab, and edit the datasource, database, dataset name, and SQL.
¡ Metrics: Click the Metrics tab to add, delete, or edit metric items.
- Click the Add item button in the upper right corner to add metrics.
- To delete a metric, click the ![]() icon to the right
of that metric.
icon to the right
of that metric.
- Click the parameters for a metric to edit that metric.
¡ Columns: Click the Columns tab. On this tab, you can delete, edit, and synchronize displayed fields.
- To delete a column, click the ![]() icon to the right
of that column.
icon to the right
of that column.
- Select or clear column fields, including time condition, default datetime, filterable, and dimension, to edit column properties.
- Click the ![]() icon on the left of a column to edit the label, description,
datetime format, and other information for that column.
icon on the left of a column to edit the label, description,
datetime format, and other information for that column.
- Click Sync columns from source in the upper right corner to synchronize column fields.
¡ Calculated columns: On this tab, you can add, delete, or edit calculated column conditions.
- Click the Add item button in the upper right corner to add a calculated column.
- To delete a calculated column, click the ![]() icon
to the right of that calculated column.
icon
to the right of that calculated column.
- Select or clear calculated column fields, including time condition, default datetime, filterable, and dimension, to edit calculated column properties.
- Click the ![]() icon on the left of a calculated column to edit the label, description,
datetime format, and other information for that calculated column.
icon on the left of a calculated column to edit the label, description,
datetime format, and other information for that calculated column.
3. Click OK.
Delete datasets
Datasets associated with charts cannot be deleted.
1. On the top navigation bar, click Analytics. From the navigation pane, select Data Analysis > Data Service > Dataset Management.
2. You can delete a single dataset or bulk delete datasets.
¡ Delete a single dataset: Click the ![]() icon
in the Actions column for the dataset to be
deleted, and then click OK in the dialog box that
opens.
icon
in the Actions column for the dataset to be
deleted, and then click OK in the dialog box that
opens.
¡ Bulk delete datasets: Select one or more datasets from the list and click the Delete button above the list to delete the selected datasets.
Copy a dataset
Only virtual datasets can be copied.
1. On the top navigation bar, click Analytics. From the navigation pane, select Data Analysis > Data Service > Dataset Management.
2. Click the ![]() icon in the Actions column for a dataset in the dataset list. In the
dialog box that opens, enter a new dataset name, and make sure it's different
from the original name. Click OK.
icon in the Actions column for a dataset in the dataset list. In the
dialog box that opens, enter a new dataset name, and make sure it's different
from the original name. Click OK.
Manage charts
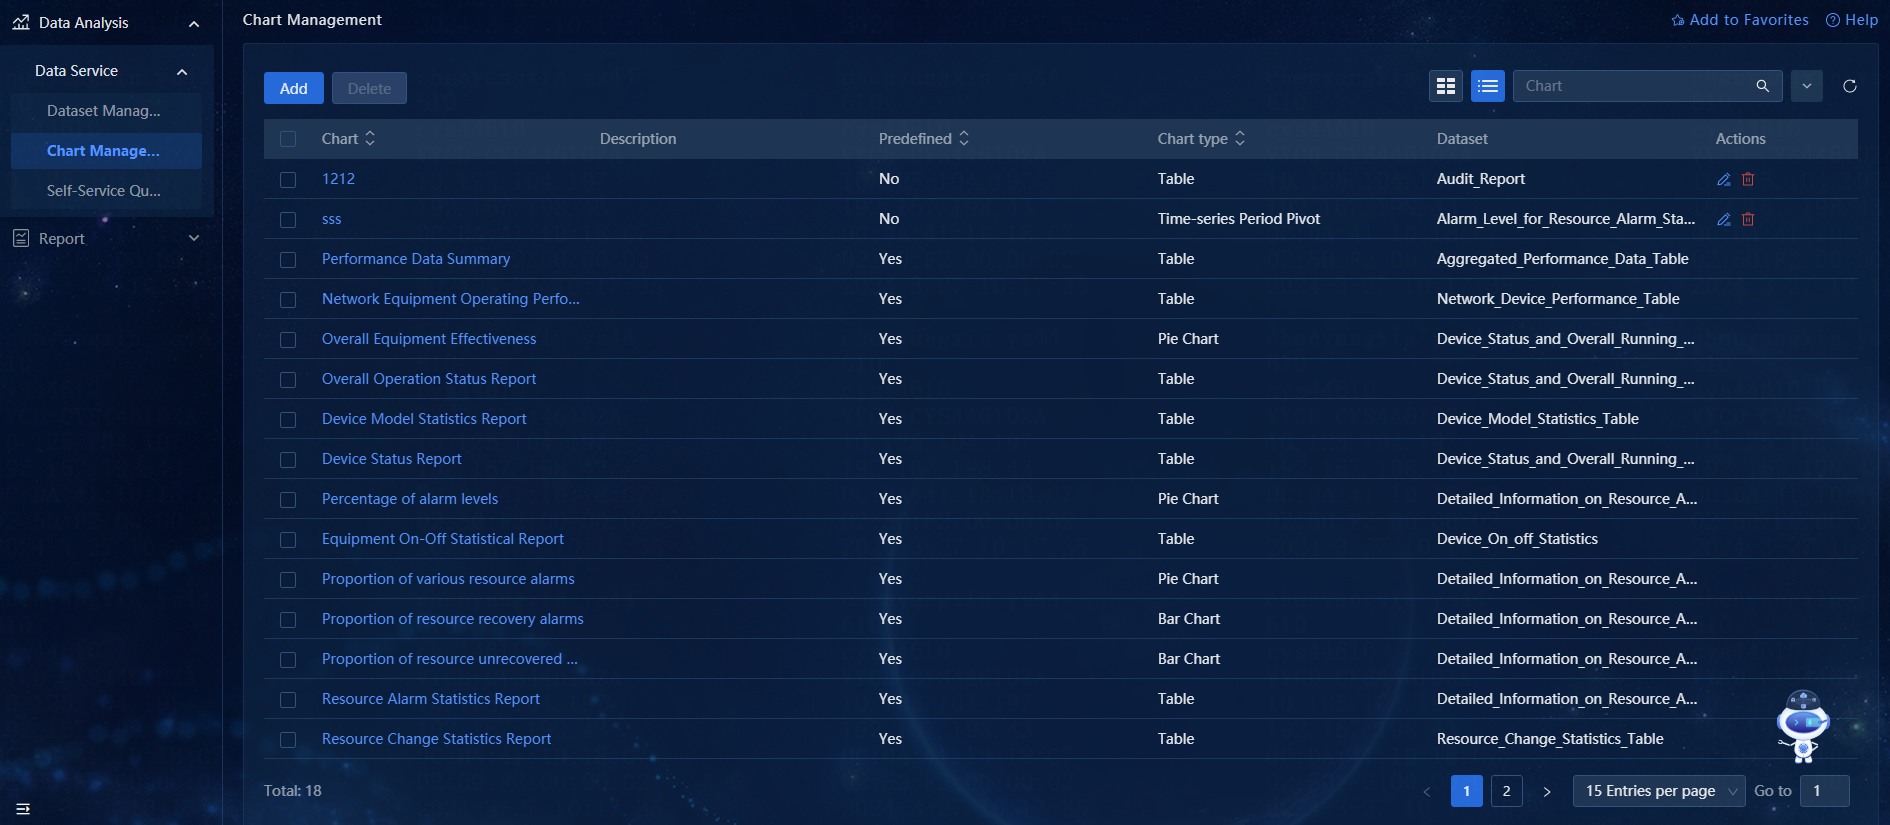
This feature provide an intuitive, interactive visual editor that allows you to easily select data fields, adjust chart styles and layouts, and quickly create custom charts. Also, this feature supports creating and managing custom chart templates, including colors, fonts, tag, and more, to meet various styles and requirements and customize the appearance and style of charts.
Figure 6 Chart management page
Create a chart
1. On the top navigation bar, click Analytics. From the navigation pane, select Data Analysis > Data Service > Chart Management.
2. Click Add.
3. Select a dataset. Alternatively, click the Add dataset button to the right of the Choose a dataset box to access the Create a dataset page or click the To SQL Tab button, create a new dataset, and then select it.
4. Select a chart type. Options include table, map, flow, ranking, correlation, evolution, part of a whole, and KPI.
5. Click the Create new chart button to access the chart configuration page, which includes four areas: dataset, chart, config, and results.
¡ Dataset area: Displays dataset data,
including metrics, columns, and calculated columns. You can drag them to the
related parameter settings in the config area. To open or close the area, click
the ![]() icon in the upper left of the chart configuration page.
icon in the upper left of the chart configuration page.
- Click the ![]() icon to the right of the dataset name and select Edit dataset to Edit a
dataset.
icon to the right of the dataset name and select Edit dataset to Edit a
dataset.
- Click the ![]() icon to the right of the dataset name and select Swap dataset.
icon to the right of the dataset name and select Swap dataset.
- Click the ![]() icon to the right of the dataset name, and select View in SQL Tab to access the Self-service
query page, which displays the default SQL
statement for the database containing the dataset and the execution result.
icon to the right of the dataset name, and select View in SQL Tab to access the Self-service
query page, which displays the default SQL
statement for the database containing the dataset and the execution result.
¡ Chart area: Offers a variety of chart
types to select. To open or close the area, click the ![]() icon
in the upper left of the chart configuration page.
icon
in the upper left of the chart configuration page.
¡ Config area: Allows you to configure
a chart, whose settings vary by chart type. Click Create
chart to complete the chart configuration. To open or close the area,
click the ![]() icon in the upper left of the chart configuration page.
icon in the upper left of the chart configuration page.
¡ Results area: Displays the completed configuration chart.
6. Click the ![]() icon in the upper
right corner. In the window that opens, set the chart name, and add it to a
dashboard. Click the Save and go to dashboard to
save the chart and go to the Create
a template page, or click the Save button to save the chart. Alternatively, you can set
the chart name at the top of the Add Chart page.
icon in the upper
right corner. In the window that opens, set the chart name, and add it to a
dashboard. Click the Save and go to dashboard to
save the chart and go to the Create
a template page, or click the Save button to save the chart. Alternatively, you can set
the chart name at the top of the Add Chart page.
7. Other actions: Click the ![]() icon
in the upper right corner of the page to perform the following tasks:
icon
in the upper right corner of the page to perform the following tasks:
¡ Dashboards added to: View the dashboards to which the chart has been added. Click the displayed dashboard to directly access the Edit Dashboard page.
¡ Download: Download the chart to your local device. Available formats include .CSV file, .JSON file, image, and Excel file.
¡ View query: View the SQL statement where the configured chart is located and copy it.
¡ Run in SQL Lab: Enter the self-service query page to display the SQL statement and execution result for the configured chart.
Manage charts
You can view, edit, delete, and update charts.
View charts
1. On the top navigation bar, click Analytics. From the navigation pane, select Data Analysis > Data Service > Chart Management.
2. On the chart management page, view the generated chart list, which displays fields such as chart name, predefined status, chart type, dataset, and more.
3. To filter and view charts, perform the following tasks:
¡ Enter a chart name in the input box in the upper right corner to view the filtered charts.
¡ Click
the ![]() icon on the right of the input box to expand the filter conditions.
Select or enter the filter values and click Search
to view the filtered charts. Click Reset to cancel
the filter.
icon on the right of the input box to expand the filter conditions.
Select or enter the filter values and click Search
to view the filtered charts. Click Reset to cancel
the filter.
Edit chart settings
|
|
NOTE: · Predefined datasets cannot be edited. · Editing a chart associated with a report template will affect the report template's display information and scheduled task' execution results. Perform this operation with caution. |
Edit properties
1. On the top navigation bar, click Analytics. From the navigation pane, select Data Analysis > Data Service > Chart Management.
2. Click the ![]() icon in the Actions column for a chart on the chart list. In the Edit Chart Properties dialog box that opens, you can edit
the chart name and description.
icon in the Actions column for a chart on the chart list. In the Edit Chart Properties dialog box that opens, you can edit
the chart name and description.
3. Click Save.
Edit configuration
1. On the top navigation bar, click Analytics. From the navigation pane, select Data Analysis > Data Service > Chart Management.
2. Click the name of the chart you want to edit
to access the chart update page. On this page, you can edit the chart
configuration. After making changes, click the Update
chart button, and then click the ![]() icon in the upper
right corner to either overwrite the existing chart or save it as a new chart.
icon in the upper
right corner to either overwrite the existing chart or save it as a new chart.
Delete charts
|
|
NOTE: · Predefined charts cannot be deleted. · Charts associated with report templates cannot be deleted. |
1. On the top navigation bar, click Analytics. From the navigation pane, select Data Analysis > Data Service > Chart Management.
2. You can delete a single chart or bulk delete charts.
¡ Delete a single chart: Click the ![]() icon
in the Actions column for the chart to be deleted,
and then click OK in the dialog box that opens.
icon
in the Actions column for the chart to be deleted,
and then click OK in the dialog box that opens.
¡ Bulk delete charts: Select one or more charts from the list and click the Delete button above the list to delete the selected charts.
Self-service query
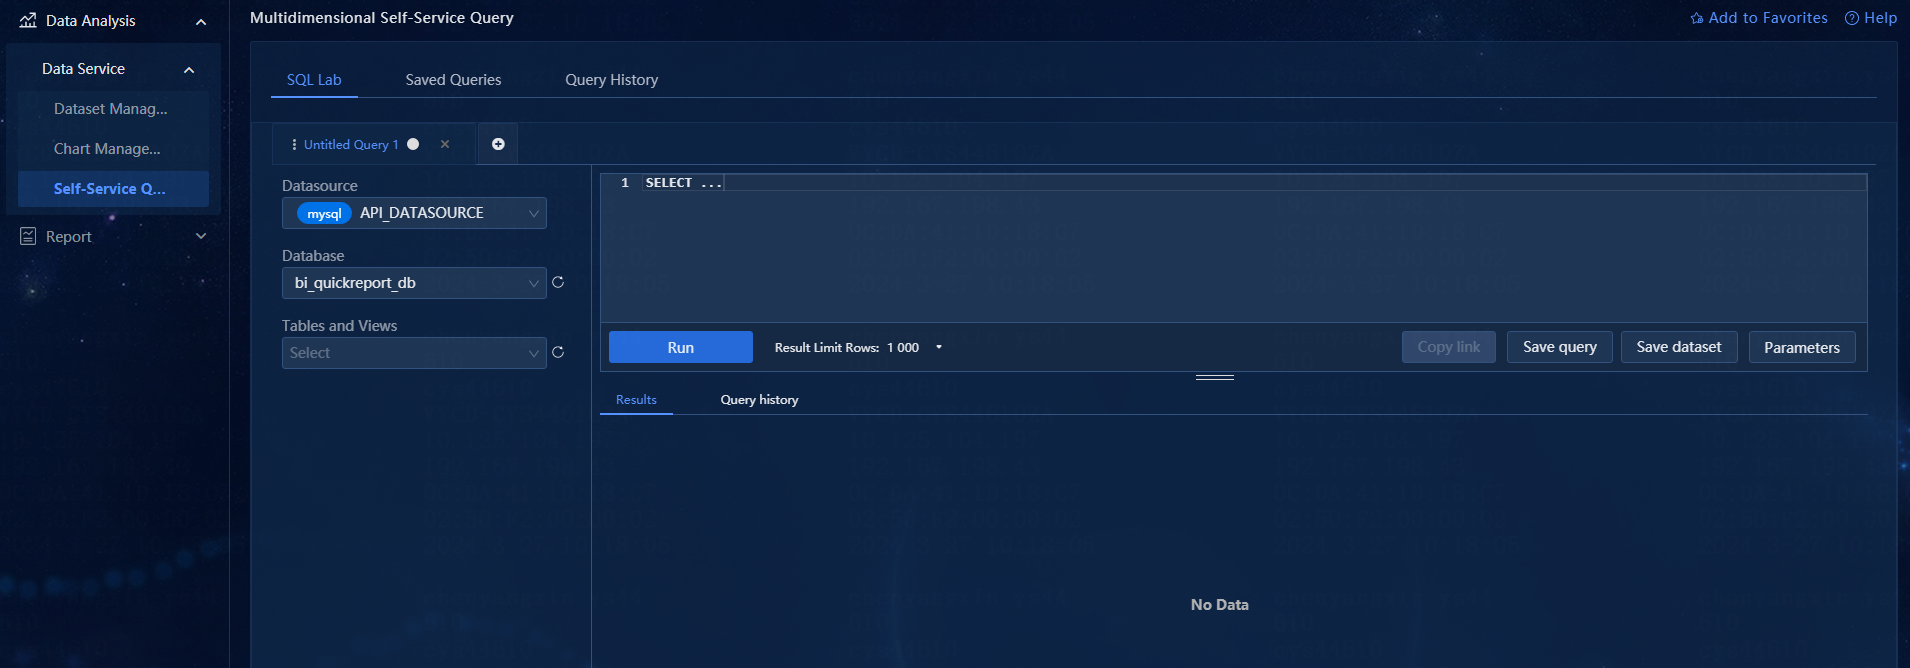
This feature provides an interactive SQL query editor for writing and editing SQL statements. It enables users to easily edit and save SQL queries, and provides convenient query comparison and analysis. Simultaneously, this feature supports using a single SQL statement as the dataset for a virtual table. Additionally, the tool supports applying Python syntax through JinJa templates in SQL.
Figure 7 Self-service query page
Preview queries
1. On the top navigation bar, click Analytics. From the navigation pane, select Data Analysis > Data Service > Self-Service Query.
2. Select a data source, database, and table to preview the fields and data results. By default, only 100 data results are displayed.
¡ Click
the ![]() icon in the table field preview area on the left to view keys and
indexes.
icon in the table field preview area on the left to view keys and
indexes.
¡ Click
the ![]() icon in the table field preview area on the left to sort the fields
alphabetically.
icon in the table field preview area on the left to sort the fields
alphabetically.
¡ Click
the ![]() icon in the table field preview area on the left to copy the
previewed SQL statement to the clipboard.
icon in the table field preview area on the left to copy the
previewed SQL statement to the clipboard.
¡ Click
the ![]() icon in the table field preview area on the left to remove the
table preview.
icon in the table field preview area on the left to remove the
table preview.
SQL query
1. On the top navigation bar, click Analytics. From the navigation pane, select Data Analysis > Data Service > Self-Service Query.
2. Customize your query statement in the SQL editor and click Run to view the results.
3. Click the Query History tab to view the history query records and perform the following tasks:
¡ Click
the ![]() icon in the Actions column for a query
history record on the query history list to overwrite the query statement in
the current editor with that record's query statement.
icon in the Actions column for a query
history record on the query history list to overwrite the query statement in
the current editor with that record's query statement.
¡ Click
the ![]() icon in the Actions column for a query
history record to run the query statement in the record on a new tab.
icon in the Actions column for a query
history record to run the query statement in the record on a new tab.
¡ Click
the ![]() icon in the Actions column for a query
history record to delete that record.
icon in the Actions column for a query
history record to delete that record.
Template parameters
A template parameter refers to a variable that uses placeholders to substitute for specific values or conditions. You can pass actual values or conditions to these parameters when executing SQL queries or operations. Use template parameters to make SQL queries more flexible and reusable and reduce the risk of SQL injection. This feature also supports using the Jinja template syntax in SQL applications.
1. On the top navigation bar, click Analytics. From the navigation pane, select Data Analysis > Data Service > Self-Service Query.
2. Click the Parameters button in the lower right corner of the SQL editor. In the Edit Template Parameter dialog box that opens, edit the required template parameters following the format.
Save the query
1. On the top navigation bar, click Analytics. From the navigation pane, select Data Analysis > Data Service > Self-Service Query.
2. After entering the relevant SQL query statement, click the Save query button in the lower right corner of the SQL editor. In the window that opens, configure the query name and description. Click the Save button to save the query separately. Click the Update button to update and save the current query. After saving the query, click the Copy link button in the lower right corner of the SQL editor to copy the query URL.
3. Click the Saved Queries tab on the page to view your saved queries and perform the following tasks:
¡ Click
the ![]() icon in the Actions column for a saved
query to preview the SQL statement in the window that opens. Click the Open in SQL Tab button to open the query on the
self-service query page.
icon in the Actions column for a saved
query to preview the SQL statement in the window that opens. Click the Open in SQL Tab button to open the query on the
self-service query page.
¡ Click
the ![]() icon in the Actions column for a saved
query to open that query on the self-service query page.
icon in the Actions column for a saved
query to open that query on the self-service query page.
¡ Click
the ![]() icon in the Actions column for a saved
query to copy its URL.
icon in the Actions column for a saved
query to copy its URL.
¡ Click
the ![]() icon in the Actions column for a saved
query to delete that query.
icon in the Actions column for a saved
query to delete that query.
Save the dataset
An edited SQL statement can be saved as a virtual dataset.
1. On the top navigation bar, click Analytics. From the navigation pane, select Data Analysis > Data Service > Self-Service Query.
2. After entering the relevant SQL query statement, click the Save dataset button in the lower right corner of the SQL editor. In the window that opens, select to save it as a new dataset or overwrite an existing dataset.
¡ Save as new: After editing the dataset name, click the Save button to save it as a new dataset.
¡ Overwrite existing: After selecting or entering a dataset name, click the Save button to overwrite the existing dataset.
Query history
1. On the top navigation bar, click Analytics. From the navigation pane, select Data Analysis > Data Service > Self-Service Query.
2. Click the Query History tab to view all query records. On this page, you can perform the following tasks:
¡ Click the statement box in the SQL column for a query history to preview the query statement.
¡ Click
the ![]() icon in the Actions column for a query
history record to open that query on the self-service query page.
icon in the Actions column for a query
history record to open that query on the self-service query page.
Manage templates
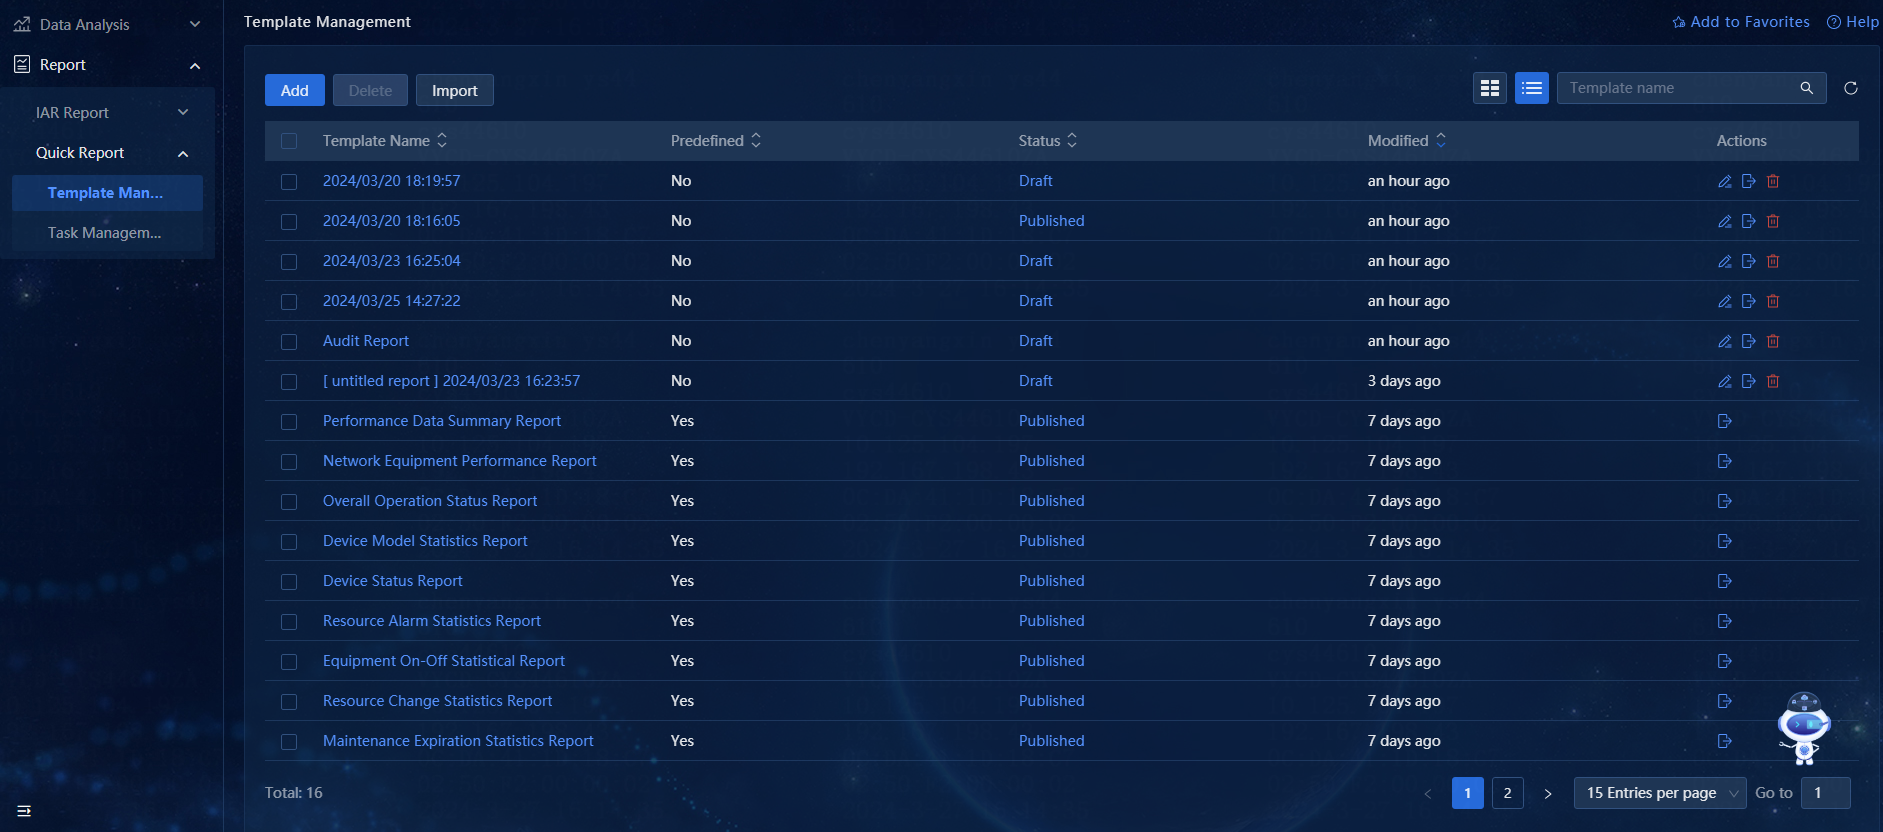
Use this feature to integrate created charts into a template. This feature supports visual drag-and-drop, flexible layout, and a WYSIWYG design style for rapid construction of report templates with a consistent style and layout.
· Support for multiple data sources
¡ Easily displays data from various data sources.
¡ Analyzes and compares data across sources.
· Multi-chart analysis
¡ Displays different types of charts, such as line charts, bar charts, and pie charts, within the same report template.
¡ More fully displays the characteristics and relationships of data, enhancing the depth and richness of data analysis.
· Multi-dimensional statistical analysis and display
¡ Slices and displays data from various dimensions.
¡ Helps users to more fully understand the characteristics and patterns of the data.
· Rich filter options
¡ Sets different filtering conditions based on specific requirements.
¡ Dynamically filters and displays data, enhancing the focus and flexibility of data analysis.
· Custom monitor widget applications
Applies the custom IOM monitor widgets to template management.
Figure 8 Template management page
Create a template
1. On the top navigation bar, click Analytics. From the navigation pane, select Report > Quick Report > Template Management.
2. Click Add.
3. Select layout elements, including overall layout, local layout, filters, and others. Drag the selected layout elements into the tab in the middle of the page.
¡ On the right of the page, set the base margin and block margin for layout elements.
¡ Click
the ![]() icon for a single layout element to set the background to
transparent or white.
icon for a single layout element to set the background to
transparent or white.
¡ Click
the ![]() icon for a single layout element to delete that component.
icon for a single layout element to delete that component.
¡ To add a filter, configure the related filter settings on the right of the page.
4. Select a chart, and drag an existing one from the list on the left into the selected or default layout to combine them as needed.
¡ Click the Create new chart button on the Charts tab on the left to access the Create a chart page, where you can create a new chart.
¡ Click
the ![]() icon in the upper right corner of a chart in the layout to delete
that chart from the layout.
icon in the upper right corner of a chart in the layout to delete
that chart from the layout.
¡ Drag and drop charts freely into other empty columns within the layout.
5. You can add custom monitors by applying the
custom IOM monitor widgets to template management. After dragging a custom
monitor component to the selected or default layout, click the ![]() icon
in the upper right corner of the component. In the dialog box that opens, you
can configure custom monitor information, including major monitor category, subcategory,
and instances.
icon
in the upper right corner of the component. In the dialog box that opens, you
can configure custom monitor information, including major monitor category, subcategory,
and instances.
6. Other actions: Click the ![]() icon
in the upper right corner of the page to perform the following tasks:
icon
in the upper right corner of the page to perform the following tasks:
¡ Edit properties: Edit the template name, color scheme, whether to display vendor, and vendor name of the report template, and click OK. Alternatively, you can set the template name at the top of the Add Template page.
¡ Edit CSS: Set the chart style by writing CSS statements.
7. Set auto-refresh interval: Set the interval for refreshing the report template data, and click the Save button to complete the configuration.
8. Click the ![]() icon in the upper
right corner to save the report template and publish it. Click the
icon in the upper
right corner to save the report template and publish it. Click the ![]() icon
to save the template as a draft. Other users will not be able to see this draft
template in the template list.
icon
to save the template as a draft. Other users will not be able to see this draft
template in the template list.
Import templates
1. On the top navigation bar, click Analytics. From the navigation pane, select Report > Quick Report > Template Management.
2. Click Import. In the dialog box that opens, select a local template file, and then click Import.
Manage templates
You can view, edit, delete, update, and export report templates.
View templates
1. On the top navigation bar, click Analytics. From the navigation pane, select Report > Quick Report > Template Management.
2. On the template management page, view the generated report template list, which displays fields such as template name, predefined status, template status, and more.
3. Click the name of a template to access the report details page. On this page, you can perform the following tasks:
¡ Click the Published/Draft button next to the template name to change its state to draft or published.
¡ Filter conditions: Set the report filter conditions and click Apply to view the filtered report information.
¡ Click the name of a chart in the report to access the Edit chart settings page.
¡ Click
the ![]() icon in the upper right corner of each chart in the report to
perform the following tasks:
icon in the upper right corner of each chart in the report to
perform the following tasks:
- Force refresh: Immediately refresh the chart data.
- Enter fullscreen: Displays the chart in fullscreen mode.
- Edit chart: Access the Edit chart settings page.
- View query: View and copy SQL statements.
- View as table: View a chart as a table.
- Cross-filter scoping: Apply the filter condition for this column to all panels or a specific panel.
- Download: Download charts to your local device as CSV files or images.
¡ Click
the ![]() icon in the upper right corner of the page to perform the following
tasks:
icon in the upper right corner of the page to perform the following
tasks:
- Refresh template: Immediately refresh all data in the report template.
- Download as image: Download the report template as an image to your local device.
- Set auto-refresh interval: Configure the interval for refreshing report template data, and click the Save button to complete the configuration.
Edit a template
Predefined report templates cannot be edited.
Edit properties
1. On the top navigation bar, click Analytics. From the navigation pane, select Report > Quick Report > Template Management.
2. Click the ![]() icon in the Actions column for a template on the template list. In
the Edit Dashboard Properties dialog box that
opens, you can edit the template name, color scheme, whether to display vendor,
and vendor name.
icon in the Actions column for a template on the template list. In
the Edit Dashboard Properties dialog box that
opens, you can edit the template name, color scheme, whether to display vendor,
and vendor name.
3. Click Save.
Edit configuration
1. On the top navigation bar, click Analytics. From the navigation pane, select Report > Quick Report > Template Management.
2. Click the name of a template to access the report details page.
3. Click the ![]() icon in the upper
right corner of the page to access the template update page.
icon in the upper
right corner of the page to access the template update page.
4. After updating the template, click the ![]() icon
in the upper right corner to save the report template.
icon
in the upper right corner to save the report template.
Delete templates
|
|
NOTE: · Predefined report templates cannot be deleted. · Reports templates associated with scheduled tasks cannot be deleted. |
1. On the top navigation bar, click Analytics. From the navigation pane, select Report > Quick Report > Template Management.
2. You can delete a single report template or bulk delete report templates.
¡ Delete a single template: Click the ![]() icon
in the Actions column for the template to be
deleted, and then click OK in the dialog box that
opens.
icon
in the Actions column for the template to be
deleted, and then click OK in the dialog box that
opens.
¡ Bulk delete templates: Select one or more templates from the list and click the Delete button above the list to delete the selected templates.
Export templates
1. On the top navigation bar, click Analytics. From the navigation pane, select Report > Quick Report > Template Management.
2. Click the ![]() icon in Actions column to directly export the template file to
your local device.
icon in Actions column to directly export the template file to
your local device.
Manage tasks
Use this feature to create tasks that run periodically to automate data queries, report generation, or other analysis tasks. These scheduled tasks, also known as timed tasks or periodic tasks, can be configured to execute at various frequencies, such as daily, weekly, or monthly. You can configure email notifications for timely updates on task execution and results.
Figure 9 Task management page
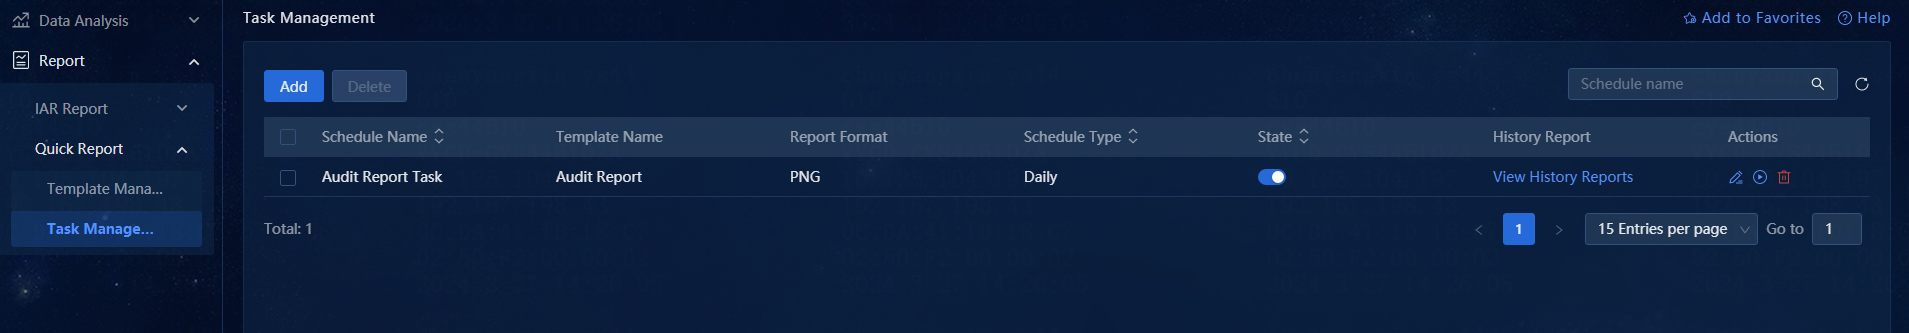
Create a task
1. On the top navigation bar, click Analytics. From the navigation pane, select Report > Quick Report > Task Management.
2. Click Add.
3. Configure the following task information.
¡ Basic Info: Configure the task name, description, and activation state.
¡ Select Template: Select the report template for the task you want to create and the format for generating the report. Supported formats include PNG, XLSX, DOC, and PDF.
¡ Periodic Strategy: Set the schedule type. Options include Daily, Weekly, Monthly, Quarterly, Half-Yearly, and Yearly. The default generation time is at midnight. Set the task expiration date. If you do not set the expiration time, the task never expires. Set the history report retention period, which is 90 days by default. Configure the execution timeout period.
¡ Notification Method: Configure email recipients for report task execution results. You can configure multiple recipients, and notifications will be transmitted once the report is generated.
4. Click OK to save the task.
Manage tasks
You can view, edit, delete, and activate scheduled tasks, and view history reports.
View tasks
1. On the top navigation bar, click Analytics. From the navigation pane, select Report > Quick Report > Task Management.
2. On the Task Management page, view the generated task list, which displays fields such as task name, corresponding template, report format, and task type.
Edit a task
1. On the top navigation bar, click Analytics. From the navigation pane, select Report > Quick Report > Task Management.
2. Click the ![]() icon in the Actions column for a task. On the page that opens,
configure parameter settings as needed to generate reports as needed.
icon in the Actions column for a task. On the page that opens,
configure parameter settings as needed to generate reports as needed.
Delete tasks
1. On the top navigation bar, click Analytics. From the navigation pane, select Report > Quick Report > Task Management.
2. You can delete a single task or bulk delete tasks.
¡ Delete a single task: Click the ![]() icon
in the Actions column for the task to be deleted,
and then click OK in the dialog box that opens.
icon
in the Actions column for the task to be deleted,
and then click OK in the dialog box that opens.
¡ Bulk delete tasks: Select one or more tasks from the list and click the Delete button above the list to delete the selected tasks.
Activate a task
1. On the top navigation bar, click Analytics. From the navigation pane, select Report > Quick Report > Task Management.
2. Click the slider in the State column for a task to activate or deactivate that task directly.
View history reports
1. On the top navigation bar, click Analytics. From the navigation pane, select Report > Quick Report > Task Management.
2. Click the ![]() icon in the History Report column for a task to access the history
report page, where you can perform the following tasks:
icon in the History Report column for a task to access the history
report page, where you can perform the following tasks:
¡ Download history reports: Click the ![]() icon
in the Actions column for a history report to
directly download the report for local viewing.
icon
in the Actions column for a history report to
directly download the report for local viewing.
¡ Delete history reports
- Delete a single history report: Click the ![]() icon in the Actions column for the
history report to be deleted, and then click OK in
the dialog box that opens.
icon in the Actions column for the
history report to be deleted, and then click OK in
the dialog box that opens.
- Bulk delete history reports: Select one or multiple history reports, and click the Delete button above the list to delete the selected history reports.
