- Table of Contents
- Related Documents
-
| Title | Size | Download |
|---|---|---|
| 01-Text | 2.42 MB |
Contents
Install HDM Mobile in Android operating system
Install HDM Mobile in iOS operating system
Prepare rack server environment
Prepare blade server or AE module environment
View network adapter information
View temperature sensor information
View processor sensor information
View memory sensor information
View current sensor information
View voltage sensor information
Introduction
HDM Mobile is the mobile application for HDM. With the application installed, you can add multiple servers in the system to monitor the overall server states, including basic information, hardware information, and sensor information. You can perform health diagnosis for servers by using event logs, and configure power supplies and UID LEDs based on service requirements.
HDM Mobile pages might vary by server model or HDM version. Figures in this document are for illustration only.
Login
Install HDM Mobile
The HDM Mobile app supports Android and iOS operating systems. To install HDM Mobile, you can scan the QR code for downloading or download the application from the Android or iOS application market directly.
Install HDM Mobile in Android operating system
1. Verify that the Android operating system on your mobile device is version 7.0 or later. If not, upgrade the system first.
2. Download HDM Mobile in HUAWEI AppGallery or scan the QR code for downloading as needed.
¡ Open the HUAWEI AppGallery, search for HDM Mobile, and download and install HDM Mobile.
¡ Scan the QR code as shown in Figure 1, and download and install HDM Mobile as prompted.
Figure 1 QR code for downloading HDM Mobile

3. During installation, authorize the permission for HDM Mobile on your device.
The page for the permission authorization varies by operating system.
Install HDM Mobile in iOS operating system
1. Verify that the iOS operating system on you device is version 10.0 or later. If not, upgrade the system first.
2. Download HDM Mobile in App Store or scan the QR code for downloading as needed.
¡ Open App Store, search for HDM Mobile, and download and install HDM Mobile.
¡ Scan the QR code as shown in Figure 3, and download and install HDM Mobile as prompted.
Figure 2 QR code for downloading HDM Mobile

3. During installation, authorize the permission for HDM Mobile.
Prepare rack server environment
Prepare hardware environment
Connect the server to a Wi-Fi router (single or multiple server management)
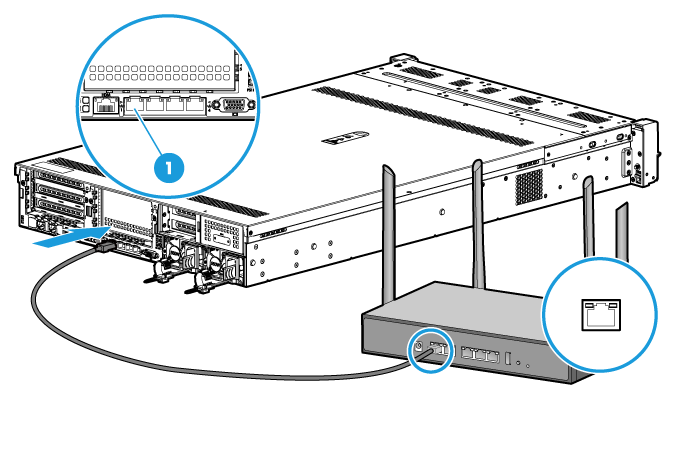
1. Connect a shared port or the dedicated port of the server to a Wi-Fi router.
¡ HDM shared port—Processes HDM management traffic and data traffic.
¡ HDM dedicated port—Processes HDM management traffic.
Figure 3 Connecting the dedicated port to a Wi-Fi router
Connect the server to a USB Wi-Fi adapter (single server management)
Connect a USB Wi-Fi adapter to the server USB port. This method only applies to servers that support HDM wireless management.
Configure networks
Methods for network configuration vary by hardware environment.
· If the server is connected to a Wi-Fi router, configure the Wi-Fi router to make sure that the route to the server is reachable, and then connect your mobile device to the corresponding Wi-Fi.
· If the server is connected to a USB Wi-Fi adapter, access HDM Web interface, configure wireless settings, and then connect your mobile device to the corresponding Wi-Fi. For more information about HDM wireless management, see H3C Servers HDM User Guide.
Obtain HDM login information
Before adding servers, you must obtain the HDM management IP address, username, and password for the device.
The HDM default login information is as shown in Table 1.
Table 1 Default login information
|
Item |
Default value |
|
Username |
admin |
|
Password |
Password@_ |
|
HDM shared port IP address |
Obtained from the DHCP server |
|
HDM dedicated port IP address |
192.168.1.2/24 |
|
HDM wireless network IP address |
192.168.199.1/24 |
Use the following methods to obtain login address.
Access HDM Web interface
1. Log in to HDM from the Web interface. For more information, see H3C Servers HDM User Guide.
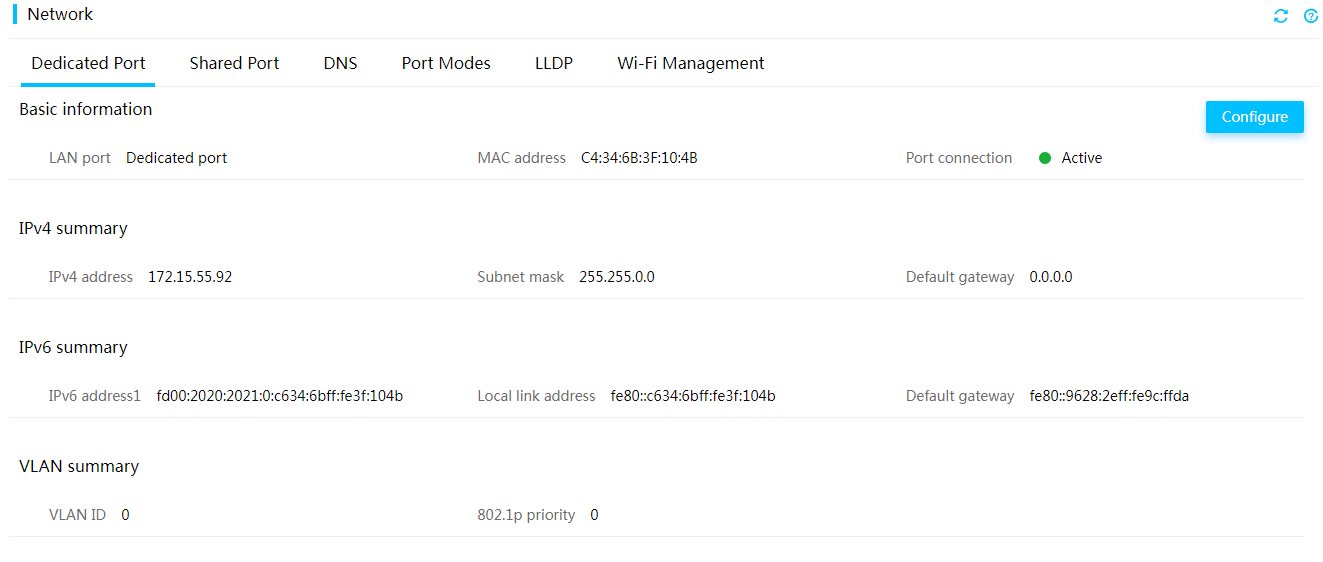
2. Access the Network page, click the Dedicate Port, Shared Port, or Wi-Fi Management tab, and view the corresponding IP address.
Figure 4 Viewing HDM management IP address for the dedicated port
Access the POST screen
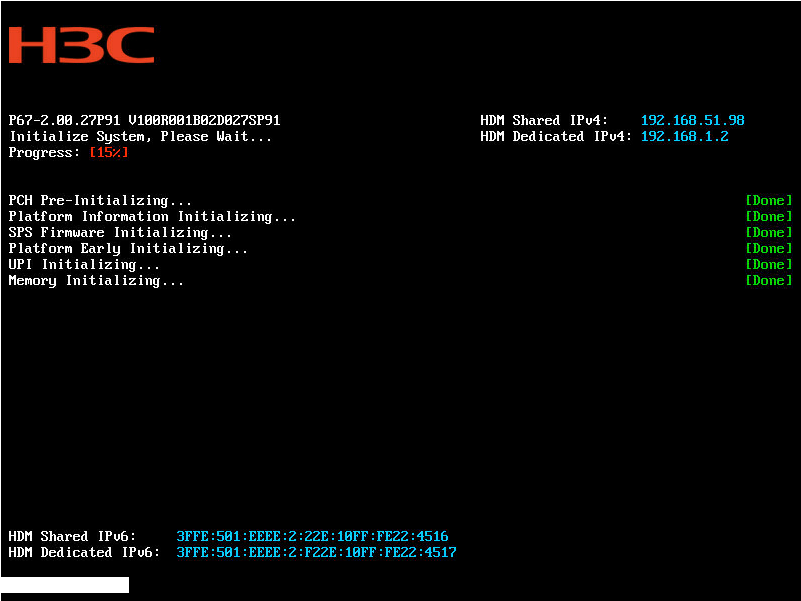
You can access the POST screen to obtain the IP address. Options include HDM Shared IPv4, HDM Dedicated IPv4, HDM Shared IPv6, and HDM Dedicated IPv6.
This method is not available for HDM wireless network IP address.
This section takes BIOS 2.00.27 as an example.
Figure 5 POST screen
Prepare blade server or AE module environment
The login method for blade servers and AE modules are the same. This section takes blade servers as an example.
Prepare hardware environment
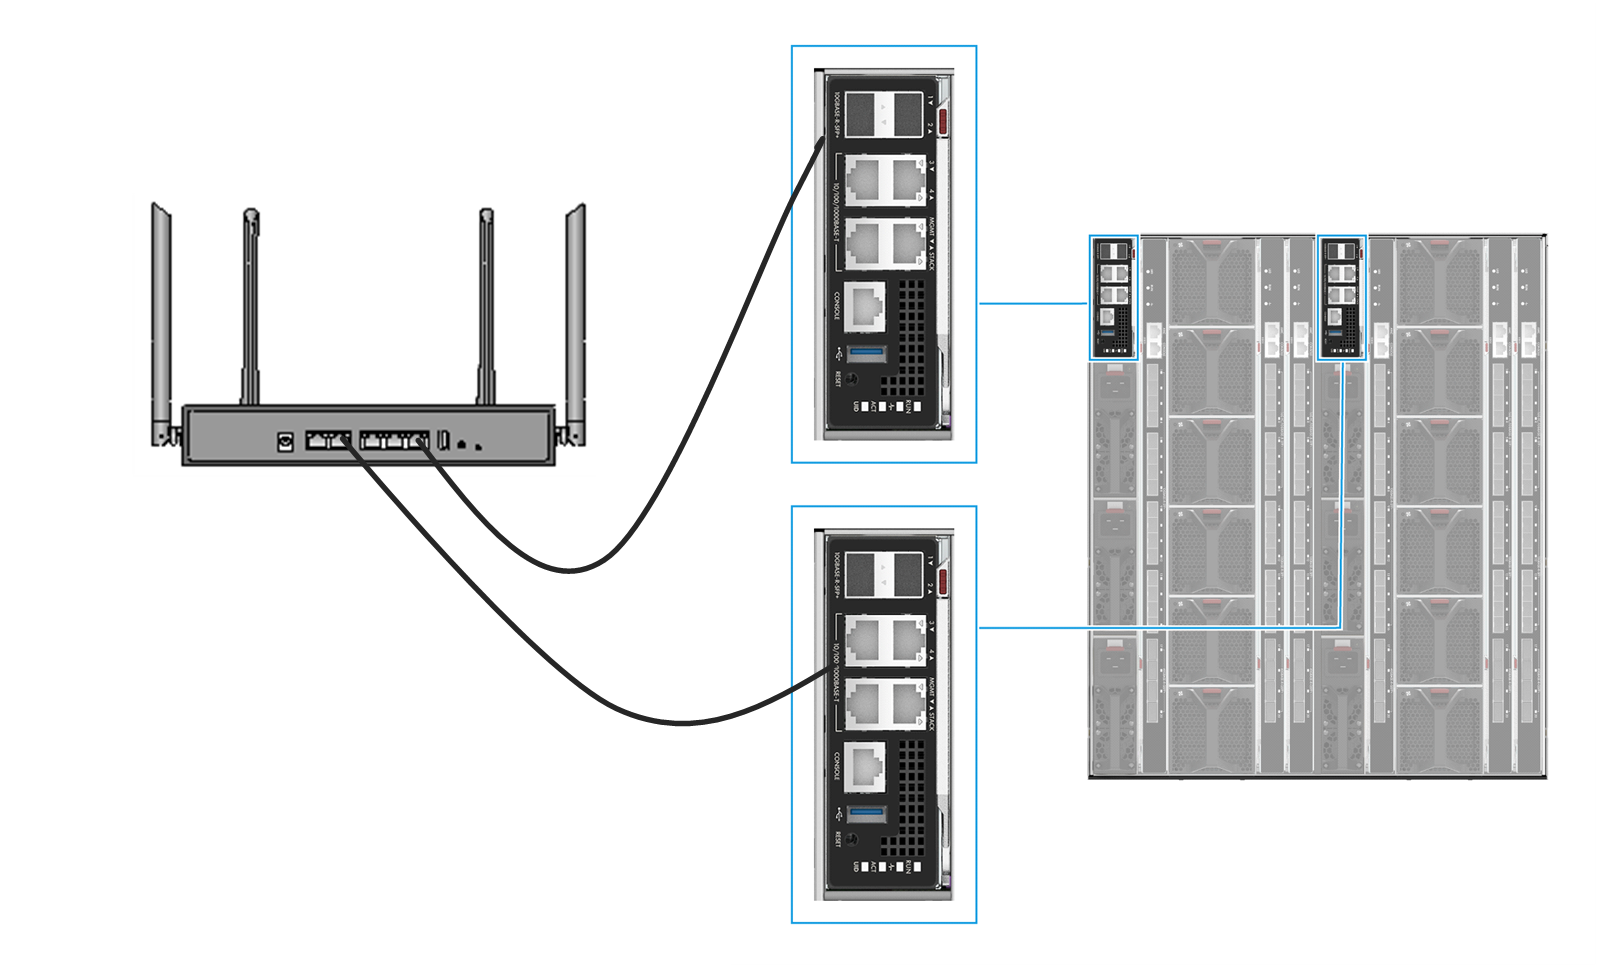
Connect the management ports (MGMT) of the active and standby OM modules to a Wi-Fi router. For information about positions of the management ports, see the marks on the front panels.
Figure 6 Connecting OM modules to a Wi-Fi router
Configure networks
Configure the Wi-Fi router to make sure the routes to OM modules are reachable, and then connect you mobile device to the corresponding Wi-Fi.
Obtain HDM login information
Before adding servers, you must obtain the HDM management IP address, username, and password for the device.
The HDM default login information is as shown in Table 2.
Table 2 Default login information
|
Item |
Default information |
|
Username |
admin |
|
Password |
Password@_ |
Use the following methods to obtain the login IP address.
Access HDM Web interface
1. Log in to HDM from the Web interface. For more information, see H3C Servers HDM User Guide.
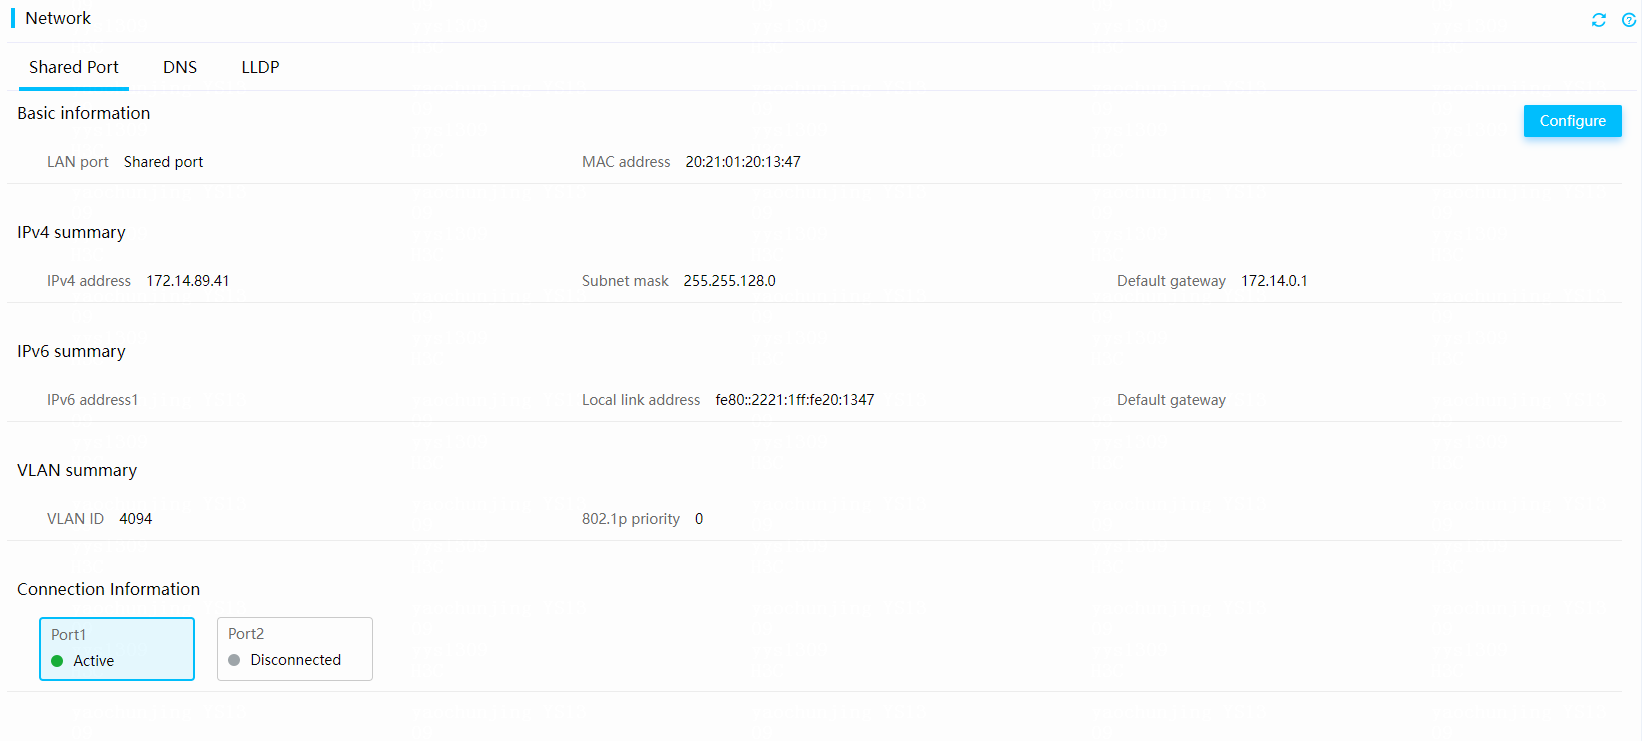
2. Access the Network page, click the Shared Port tab, and view the HDM management IP address.
Figure 7 Viewing HDM management IP address for a blade server
Access the OM Web interface
1. Log in to OM from the Web interface. The default OM login information is as shown in Table 3.
Table 3 Default OM information
|
Item |
Default value |
|
OM management IP address |
192.168.100.100/24 |
|
OM login information |
Username: admin Password: Password@_ |
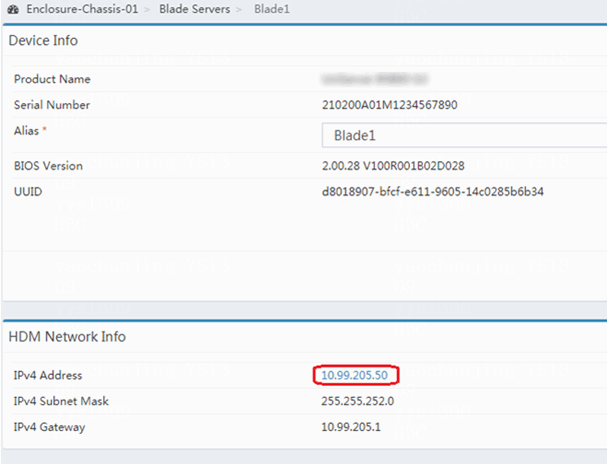
2. On the OM Web interface, access the Enclosure-Chassis-01 > Blade Servers page, and select the target blade server.
3. On the HDM Network Info page, view the HDM management IP address.
Figure 8 Viewing HDM management IP address
Devices
Add a device
You can use this feature to add a maximum of 128 servers and manage the servers in batch.
Before adding a device, make sure that your mobile device and the server HDM management port are connected to the same Wi-Fi.
Restrictions and guidelines
· The ![]() icon indicates
that you can access the server without a password. If the icon does not appear during login, you must enter a password.
icon indicates
that you can access the server without a password. If the icon does not appear during login, you must enter a password.
· If HDM Mobile cannot communicate to the server correctly, the server entry in the device list will be non-editable and colored grey.
· During device adding, if you do not enter the user information as an administrator or operator, the Configuration feature in HDM Mobile will be unavailable.
· If the username or password for an added server is changed, and the session for adding the server is timed out, the server entry in the device list will be non-editable and colored grey.
Procedure
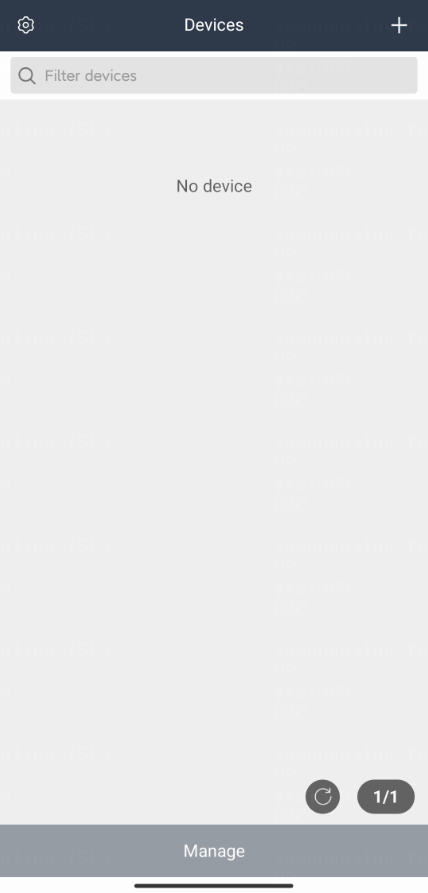
1. Open HDM Mobile and access the Devices page.
Figure 9 Accessing the Devices page
2. Click the ![]() icon in the upper
right corner to access the Add Device page.
icon in the upper
right corner to access the Add Device page.
Figure 10 Adding a device
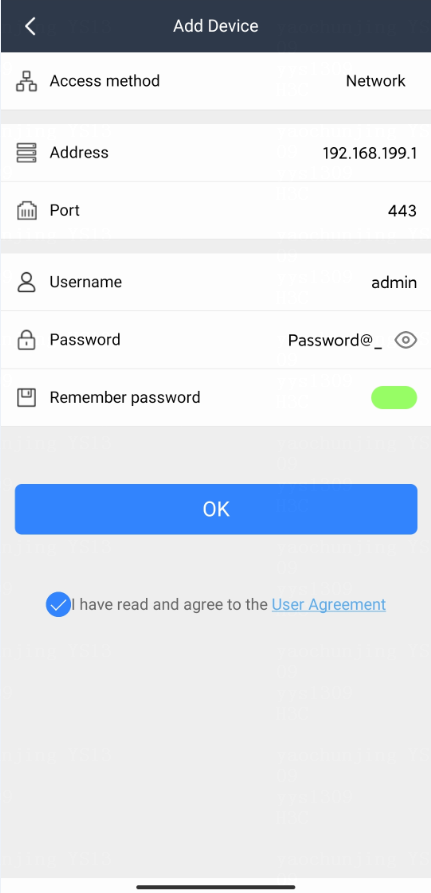
3. Enter the HDM management IP address, port number (default value recommended), username, and password.
4. Enable Remember password as needed.
5. Select I have read and agree to the User Agreement.
6. Click OK.
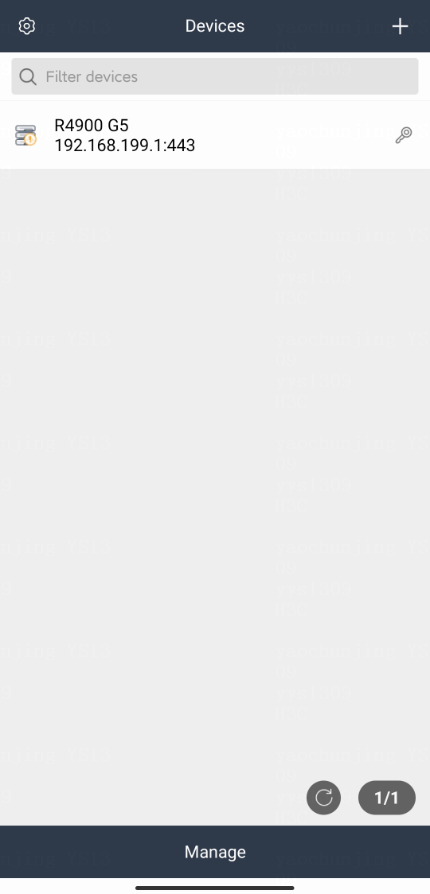
After the device is added, you can view the server model, HDM management IP address, port number, and health state on the Devices page.
Figure 11 Device list

Parameters
Address: HDM management IP address for the server, supporting an IP address or a domain name. This field is required.
Port: HDM management port for the server, in the range of 1 to 65535. The default value is 443. This field is required.
Username: Username for the server. As a best practice, enter the username as an administrator or operator. This field is required.
Password: Password for the server. As a best practice, enter the password as an administrator or operator. This field is required.
Edit a device
1. Open HDM Mobile and access the Devices page.
2. Press and hold the target sever. In the dialog box that opens, click Edit.
Figure 12 Editing a device
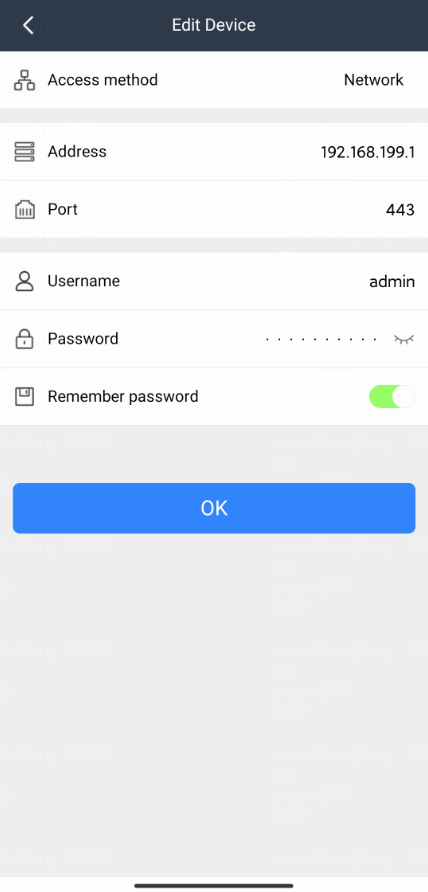
3. Edit the device information, and click OK.
4. To refresh the page, click the ![]() icon
at the bottom of the page.
icon
at the bottom of the page.
Delete a device
1. Open HDM Mobile and access the Devices page.
2. Press and hold the target server. In the dialog box that opens, click Delete.
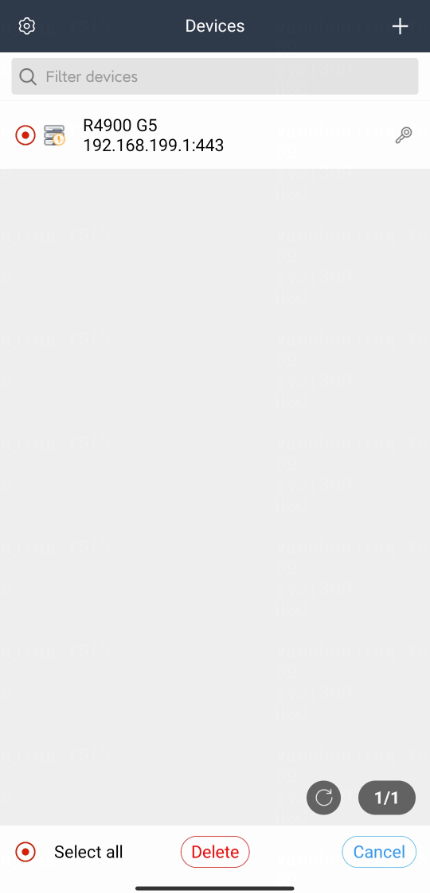
3. To delete devices in batch, click Manage at the bottom of the page. Select target devices or click Select all, and click Delete.
4. To refresh the page, click the ![]() icon
at the bottom of the page.
icon
at the bottom of the page.
Figure 13 Deleting devices
Search for a device
1. Open HDM Mobile and access the Devices page.
2. In the search box, enter the target HDM management IP address or port number.
Figure 14 Searching for a device
Log in to a device
1. Open HDM Mobile and access the Devices page.
2. Click the target device in the device list.
3. Enter the login password for the server if you do not enable Remember Password.
Figure 15 Accessing a device
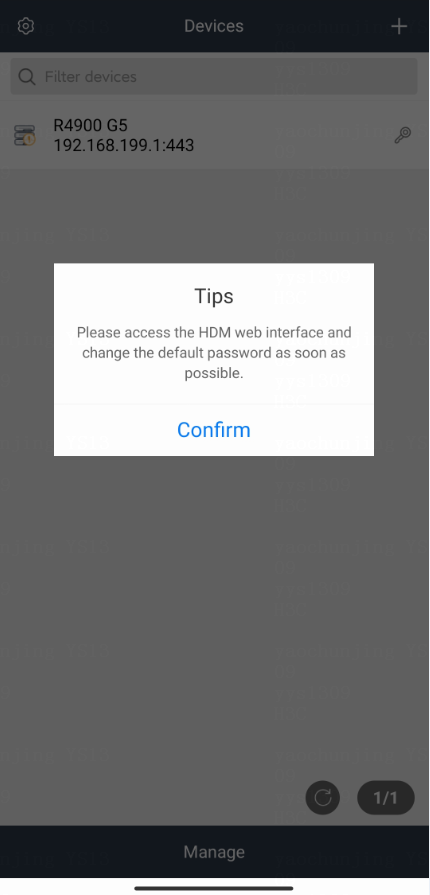
Switch a device
Perform the following tasks to switch and manage another device:
1. Open HDM Mobile and access the Devices page.
2. Click the current server in the device list.
3. Click the Me menu.
4. Click Log out. You will be placed back onto the Devices page.
5. Click another server you want to manage in the device list.
Figure 16 Exiting the current login account

Configure HDM Mobile
View HDM Mobile information
1. Open HDM Mobile and access the Devices page.
2. Click the settings icon in the upper left corner.
Figure 17 Configuring HDM Mobile
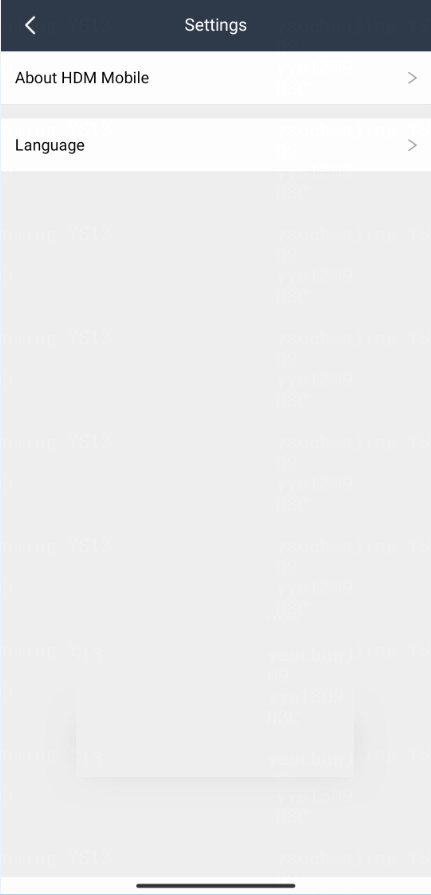
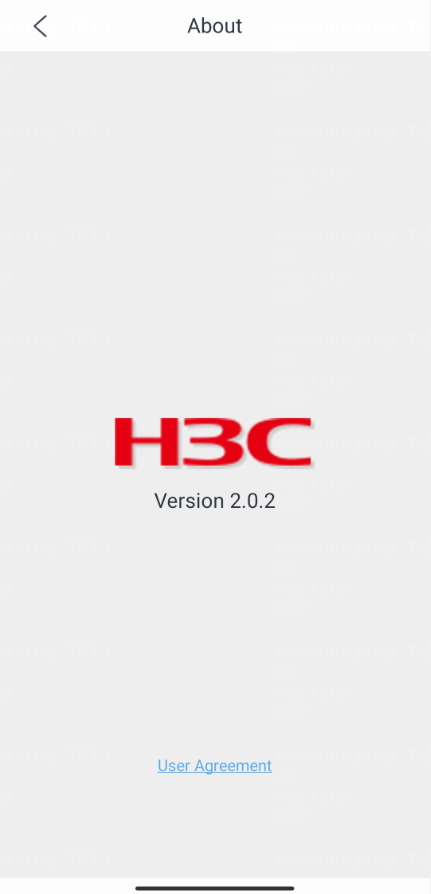
3. Click About HDM Mobile to view the version information and user agreement for HDM Mobile.
Figure 18 HDM Mobile version information and user agreement
Set HDM Mobile languages
1. Open HDM Mobile and access the Devices page.
2. Click the settings icon in the upper left corner.
3. Click Language to open the language setting page.
HDM Mobile supports simplified Chinese and English.
4. Select a language.
5. Click OK.
Figure 19 Setting languages

Dashboard
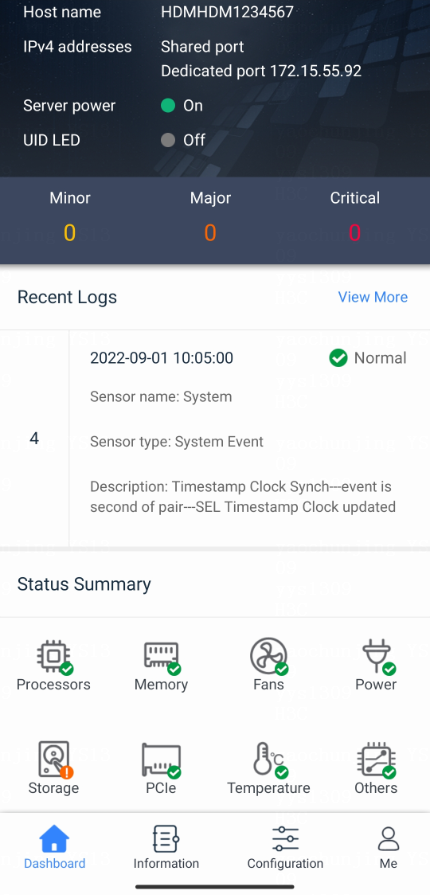
You can view device details on the dashboard, including basic information, alarm information, log information, and basic states. Configurations vary by sever model.
Basic information
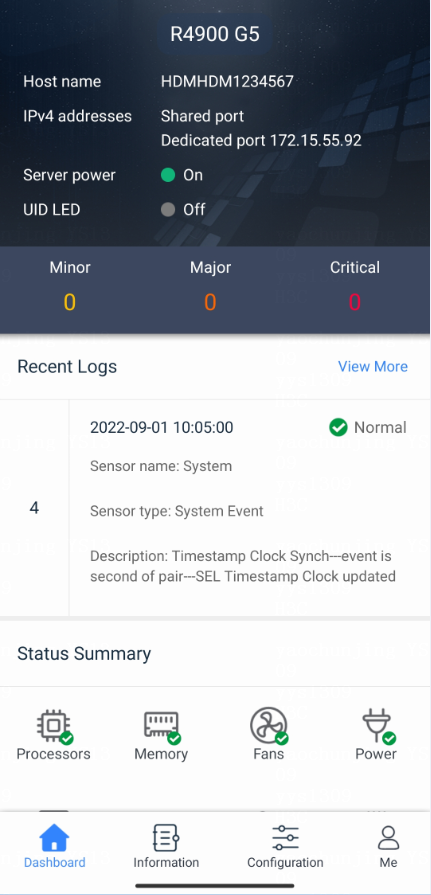
Perform this task to view basic information for the server, including the device model, host name, HDM firmware version, HDM management IPv4 address, power supply states, and UID LED states.
Procedure
1. Open HDM Mobile and access the Devices page.
2. Click the target server to access the Dashboard page for the server.
3. View basic information for the server.
Parameters
· IPv4 addresses: IPv4 addresses of the network ports for accessing HDM.
· Server power: Power supply state for the server. Options include On and Off.
· UID LED: UID LED state for the server. Options include:
¡ On—The UID LED is steady blue. The server is selected.
¡ Flashing—The UID LED is flashing blue. A firmware update is being performed on the server or if the remote console is open.
¡ Off—The UID LED is off. The server is not selected.
Alarm information
1. Open HDM Mobile and access the Devices page.
2. Click the target server to access the Dashboard page for the server.
3. View the alarm information for the server as shown in Figure 22.
4. Click the alarm information to access the Event Log page.
Parameters
· Minor: The failure has minor impacts on the system. Prompt action is required to avoid an escalation in severity.
· Major: The event might cause part of the system to fail and result in service interruption. Immediate action is required.
· Critical: The event might result in system outage or power failure. Immediate action is required.
Recent logs
1. Open HDM Mobile and access the Devices page.
2. Click the target server to access the Dashboard page for the server.
3. View recent logs for the server as shown in Figure 22.
4. Click View More to access the Event Log page for more log information.
Status Summary
Perform this task to monitor the operation and health states of subsystems for the server.
Procedure
1. Open HDM Mobile and access the Devices page.
2. Click the target server to access the Dashboard page for the server.
3. The Status Summary section displays subsystems and monitors health states for subsystems.
4. If a subsystem is faulty, you can view the reasons on the corresponding sensor information page or hardware information page.
Figure 21 Status summary
Parameters
· The following severity levels indicate the health state for the server:
¡ ![]() Normal: All components for
the server are working correctly.
Normal: All components for
the server are working correctly.
¡ ![]() Minor,
Minor, ![]() Major, and
Major, and ![]() Critical indicate that some of
the server components are faulty.
Critical indicate that some of
the server components are faulty.
· The following severity levels indicate health states for subsystem components.
¡ ![]() Normal: The component is working correctly.
Normal: The component is working correctly.
¡ ![]() Minor: The
performance for the component has degraded by a minor failure.
Minor: The
performance for the component has degraded by a minor failure.
¡ ![]() Major: The performance for the component has obviously degraded by a
major failure.
Major: The performance for the component has obviously degraded by a
major failure.
¡ ![]() Critical: The
server might be shut down automatically to avoid component damages.
Critical: The
server might be shut down automatically to avoid component damages.
· Summary of a component health states is shown in Table 4. Subsystem types and states might vary by HDM version. For more information, see the HDM online help.
Table 4 Component health states
|
Subsystem |
State |
Description |
|
Processors |
|
The processors are operating correctly. |
|
|
A recoverable processor error has occurred. |
|
|
|
An overtemperature condition has occurred or a processor configuration error is present. |
|
|
|
One of the following conditions exists: · The temperature of the processor has exceeded the critical threshold. · An unrecoverable processor error has occurred. · The primary processor is absent. · The BIOS gets stuck at the POST phase because of a processor error. |
|
|
Memory |
|
The memory is operating correctly. |
|
|
A recoverable memory error has occurred. |
|
|
|
One of the following conditions exists: · All memory modules are absent or isolated. · An unrecoverable memory error has occurred. · Incorrect DIMM installation or DIMM incompatibility. |
|
|
|
The BIOS gets stuck at the POST phase because of a memory error. |
|
|
Fans |
|
The fans are operating correctly in redundancy. None of the fans at critical locations have failed. |
|
|
The fan speed has reduced or fan redundancy issue is present because a fan at the critical location has failed. |
|
|
|
Fan redundancy issue is present because fans at two or more critical locations have failed. |
|
|
Power supplies |
|
The power supply is operating correctly. |
|
|
The power supply is not in redundancy. |
|
|
|
A severe power supply error has occurred. |
|
|
Storage |
|
All logical drives, physical drives, and storage controllers are operating correctly. |
|
|
· A logical drive error has occurred. · A physical drive error has occurred. · A storage controller error has occurred. |
|
|
PCIe modules |
|
All PCIe modules are operating correctly. |
|
|
A bus uncorrectable error, bus fatal error, or PCIe err error has occurred. |
|
|
Temperature |
|
All component temperatures are within the normal range. |
|
|
The temperature has crosses a minor threshold, but is has not reached a major threshold. |
|
|
|
The temperature has crossed a major threshold, but it has not reached a critical threshold. |
|
|
|
The temperature has crossed a critical threshold. |
|
|
Others |
|
All components are operating correctly. |
|
|
A major component error has occurred. |
|
|
|
A critical component error has occurred. |
Information
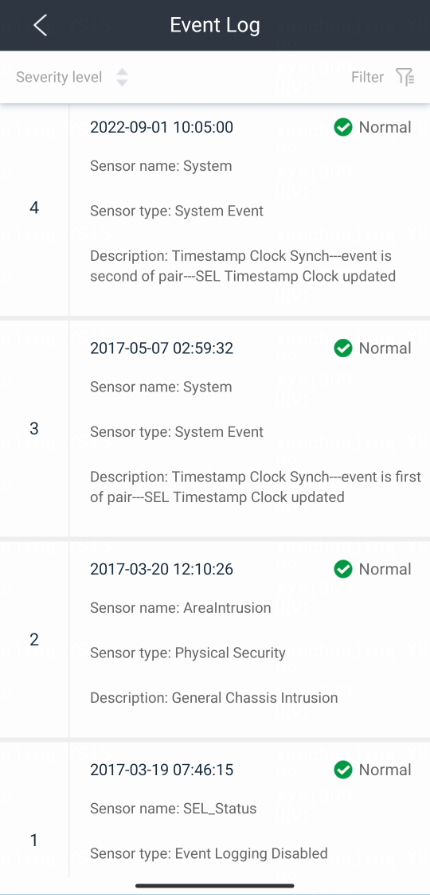
Event log
Perform this task to view event logs reported by sensors. If you identify an event log for an abnormal state, access HDM Web interface for action suggestions and resolve the issue.
Restrictions and guidelines
When the number of event logs reaches the upper limit (3639), the system will store event logs based on configured event log policies.
Procedure
1. Open HDM Mobile and access the Devices page.
2. Click the target server to access the Dashboard page for the server.
3. Click the Information > Event Log menu.
Figure 22 Event log
4. Click Filter in the upper right corner.
Figure 23 Filtering logs
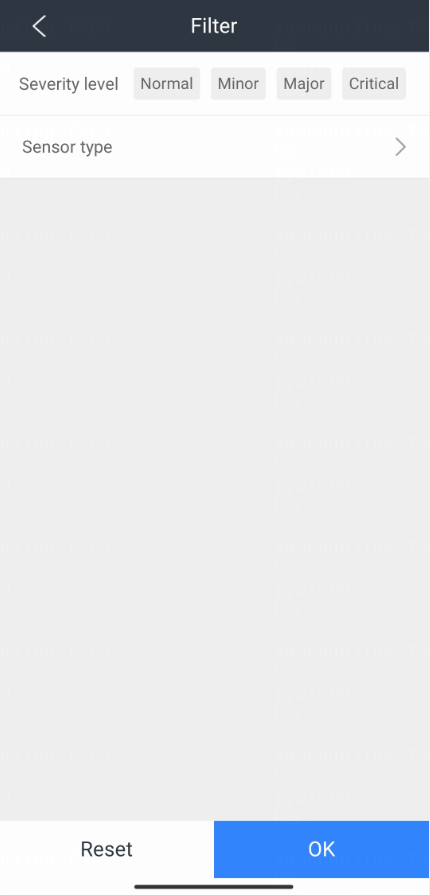
¡ Select one or more severities. The Event Log page will display event logs with the selected severities.
¡ Select sensor types. The Event Log page will display event logs generated by the sensors.
5. Click OK.
6. To cancel filtering, click Reset.
Parameters
· ID: Event number. Events are numbered in chronological order. By default, the events in the event list are sorted by event number in ascending order.
· Event log severities include the following levels:
¡ Normal—The event does not adversely affect the system. No action is required. Examples of normal events include expected state change events and alarm removed events.
¡ Minor—The event has minor impacts on the system. Prompt action is required to avoid an escalation in severity.
¡ Major—The event might cause part of the system to fail and result in service interruption. Immediate action is required.
¡ Critical—The event might result in system outage or power failure. Immediate action is required.
Hardware
Perform this task to view information for hardware such as processors, memories, and PCIe modules. Configurations vary by server model.
|
|
CAUTION: · When the server is down, the Processors tab and the Memory tab display information of the last POST phase. · During POST, information for processors, memory, and PCIe modules might be incorrect or incomplete. To obtain the correct information, refresh the page after the server POST. |
View processor information
Procedure
1. Open HDM Mobile and access the Devices page.
2. Click the target server to access the Dashboard page for the server.
3. Click the Information > Hardware menu.
4. Click Processors.
Figure 24 Processor information
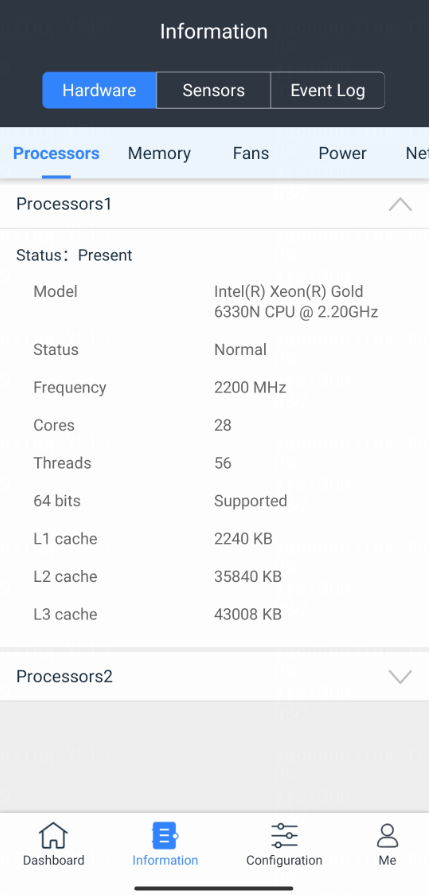
Parameters
· Model: Model of the processor.
· Status: Status for the processor. Options include Present and Absent.
· Frequency: Base frequency of the server.
· Status: Operation status for the server. Options include Normal and Abnormal.
· Cores: Number of cores for the server.
· Threads: Maximum number of threads supported by the server.
· 64 bits: Support of the processor for 64-bit computing.
· L1 cache: L1 cache of the processor.
· L2 cache: L2 cache of the processor.
· L3 cache: L3 cache of the processor.
View memory information
Restrictions and guidelines
· If a DIMM is absent, the Status field displays Absent, and the rest fields display a tilde (~).
· If a DIMM is abnormal, the Status field displays Abnormal, and the rest fields display a tilde (~).
· When a channel is disabled because of a DIMM training error, the Status fields for other present DIMMs in the channel display Abnormal, and the rest fields for these DIMMs display a tilde (~).
Procedure
1. Open HDM Mobile and access the Devices page.
2. Click the target server to access the Dashboard page for the server.
3. Click the Information > Hardware menu.
4. Click Memory.
Figure 25 Memory information
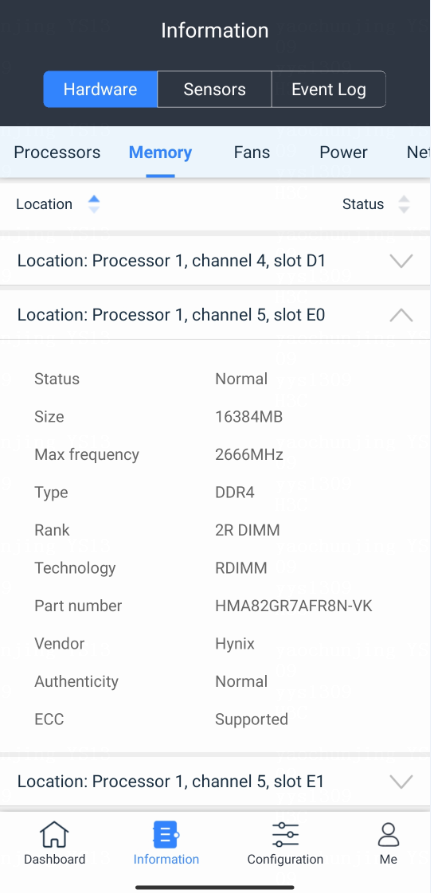
Parameters
· Location: Processor ID of a DIMM.
· Channel: Channel ID of a DIMM processor.
· Slot: Slot number of a DIMM.
· Status: Status of a DIMM. Options include Absent, Non-Initialized, Normal, and Abnormal.
· Max frequency: Main frequency of the memory module.
· Technology: Technology of the DIMM.
· Authenticity: Authentication status for a DIMM. Normal indicates that the DIMM is unauthorized. Authorized indicates that the DIMM has been authorized.
· ECC: Support for error-correcting code (ECC).
View fan information
Procedure
1. Open HDM Mobile and access the Devices page.
2. Click the target server to access the Dashboard page for the server.
3. Click the Information > Hardware menu.
4. Click Fans.
Figure 26 Fan information
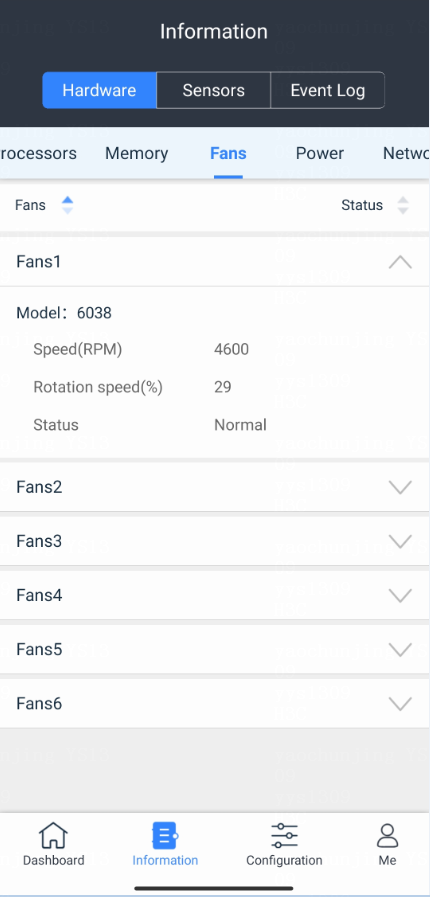
Parameters
· Model: Fan module.
· Rotation speed (RPM): Current actual rotational speed of the fan.
· Rotation speed (%): Ideal RPM based on current temperature as a percentage of the rated RPM.
· Status: Health status of the fan.
View power supply information
Procedure
1. Open HDM Mobile and access the Devices page.
2. Click the target server to access the Dashboard page for the server.
3. Click the Information > Hardware menu.
4. Click Power.
Figure 27 Power supply information
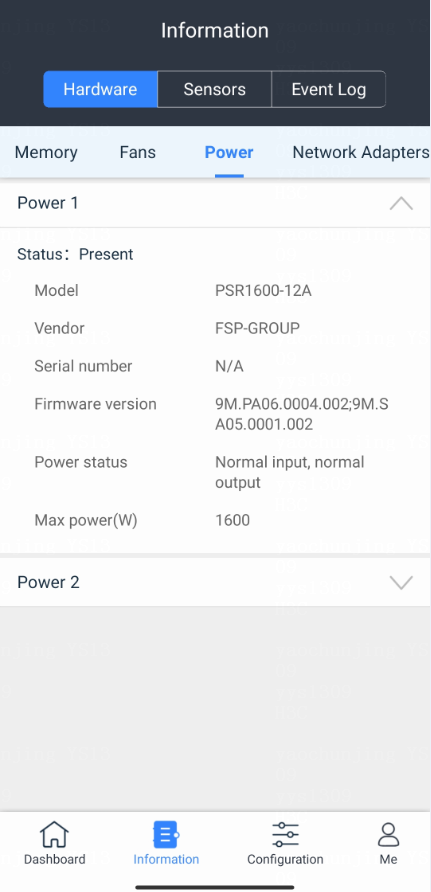
Parameters
· Status: Current status of the power supply. Options include Present and Absent.
· Model: Model of the power supply.
· Vendor: Manufacturer of the power supply.
· Serial number: Unique code assigned by the manufacturer.
· Firmware version: Firmware version of the power supply.
· Power status: Power output status.
· Max power (W): Maximum output power of the power supply.
· Power supply redundancy state:
¡ Abnormal—Indicates that the required fans are absent or damaged.
¡ Normal—Indicates that the required fans are correctly present with the optional fans present or absent.
View network adapter information
Procedure
1. Open HDM Mobile and access the Devices page.
2. Click the target server to access the Dashboard page for the server.
3. Click the Information > Hardware menu.
4. Click Network Adapters.
Figure 28 Network adapter information
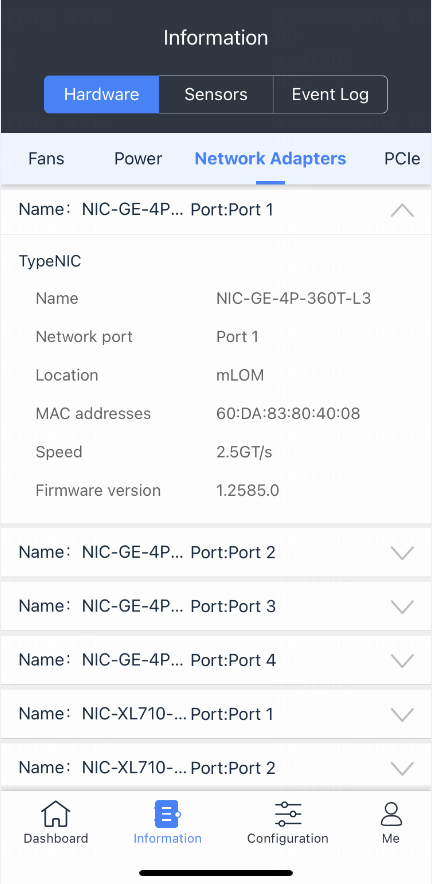
Parameters
· TypeNIC: Type of the network adapter.
· Name: Name of the network adapter.
· Network port: Port number of the network adapter.
· Location: Location of the network adapter.
· MAC addresses: MAC address of the network port.
· Speed: Rate of the network port.
· Firmware version: Firmware version of the network port.
View PCIe module information
Procedure
1. Open HDM Mobile and access the Devices page.
2. Click the target server to access the Dashboard page for the server.
3. Click the Information > Hardware menu.
4. Click PCIe.
Figure 29 PCIe module information
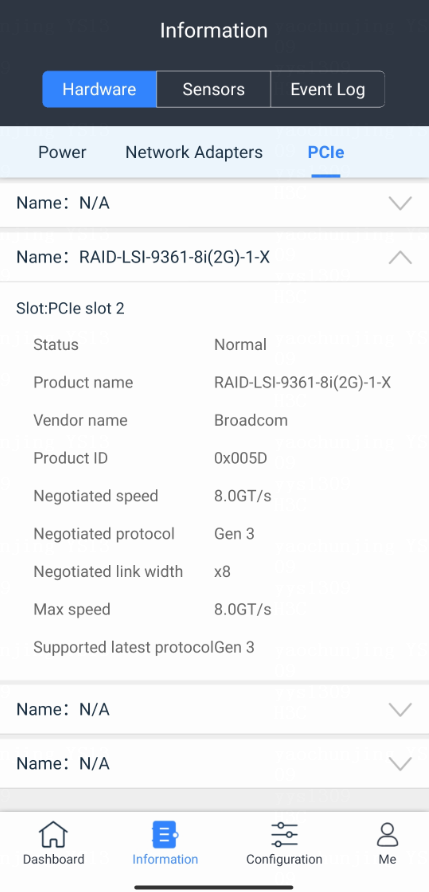
Parameters
· Slot: Slot of the PCIe module. For more information about slot locations, see the user guide for the server.
· Status: PCIe module status, including Normal and Abnormal.
· Product name: Model of the PCIe module.
· Vendor name: Manufacturer of the PCIe module.
· Product ID: ID assigned by the manufacturer.
· Negotiated speed: Auto-negotiated PCIe link rate.
· Negotiated protocol: Auto-negotiated generation of the PCIe standard.
· Negotiated link width: Auto-negotiated PCIe link bandwidth.
· Max speed: Maximum PCIe link rate.
· Supported latest protocol: Supported latest generation of the PCIe standard.
Sensors
Perform this task to view readings of temperature sensors. For more information about sensors, see the HDM online help. Support for sensors varies by server model.
View temperature sensor information
Procedure
1. Open HDM Mobile and access the Devices page.
2. Click the target server to access the Dashboard page for the server.
3. Click the Information > Sensors menu.
4. Click the Temperature tab.
Figure 30 Temperature sensor information
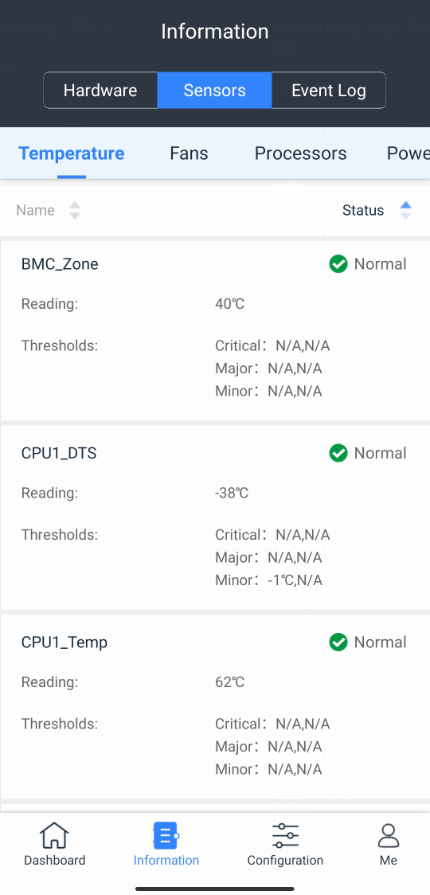
Parameters
· Status: Temperature status of a component:
¡ Normal—The temperature is normal, between the lower and upper minor thresholds (exclusive). No action is required.
¡ Minor—The temperature is between the lower major threshold (exclusive) and lower minor threshold (inclusive) or between the upper minor threshold (inclusive) and upper major threshold exclusive). Administrative attention is required.
¡ Major—The temperature is between the lower critical threshold (exclusive) and lower major threshold (inclusive) or between the upper major threshold (inclusive) and upper critical threshold (exclusive). Immediate action is required.
¡ Critical—The temperature is equal to or below the lower critical threshold, or it is equal to or above the upper critical threshold. Immediate action is required.
¡ N/A—The monitored component is not installed or the temperature sensor cannot be read.
· Reading: Current temperature. If BMC fails to read the sensor, this field displays N/A.
· Thresholds: Temperature thresholds:
¡ Critical—Lower and upper critical thresholds. When the temperature reaches either threshold, the server might automatically shut down to avoid damage to its components.
¡ Major—Lower and upper major thresholds. If the temperature reaches either threshold, server performance will significantly degrade.
¡ Minor—Lower and upper minor thresholds. If the temperature reaches either threshold, server performance will slightly degrade.
View fan sensor information
Perform this task to view fan information and configure the fan speed mode.
Procedure
1. Open HDM Mobile and access the Devices page.
2. Click the target server to access the Dashboard page for the server.
3. Click the Information > Sensors menu.
4. Click the Fans tab.
Figure 31 Fan sensor information
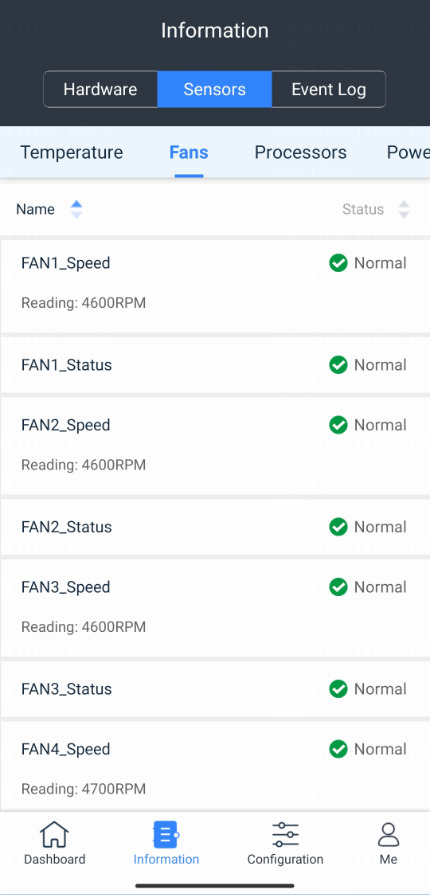
Parameters
· Status: Operation status of the fan. Options include:
¡ Normal—The fan is present and working correctly.
¡ Minor—The fan rotation speed has degraded
¡ Major—The fan is absent or has installation errors.
¡ N/A—The fan is absent or the rotator speed is abnormal.
· Reading: Indicates the rotation speed or operation status for the fan.
View processor sensor information
Perform this task to view operation status for the processor.
Procedure
1. Open HDM Mobile and access the Devices page.
2. Click the target server to access the Dashboard page for the server.
3. Click the Information > Sensors menu.
4. Click the Processors tab.
Figure 32 Processor sensor information
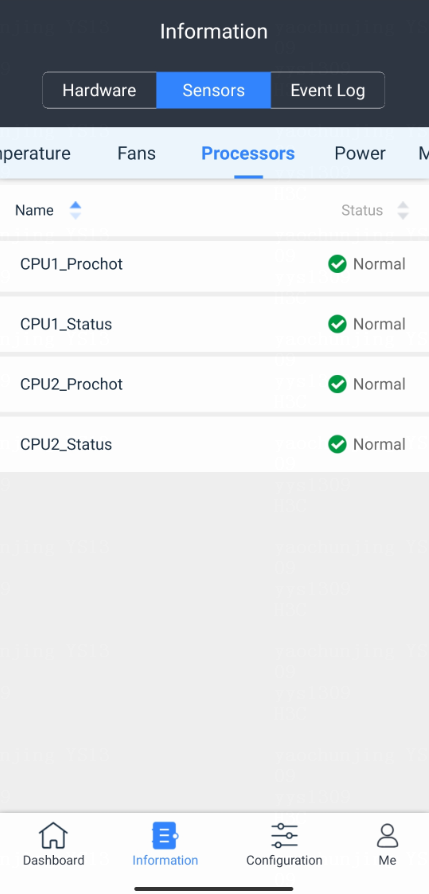
Parameters
Status: Status of the processor. Options include:
· Normal—The processor is working correctly.
· Minor—A recoverable processor error has occurred.
· Major—An overtemperature condition has occurred or a processor configuration error is present.
· Critical—One of the following conditions exists:
¡ The temperature of the processor has exceeded the critical threshold.
¡ An unrecoverable processor error has occurred.
¡ The primary processor is absent.
¡ The BIOS gets stuck at the POST phase because of a processor error.
· N/A—The processor is absent.
View power supply information
Perform this task to view the input power and operation status for the power supply.
Procedure
1. Open HDM Mobile and access the Devices page.
2. Click the target server to access the Dashboard page for the server.
3. Click the Information > Sensors menu.
4. Click the Power tab.
Figure 33 Power supply sensor information
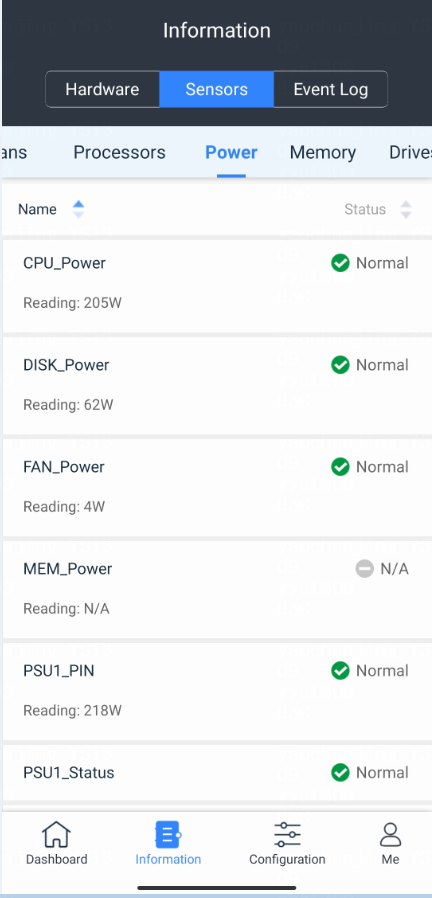
Parameters
· Status:
¡ CPU_Power—Total power of all present processors.
- Normal—Processors are present and the system is powered on.
- N/A—All processors are absent or the system is powered off.
¡ DISK_Power: Total power of all present drives.
- Normal—The drive backplane is working correctly and the system is powered on.
- N/A—The drive backplane is not initialized or the system is powered off.
¡ Fan _Power: Total power of all present fans.
- Normal—Fans are present and the system is powered on.
- N/A—All fans are absent or the system is powered off.
¡ MEM_Power: Total power of present DIMMs.
- Normal—DIMMs are present and the system is powered on.
- N/A—All DIMMs are absent or the system is powered off.
¡ PSUnumber_PIN: Input power of the power supply module.
- Normal—Power is input.
- N/A—No power is input.
¡ PSUnumber_Status: Operation status of the power supply module.
- Normal—The power supply module is present and in cold backup status.
- Minor—A predictive alarm occurs to the power supply module.
- Major—Errors are detected, including power supply failure, predictive alarms, loss of AC/DC power source, power input out of range, and configuration errors.
- N/A—The power supply module is absent.
¡ PSU_Redundancy: Redundancy status of the power supply module.
- Normal.
- Minor—The power supply is not in redundancy.
¡ Total_Power: Input power for the server.
- Normal—The input power for the server is obtained correctly.
- N/A—Unable to obtain the input power for the server.
· Reading:
¡ CPU_Power—Total power of all present processors.
¡ DISK_Power—Total power of all present drives.
¡ Fan_Power—Total power of all present fans.
¡ MEM_Power—Total power of all present DIMMs.
¡ PSUnumber_PIN—Current input power for the power supply module.
¡ Total_Power—Input power for the server.
View memory sensor information
Perform this task to view the operation status for the memory.
Procedure
1. Open HDM Mobile and access the Devices page.
2. Click the target server to access the Dashboard page for the server.
3. Click the Information > Sensors menu.
4. Click the Memory tab.
Figure 34 Memory sensor information
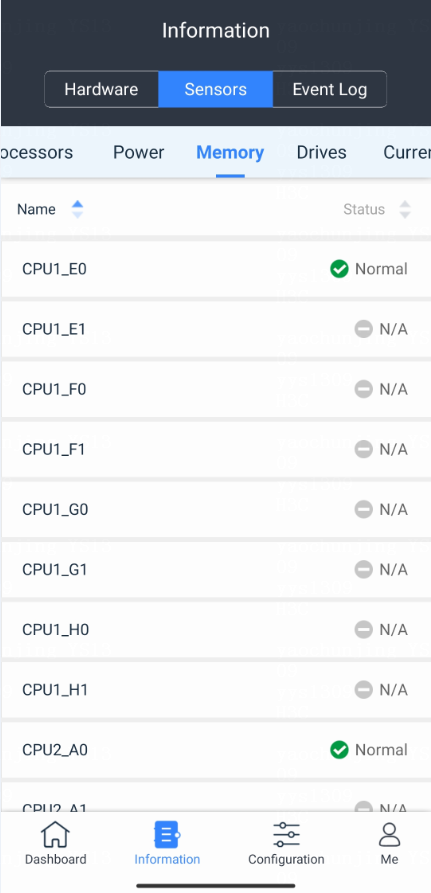
Parameters
Status: DIMM operation status. Options include:
· Normal—The DIMM is present and operating correctly.
· N/A—The DIMM is absent.
· Minor/Major/Critical—The DIMM cannot work correctly.
View drive sensor information
Procedure
1. Open HDM Mobile and access the Devices page.
2. Click the target server to access the Dashboard page for the server.
3. Click the Information > Sensors menu.
4. Click the Drives tab.
Figure 35 Drive sensor information
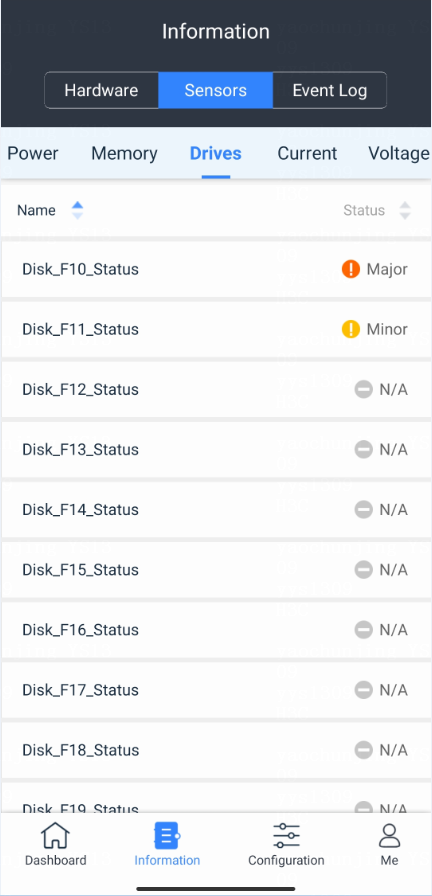
Parameters
Status: Drive status. Options include:
· Normal—The drives is present and operating correctly.
· N/A—The Drive is absent.
· Minor/Major/Critical—A Failure has occurred to the drive.
View current sensor information
Perform this task to view whether overcurrent occurs to system board components.
Procedure
1. Open HDM Mobile and access the Devices page.
2. Click the target server to access the Dashboard page for the server.
3. Click the Information > Sensors menu.
4. Click the Current tab.
Figure 36 Current sensor information
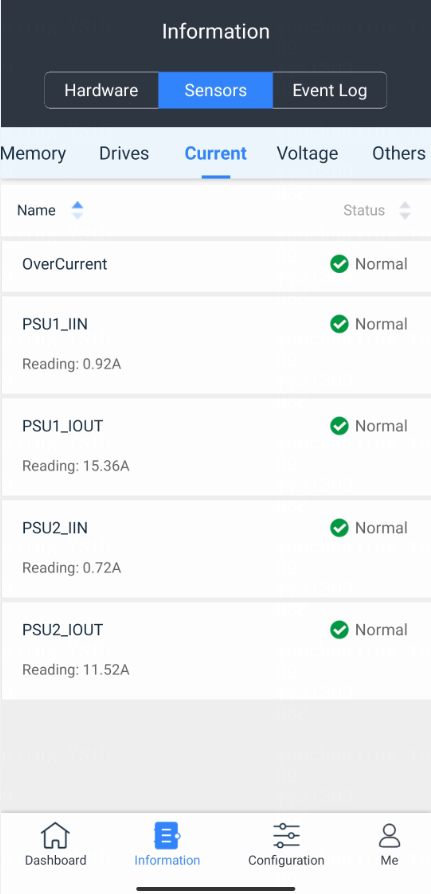
Parameters
· Status: Current status. Options include:
¡ Normal—A current failure is removed or the current value is between the lower minor threshold (exclusive) and upper minor threshold (exclusive).
¡ Major—A current failure is triggered or the current value is between the lower major threshold and the upper major threshold.
¡ Critical—The current value is between the lower critical threshold and the upper critical threshold.
¡ N/A—The sensor is faulty or the server is not powered on.
· Reading: Displays the current value for a system board component.
View voltage sensor information
Perform this task to view the voltage states for system board components.
Procedure
1. Open HDM Mobile and access the Devices page.
2. Click the target server to access the Dashboard page for the server.
3. Click the Information > Sensors menu.
4. Click the Voltage tab.
Figure 37 Voltage sensor information
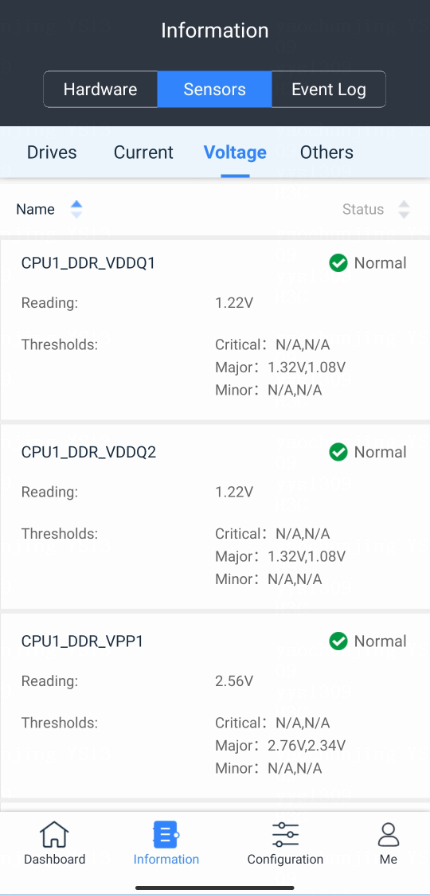
Parameters
· Status: Voltage status. Options include:
¡ Normal—A voltage failure is removed or the voltage value is between the lower minor threshold (exclusive) and upper minor threshold (exclusive).
¡ Major—A voltage failure is triggered or the voltage value is over the upper major threshold or below the lower major threshold.
¡ N/A—The component is not installed or unable to obtain the voltage reading.
· Reading: Displays the voltage value for a system board component.
· Threshold: Voltage thresholds for a system board component in different severities, including upper thresholds and lower thresholds for minor, major, and critical levels.
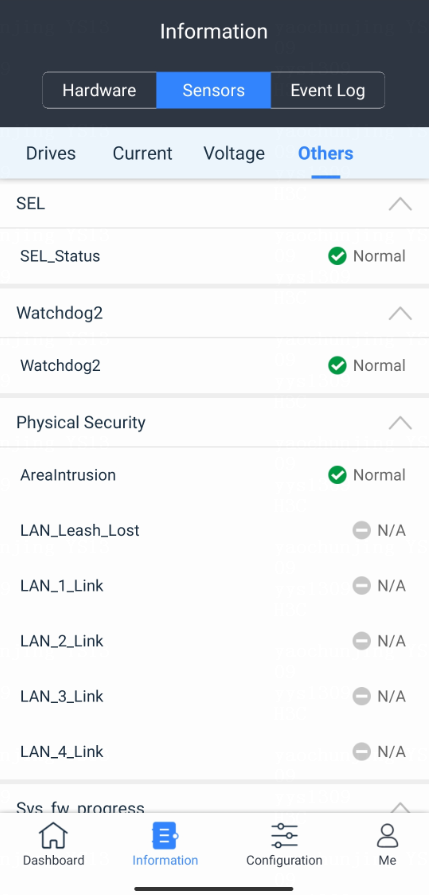
View other sensor information
SEL
Perform this task to view the operation status for the SEL (System Event Log) sensor.
Procedure
1. Open HDM Mobile and access the Devices page.
2. Click the target server to access the Dashboard page for the server.
3. Click the Information > Sensors menu.
4. Click the Others tab.
Figure 38 SEL sensor information

Parameters
Status: Options include:
· Normal:
¡ The SEL sensor is working correctly.
¡ Log area reset/cleared: Event logs are cleared.
· Minor:
¡ The SEL section is full: The number of event logs has exceeded the upper limit.
¡ The SEL section being full: The number of event logs has exceeded 75% of the total logs.
Watchdog2
Use Watchdog2 sensor to monitor the operation system status for the server. When Watchdog2 sensor detects that the operating system crashes, it restarts the operating system automatically.
Procedure
1. Open HDM Mobile and access the Devices page.
2. Click the target server to access the Dashboard page for the server.
3. Click the Information > Sensors menu.
4. Click the Others tab.
Figure 39 Watchdog2 sensor information
Parameters
Status: Options include:
· Normal—Indicates that the operating system for the serve is working correctly.
· Minor—Indicates that the timer is overdue or is interrupted.
· Major—Indicates timeouts for immediate reset, power-on, and power cycle.
Physical Security
Use Physical Security sensor to monitor the chassis-open state and the operation states for shared ports. The system generates an event log upon chassis opening, and does not generate an event log when the chassis is closed.
Procedure
1. Open HDM Mobile and access the Devices page.
2. Click the target server to access the Dashboard page for the server.
3. Click the Information > Sensors menu.
4. Click the Others tab.
Figure 40 Physical Security sensor information

Parameters
· Name: Options include:
¡ AreaIntrusion: Monitors whether the server chassis is opened.
¡ Lan_number_Link: Monitors the operation state for a shared port.
¡ Lan_Leash_Lost: Monitors the operation states for all shared ports.
· Status: Options include:
¡ AreaIntrusion:
- Normal—Indicates that the security chassis is closed.
- Minor—Indicates that the security chassis is opened.
- N/A—Indicates chassis-open alarm module is absent.
¡ Lan_number_Link:
- Normal—Indicates that the shared port is enabled.
- N/A—Indicates that the shared port is disabled.
¡ Lan_Leash_Lost:
- Normal—Indicates a minimum of one shares port is enabled.
- N/A—Indicates all shared ports are unavailable.
Sys_fw_progress
Use BIOS_POST_Status sensor to monitor the BIOS initialization progress.
Procedure
1. Open HDM Mobile and access the Devices page.
2. Click the target server to access the Dashboard page for the server.
3. Click the Information > Sensors menu.
4. Click the Others tab.
Figure 41 BIOS_POST_Status sensor information

Parameters
· Name
¡ BIOS_POST_Status: Monitors the BIOS initiation progress.
· Status: Options include:
¡ Normal.
¡ N/A—The server is shut down.
¡ Major—An error has occurred to the BIOS initiation progress.
Module_board
Use Boards sensor to monitor states for system modules.
Restriction and guidelines
· The system modules include the system board, processors, SMC modules, sLOM network adapters, mLOM network adapters, FLOM network adapters, riser cards, Mezzanine modules, PCIe modules, CPU & memory Mezzanine boards, GPU adapters, dual SD card extended modules, and drive backplanes. Types of system modules vary by server model.
· When the system modules are faulty, access the Event Log page for failure details.
Procedure
1. Open HDM Mobile and access the Devices page.
2. Click the target server to access the Dashboard page for the server.
3. Click the Information > Sensors menu.
4. Click the Others tab.
Figure 42 Boards sensor information
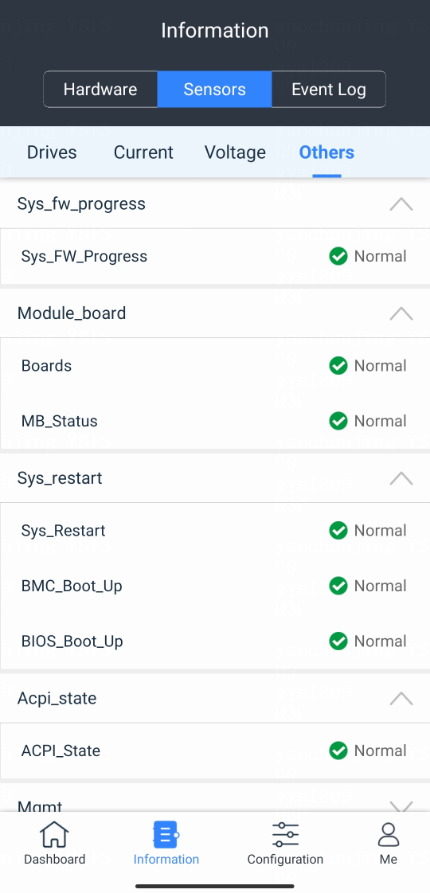
Parameters
· Name:
¡ Boards—Monitors the state of a system module.
· Status:
¡ Normal—The system module is working correctly.
¡ Critical—An error has occurred to the system module.
Mgmt
Use the BMC_Self_Test sensor to monitor the FRU component states for the server. Support for this feature varies by server model.
Procedure
1. Open HDM Mobile and access the Devices page.
2. Click the target server to access the Dashboard page for the server.
3. Click the Information > Sensors menu.
4. Click the Others tab.
Figure 43 BMC_Self_Test sensor information
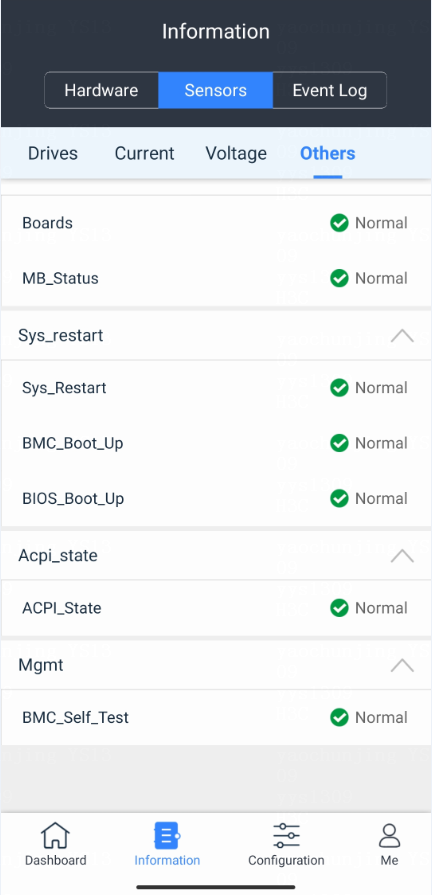
Parameters
Status: Options include:
· Normal—The FRU component is working correctly.
· Major—Unable to obtain the FRU component information or an FRU verification error has occurred.
Configuration
Power control
Perform this task to manage the power status of a server.
Procedure
1. Open HDM Mobile and access the Devices page.
2. Click the target server to access the Dashboard page for the server.
3. Click the Configuration > Power Control menu.
The Power status field represents the power supply state for the server.
4. Select a power action and click Save.
Figure 44 Power supply control

Parameters
|
|
CAUTION: The force power-off, force system reset, and force power-cycle actions might cause corruption or loss of data. When you perform these actions, make sure you fully understand their impact on the services. |
· Force system reset: Warm reboots the server without power cycling the server.
· Force power-off: Shuts down the server immediately by force. This action is equivalent to pressing the power button on the server for five seconds to put the server in standby mode.
· Graceful power-off: Shuts down the operating system first, and then removes power from the server to put it in standby mode.
· Power on: Starts up the server.
· Force power-cycle: Powers off and then powers on the server.
Power supply configuration
Perform this task to view power information and configure power capping.
Procedure
1. Open HDM Mobile and access the Devices page.
2. Click the target server to access the Dashboard page for the server.
3. Click the Configuration > Power Supply Configuration menu.
4. View the total power of installed power supplies.
5. Enable or disable power capping as needed.
6. Configure the power cap value and the action upon a power capping failure as needed.
7. Click Save.
Figure 45 Power supply configuration
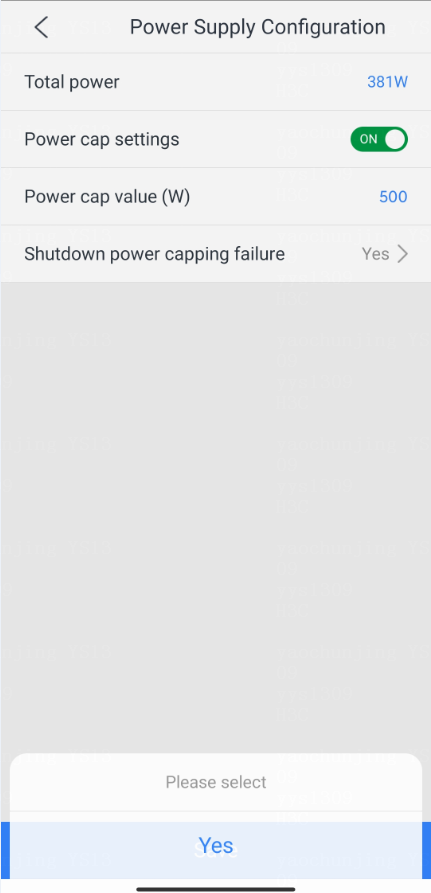
Parameters
· Power cap value (W): With power capping enabled, if the power cap value of the power supplies is exceeded, the server attempts to decrease power consumption by automatically decreasing the operating frequency of system components such as processors.
· Shutdown upon power capping failure: Power capping fails if the power consumption cannot drop below the power cap value in 30 seconds. You can configure the server to shut down or continue to run on a power capping failure.
UID LED control
Perform this task to quickly identify the target server in a server-intensive environment.
Restrictions and guidelines
When the UID LED is in flashing green, you cannot turn on or off the UID LED.
Procedure
1. Open HDM Mobile and access the Devices page.
2. Click the target server to access the Dashboard page for the server.
3. Click the Configuration > UID Light Control menu.
4. Select Turn on or Turn off for the UID LED as needed.
Figure 46 UID LED control
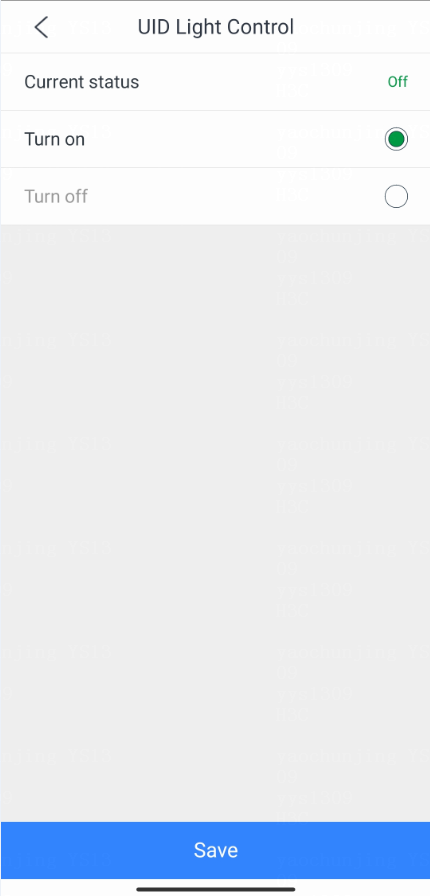
Parameters
Current status: Current status of the UID LED for the server. Options include:
· On—The UID LED is steady blue. The server is selected.
· Flashing—The UID LED is flashing blue. A firmware update is being performed on the server or the remote console is open.
· Off—The UID LED is off. The server is not selected.
Users
View current account information
1. Open HDM Mobile and access the Devices page.
2. Click the target server to access the Dashboard page for the server.
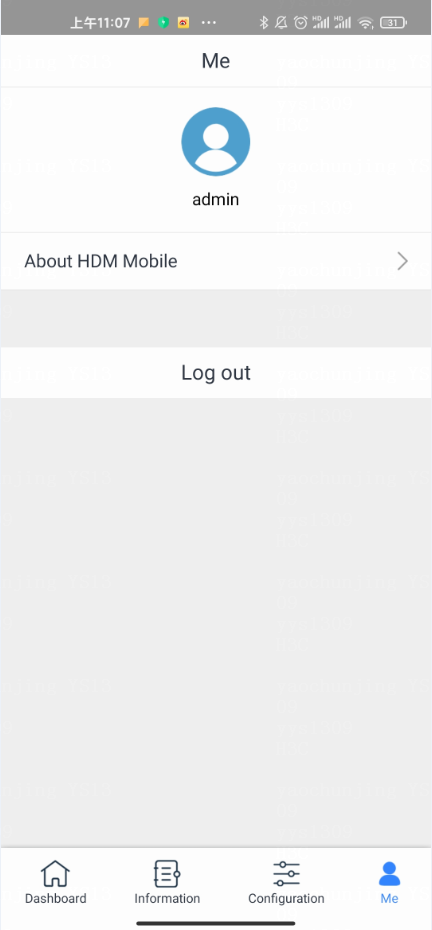
3. Click the Me menu.
4. View the current account information.
Figure 47 Viewing account information

View HDM Mobile information
1. Open HDM Mobile and access the Devices page.
2. Click the target server to access the Dashboard page for the server.
3. Click the Me menu.
4. Click About HDM Mobile to view the HDM Mobile version and user agreement.
Figure 48 Viewing HDM Mobile version and user agreement

Log out a server
1. Open HDM Mobile and access the Devices page.
2. Click the target server to access the Dashboard page for the server.
3. Click the Me menu.
4. Click Log out.
You will be placed back onto the Devices page.
Figure 49 Logging out the server