
- Released At: 15-02-2025
- Page Views:
- Downloads:
- Table of Contents
- Related Documents
-
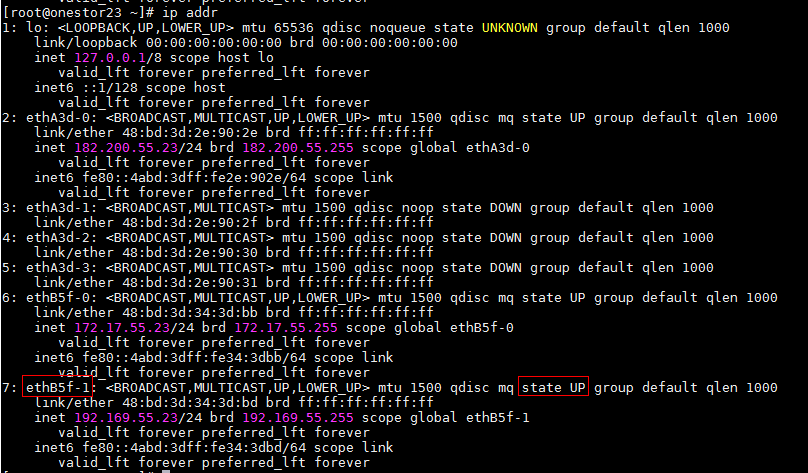
Emergency Response and Recovery Guide
Document version: 5W100-20250213
Copyright © 2025 New H3C Technologies Co., Ltd. All rights reserved.
No part of this manual may be reproduced or transmitted in any form or by any means without prior written consent of New H3C Technologies Co., Ltd.
Except for the trademarks of New H3C Technologies Co., Ltd., any trademarks that may be mentioned in this document are the property of their respective owners.
The information in this document is subject to change without notice.
Contents
About emergency response and recovery
Troubleshooting flowchart and principles
Rapid service recovery principles
Common emergency response and recovery methods
Troubleshooting compute virtualization exceptions
No boot disk can be found when a VM restarts
VM migration cannot be completed for a long period of time.
VM deployment partially succeeded
VM stuck caused by high disk IO latency on the host
Shared storage pool fails to start
Cluster is unavailable due to shared storage blockage
Forcible repair of the shared file system
Fail to start the shared storage pool with a prompt of no available slot in the storage pool
A multipath configuration failure is prompted when adding shared storage on the Web interface
Packet loss or service disruption occurs on hosts or the VM network
VMs cannot access the gateway address after ACL configuration
SSH connection cannot be established due to the vFirewall
Troubleshooting storage service exceptions
Some VMs or storage volumes are suboptimal on UIS
All VMs or storage volumes on UIS are suboptimal, and the cluster is suboptimal
The iSCSI HA VIP is unreachable
Failure to read or write data through the iSCSI HA VIP
The client can ping the HA VIP, but it cannot mount storage volumes
Troubleshooting file storage exceptions
Failure to access a share via a load balancing domain name
When you delete an abnormal NAS node, the system prompts that the specified node cannot be connected
After an authentication method change, the client prompts a lack of access permissions
After the NFS service is unmounted, the TCP connection still exists
Failure to access a CIFS shared directory
When NFS shares are in use, services on some clients might be laggy or interrupted
When an FTP client accesses a shared directory, the directory is not refreshed
Exceptional disconnection of the Windows 10 client
Insufficient rollback quota size upon snapshot rollback
Quota management - Incorrect number of directory files
Troubleshooting network, device, and other issues
Incorrect login to the Web interface
Failure to access the front-end Web interface with a log report of database connection failure
Response failure for viewing VM and storage pool information on the front-end Web interface
Failure of a host to identify the USB device inserted into the CVK host
Failure to enable HA for the cluster upon changing the system time
Packet loss on an aggregate link
System installation getting stuck, or no xconsole interface available after installation
Collecting failure information
Collecting log information from the back end
Collecting log files from the management platform
About emergency response and recovery
This guide is the emergency response and recovery solution for common issues with the H3C UIS HCI platform, aimed at quickly restoring services in emergencies. This guide is intended for field technical support and servicing engineers, as well as network administrators.
Examples in this document might use devices that differ from your device in hardware model, configuration, or software version. It is normal that the port numbers, sample output, and screenshots in the examples differ from what you have on your device. H3C is committed to continuously improving the documentation to better serve our customers, production, and field service. If you encounter any issues during use, please contact technical support and provide feedback.
Troubleshooting flowchart and principles
Troubleshooting flowchart
Use the following flowchart to perform emergency response and recovery.
When a fault that requires emergency recovery occurs, try taking emergency recovery measures to recover services first. No matter whether services can be recovered, you must locate and resolve the issues later.
Figure 1 Troubleshooting flowchart

Troubleshooting principles
Emergency response principles
Significant failures can easily cause widespread VM and network device failure. To enhance the efficiency of handling significant failures and minimize losses, use the following principles of emergency response and recovery before you maintain devices:
· See the emergency response and recovery guide and make plans for significant failures and regularly organize relevant managers and servicing engineers to learn emergency response and recovery techniques and perform testing.
· Locate and resolve issues and collect data based on the principle of fast resuming customer services with minimal impact.
· Servicing engineers must have essential emergency response and recovery training, learn the basic methods for identifying significant faults, and master the fundamental skills for handling them.
· To quickly get technical support from H3C, servicing engineers must contact the H3C customer service center or the local H3C office in time during emergency response.
· After finishing troubleshooting, servicing engineers must collect alarm messages and send the troubleshooting report, alarm files, and log files to H3C for analysis and location.
Rapid service recovery principles
When you recover services, you must consider possibility of a successful recovery and the time consumed. As a best practice, recover services in the following order:
1. Operation that take a short time and have a high chance of success.
2. Operation that take a short time and have a low chance of success.
3. Operation that take a long time and have a high chance of success.
Preparation
Table 1 Preparation
|
Category |
Preparation |
|
Device-level backup |
· Active/standby device requirements: Perform regular data consistency checks and running status inspections to ensure that services can be taken over in emergencies. · Load balancing requirements: Regularly perform load assessments to evaluate the performance of business operations on a single plane, ensuring that another device can take over all services in the event of a single point of failure. |
|
(Optional) Disaster recovery |
Disaster recovery site and related switchover preparation. |
|
Daily alarm cleanup |
Critical devices require a stock of spare parts. |
|
Basic information |
Handle daily alarms promptly to ensure no active alarms remain unacknowledged, preventing confusion and impaired decision-making during troubleshooting. |
|
Engineer requirements |
Servicing engineers must prepare the following basic information: · Network configuration information. · Basic device information. · Software list · Network device IP address information. · Service information. · Spare part information. · Remote maintenance information. · Relevant contact persons. |
Emergency recovery methods
Emergency recovery process
Figure 2 Emergency recovery flowchart

Determine failure types
Observe the failure state and determine the failure types:
· Computing exceptions—Host or VM exceptions, for example, host or VM startup failure, or unsuccessful VM migrations.
· Storage exceptions—Shared storage pool exceptions, for example, disk IO or host storage exceptions, or storage pool configuration failure or unavailability.
· Network exceptions—Host or VM network unavailability, incorrect configuration, or high packet loss rates.
· Failure alarms—Alarm messages that indicate failures.
· Other—Unavailability of the management platform and peripherals, for example, failure to log in to the management platform, upgrade failure, and abnormal system time.
You can determine the failure type based on the following information:
· Error message for the failed task.
· Task execution status on the task console.
· Alarm messages in the management platform.
· Performance monitoring information for VMs or hosts.
Common emergency response and recovery methods
When a failure occurs with a host or VM, try the following methods for service restoration:
· Restart the VM: Try to restart the VM either from the management platform or through SSH.
· Restart the host: See H3C UIS HCI Host Shutdown Configuration Guide to restart the host.
· Restart network devices: Restart the related physical switches, routers, and other network devices, and observe the link status.
· Restart services such as Tomcat 8 from the CLI of the management host. For more information, see the maintenance guide or contact Technical Support.
Troubleshooting compute virtualization exceptions
VM exceptions
VM startup failure
Symptom
The VM fails to start.
Impact
The VM fails to start, causing user service interruption.
Analysis
· If the CPU or memory resources are insufficient, check the CPU and memory usage on the physical server. If the sum of the physical host memory and VM memory exceeds the total memory minus the memory reservation value, subsequent VMs will not be allowed to start.
· After AsInfo Antivirus is uninstalled, residual configuration in the VM configuration file prevents the VM from starting up.
Solution
· If the issue is caused by insufficient resources, manually release CPU or memory resources. If the issue is caused by resource overcommitment, temporarily shutting down VMs not in use or migrate VM to a host with sufficient resources to free up resources.
· If configuration remnant exists in the configuration file, check the VM log:
2017-05-18 11:01:52.617+0000:
29917: error : qemuProcessWaitForMonitor:1852 : internal error process exited
while connecting to monitor: 2017-05-18 11:01:52.414+0000: domain pid 32504,
created by libvirtd pid 2974
char device redirected to /dev/pts/8 (label charserial0)
kvm: -chardev socket,id=charshmem0,path=/tmp/kvmsec: Failed to connect to
socket: No such file or directory
kvm: -chardev socket,id=charshmem0,path=/tmp/kvmsec: chardev: opening backend
"socket" failed
· View the VM configuration, which includes the following:
<shmem
name='nu_fsec-4af99204-6623-45e9-afbf-d852746bf187'>
<size unit='M'>8</size>
<server path='/tmp/kvmsec'/>
<address type='pci' domain='0x0000' bus='0x00' slot='0x09'
function='0x0'/>
</shmem>
To resolve this issue, delete the XML tag and then restart the VM.
The VM fails to start, and the system displays the Could not read snapshots: File too large error message
Symptom
The VM log contains the following information:
error: Failed to start domain centos
error: internal error process exited while connecting to monitor: 2016-08-02
19:52:42.707+0000: domain pid 31971, created by libvirtd pid 3434
char device redirected to /dev/pts/5 (label charserial0)
kvm: -drive file=/vms/share/Centos6.5-tf.5-tf,if=none,id=drive-virtio-disk0,format=qcow2,cache=directsync:
could not open disk image /vms/share/Centos6.5-tf.5-tf: Could not read
snapshots: File too large
Impact
User services will be affected.
Analysis
The snapshot information in the VM image file was corrupted.
Solution
1. Execute the qcow2.py dump-header, qcow2.py set-header nb_snapshots 0, and qcow2.py set-header snapshot_offset 0x0 commands to change the snapshot information in the qcow2 file to 0:
root@mi-service:~# qcow2.py /vms/share/Centos6.5-tf.5-tf
dump-header
magic 0x514649fb
version 3
backing_file_offset 0x0
backing_file_size 0x0
cluster_bits 21
size 26843545600
crypt_method 0
l1_size 1
l1_table_offset 0x600000
refcount_table_offset 0x200000
refcount_table_clusters 1
nb_snapshots 4
snapshot_offset 0x130600000
incompatible_features 0x0
compatible_features 0x0
autoclear_features 0x0
refcount_order 4
header_length 104
root@mi-service:~# qcow2.py /vms/share/Centos6.5-tf.5-tf set-header
nb_snapshots 0
root@mi-service:~# qcow2.py /vms/share/Centos6.5-tf.5-tf set-header
snapshot_offset 0x0
root@mi-service:~# qcow2.py /vms/share/Centos6.5-tf.5-tf dump-header
magic 0x514649fb
version 3
backing_file_offset 0x0
backing_file_size 0x0
cluster_bits 21
size 26843545600
crypt_method 0
l1_size 1
l1_table_offset 0x600000
refcount_table_offset 0x200000
refcount_table_clusters 1
nb_snapshots 0
snapshot_offset 0x0
incompatible_features 0x0
compatible_features 0x0
autoclear_features 0x0
refcount_order 4
header_length 104
2. Restart the VM.
No boot disk can be found when a VM restarts
Symptom
No boot disk can be found when a VM restarts.
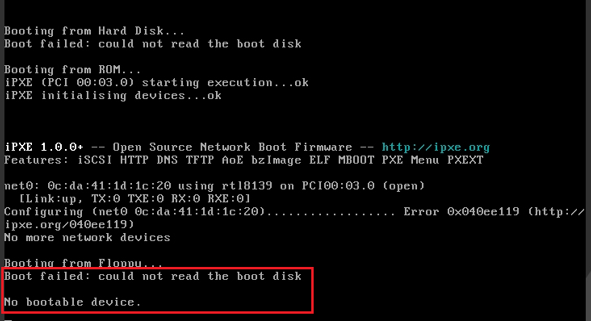
Impact
User services will be affected.
Analysis
The VM log contains the following information:
qcow2: Preventing invalid write on metadata (overlaps with snapshot table); image marked as corrupt.
Use the qemu-img check XXX command (where XXX represents the disk image) to check the VM disk image for errors.
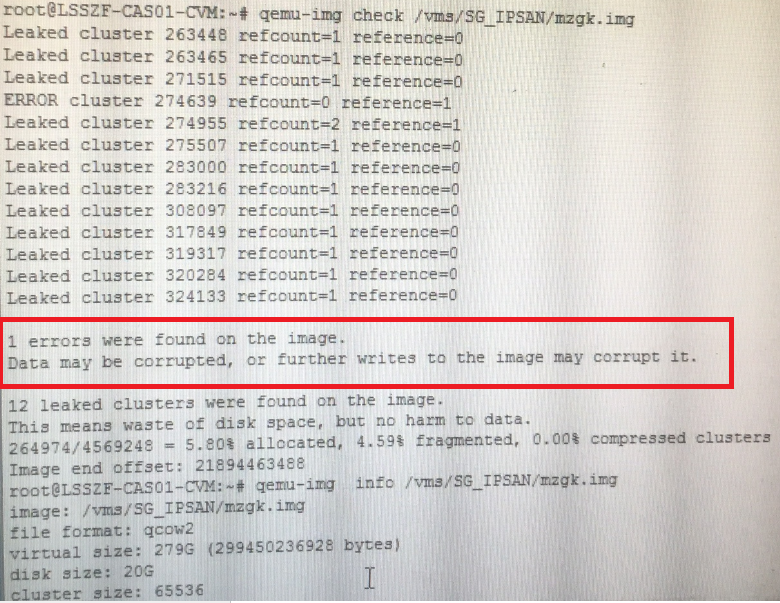
Solution
Execute the qemu-img check -r all xxx command (where xxx represents the disk image) to restore the image file. Once the restoration is successful, the VM can start.
Before you resolve the issue, back up the image file in case you encounter this issue again in the future.
VM migration cannot be completed for a long period of time.
Symptom
· The VM migration progress is stuck at 99% and cannot be completed for a long period of time.
· On the VM details page, the migration speed keeps at 0 for more than 15 minutes.
Impact
User services might be affected.
Analysis
· Disk migration takes a long time, because the disk file is large and the management network bandwidth is GE.
· Many dirty data is generated and memory migration cannot complete.
· A storage failure has caused the VM to freeze.
· The migration network is disconnected.
Solution
· Check the destination disk file size and wait for the disk migration to complete.
· Pause the services running in the VM or continue after the workload decreases.
· If you verify that the migration cannot be completed (already affecting services) or you do not want to wait for the migration to complete, you can restart the Tomcat process in the CVM back end by using the service tomcat8 restart command. Before restarting the process, make sure no other processes except for the VM migration process that needs to be stopped are running in the front end.
· As a best practice, shut down the VM and restart it, or shut down the VM and use offline migration if the migration task stops and the VM state has not been restored after you restart the Tomcat service.
|
|
CAUTION: Restarting the Tomcat service will disrupt all running tasks displayed in the Web interface. |
VM deployment partially succeeded
Symptom
The deployment result shows that the deployment partially succeeded with an error code of 7501.
Impact
The VM cannot run correctly.
Analysis
Error code 7501 typically results from the failure to run castools.py. Check the failure reason in the log /var/log/castools.log.
Common reasons include:
· The VM disk is damaged. libguestfs will check for disk partition information. If the disk is damaged, it cannot be mounted.
· CAStools is not installed on the VM correctly, and the qemu-ga service in the VM is abnormal.
Solution
· Execute the qemu-img check -r all xxx command (where xxx represents the disk image) to restore the image file.
· Reinstall CAStools.
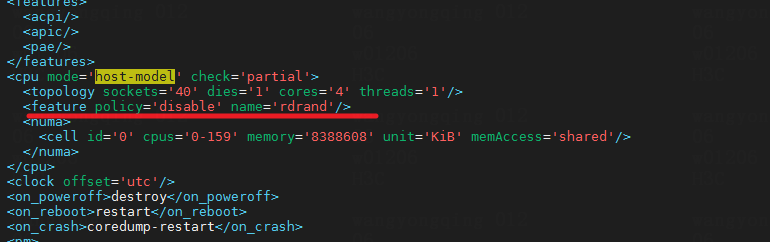
Soft lockup error displayed when a Centos 6.5/6.8 VM on a host that uses Hygon C86 7280 32-core CPUs starts
Symptom
When a Centos 6.5/6.8 VM on a host that uses Hygon C86 7280 32-core CPUs starts, a soft lockup error is displayed.
Impact
The VM fails to start.
Analysis
The get_random_bytes() function uses CPU instruction rdrand to obtain random numbers. When a VM is running in host matching mode or passthrough mode, there might be issues with the rdrand flag. This is primarily due to the instability of the rdrand instruction on AMD CPUs. In addition, the CentOS 6.8 kernel version used by the VM is outdated (version 2.6.32), and the Linux community has discontinued use of the rdrand feature in this kernel version.
PID: 1208 TASK: ffff8802374ff540 CPU: 0 COMMAND: "modprobe"
[exception RIP: get_random_bytes+41]
RIP: ffffffff81331419 RSP: ffff880236b6fcf8 RFLAGS: 00000203
RAX: ffffffffffffffff RBX: ffff880237f79cf0 RCX: 000000000000000a
RDX: 00000000000000ff RSI: 0000000000000008 RDI: ffff880237f79cf0
RBP: ffff880236b6fd38 R8: 0000000000000000 R9: 0000000000000180
R10: 0000000000000000 R11: 0000000000000000 R12: 0000000000000008
R13: ffff880237f79ce4 R14: ffff880237f79df0 R15: 0000000000000001
CS: 0010 SS: 0018
#0 [ffff880236b6fd40] __ipv6_regen_rndid at ffffffffa01559ed [ipv6]
#1 [ffff880236b6fd60] ipv6_regen_rndid at ffffffffa0157240 [ipv6]
#2 [ffff880236b6fd80] ipv6_add_dev at ffffffffa015753e [ipv6]
#3 [ffff880236b6fdb0] addrconf_notify at ffffffffa015a8e9 [ipv6]
#4 [ffff880236b6fe90] register_netdevice_notifier at ffffffff8145d9bf
#5 [ffff880236b6fee0] addrconf_init at ffffffffa019e3be [ipv6]
#6 [ffff880236b6ff00] init_module at ffffffffa019e198 [ipv6]
#7 [ffff880236b6ff20] do_one_initcall at ffffffff8100204c
#8 [ffff880236b6ff50] sys_init_module at ffffffff810bc291
#9 [ffff880236b6ff80] system_call_fastpath at ffffffff8100b072
RIP: 00007efef7b33eda RSP: 00007ffeffffb808 RFLAGS: 00010287
RAX: 00000000000000af RBX: ffffffff8100b072 RCX: 0000000000000030
RDX: 000000000261e6e0 RSI: 000000000008ad20 RDI: 00007efef7e12010
RBP: 00007ffeffffbb00 R8: 00007efef7e9cd30 R9: 00007efef7ff7700
R10: 00007ffeffffb770 R11: 0000000000000206 R12: 000000000261e6e0
R13: 0000000002625250 R14: 000000000261d550 R15: 000000000261e6e0
ORIG_RAX: 00000000000000af CS: 0033 SS: 002b
Solution
To resolve this issue, edit the CPU section in the VM's XML document to disable the rdrand feature.
VM tasks are stuck
Symptom
VM tasks are stuck, and the VM icon on the management platform changes to blue. You cannot edit the VM, access the VNC console, or ping the VM network.
Impact
User services will be affected.
Analysis
· The anomaly in the storage pool where the VM's disk is located prevents the disk from performing read and write operations, causing the main qemu process to continuously wait for a return from the kernel.
· The VM has anti-virus enabled, but an anomaly in the anti-virus module's back-end driver (software installed by the anti-virus vendor on the CVK host) has caused the qemu process to wait for a return from the kernel.
· In a cloud desktop environment, the spice component is typically used. This component requires cooperation with the VM QEMU process. If an anomaly occurs in the component, this issue will occur.
· Migrating VM storage online will rate limit the VM disks, resulting in slower operation of the VM. This is a normal.
· VM disks are typically several TBs in size, and some services within the VM can easily generate disk fragments. When the fragmentation rate reaches 50%, taking a snapshot can cause the VM to be stuck. This issue is a defect inherent to the qcow2 disk format.
· Other devices on the VM, such as a USB device have anomalies.
Solution
This symptom is normal if the VM storage is being migrated or VM snapshots are being deleted, especially when the disk data size reaches terabyte.
To resolve the issue:
1. Check the VM's runtime configuration for any not commonly used settings, such as antivirus, ukey, USB flash drives, external hard drives, and any passthrough devices. You can review the VM's qemu logs at /var/log/libvirt/qemu/vm-name.log to see what error messages are present around the time of the issue, which can help determine which device has exceptions.
2. Execute the ps aux | grep VM name command to identify whether it is in D or Z state.
3. Execute the top -c -H -p VM QEMU process PID command to identify whether the CPU and memory usages of the process are abnormal. Use the cat /proc/VM qemu process pid/stack command to view the process stack.
Shared storage exceptions
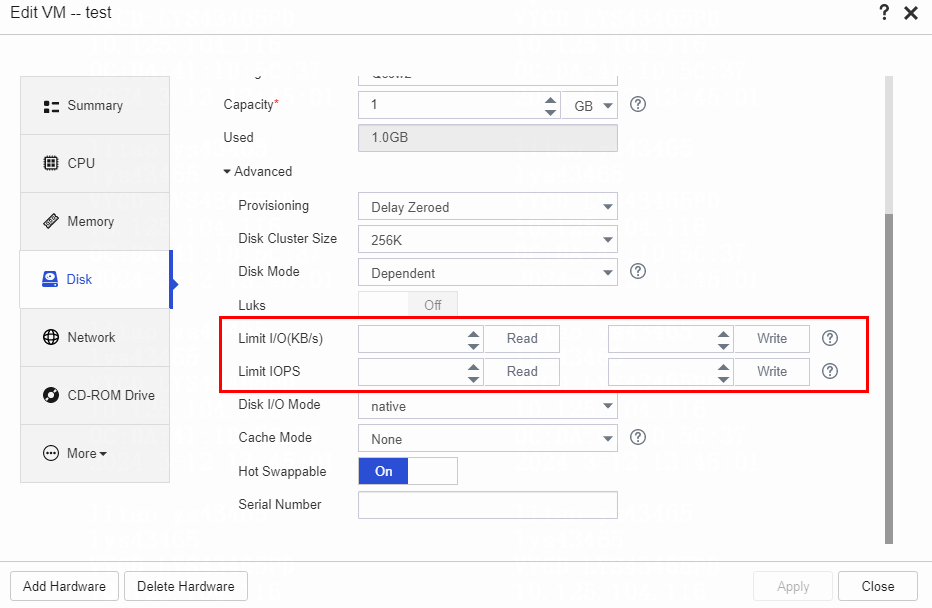
VM stuck caused by high disk IO latency on the host
Symptom
A VM is stuck and performance monitoring statistics on the management platform display a high disk IO latency. In addition, when the VM is pinged, network jitter or even packet loss occurs.
Impact
User services will be affected.
Analysis
The storage pool has high IO throughput and increased IOPS.
Solution
1. To resolve this issue, migrate the VMs to another storage pool and limit I/Os if required.
2. On the top navigation bar, click VMs. If multiple clusters exist in the system, you must also select a cluster from the left navigation pane.
3. Select a VM, click More in the VM card, and then select Edit. Alternatively, select the VM in the navigation pane, and then click Edit on the Summary tab.
4. On the Disk panel, set the I/O read and write rate limits and the IOPS read and write limits as needed.
Shared storage pool fails to start
Symptom
Failed to start the shared storage pool. The system generates the corresponding error messages.
Impact
Users cannot start the shared storage pool, preventing normal business operations.
Analysis
The issue might be caused by the configuration of the on-site network or storage. Troubleshoot the issue in terms of the network and storage.
Solution
To troubleshoot the issue, perform the following tasks:
· Identify whether storage configuration has changed, causing the host unable to access to the corresponding LUN.
· Identify whether the server-to-storage link is accessible through the CLI to inspect FC and IP SAN.
· Analyze log files /var/log/ocfs2_shell_201511.log, /var/log/libvirt/libvirtd.log, and /var/log/syslog to identify mistakes and attempt to determine the causes.
· Identify whether configuration files /etc/default/o2cb and /etc/ocfs2/cluster.conf are consistent across nodes in the shared file system.
· Identify whether multipath configuration is correct. Execute the multipath -ll command to identify whether the LUN has correctly established multiple paths and whether a path exists with the WWID (NAA) /dev/disk/by-id/dm-name-36000eb34fe49de760000000000004064 in the directory.
· If conditions permit, execute the fdisk -l command to identify whether the disks are available.
· If conditions permit, restart the relevant servers to resolve this issue.
If the issue persists, collect the log files and contact the technical support.
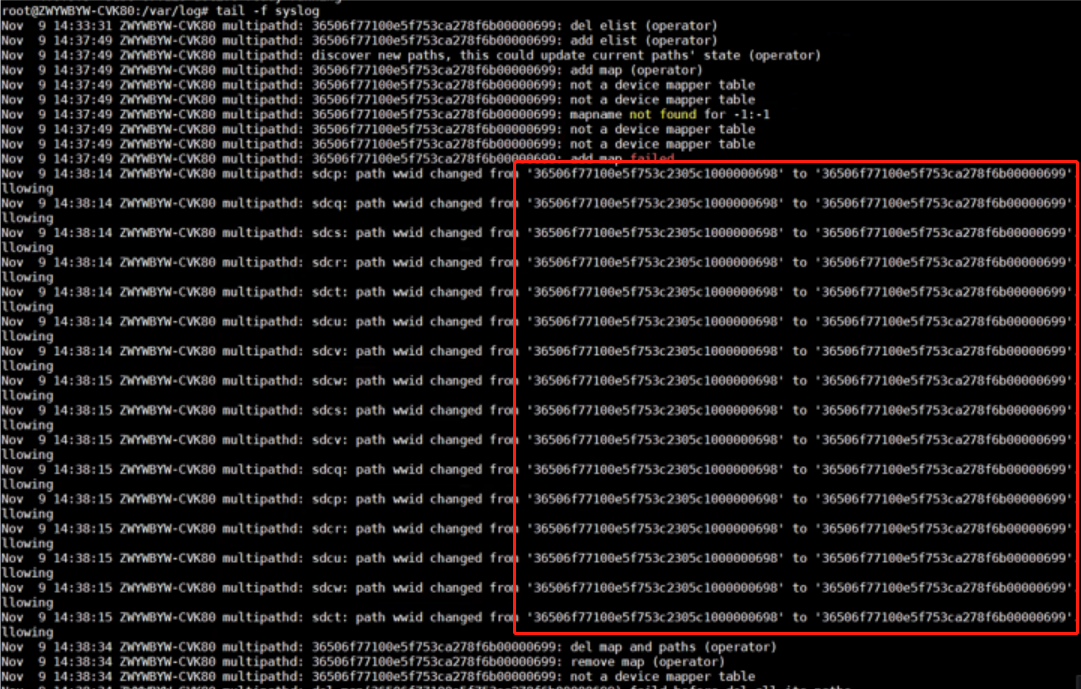
Cluster is unavailable due to shared storage blockage
Symptom
In the management platform, click the storage pool tab on the host details page. The page is not displayed correctly.
Impact
User services are significantly affected.
Analysis
Many potential faults exist and need to be checked one by one.
Solution
Find the root node blocking the shared file system and restart the corresponding host to resolve the issue.
1. Execute the df –h command to check each mount point associated with the storage pool and verify accessibility. If no response is returned for the command for a long time, it indicates a blockage in the shared file system.
2. Execute the mount | grep ocfs2 command to check the shared file system in use.
root@B12-R390-FC-06:~# mount |grep ocfs2
ocfs2_dlmfs on /dlm type ocfs2_dlmfs (rw)
/dev/sdj on /vms/IPsan-St-002 type ocfs2 (rw,_netdev,heartbeat=local)
/dev/sdm on /vms/VM_BackUp type ocfs2 (rw,_netdev,heartbeat=local)
/dev/dm-0 on /vms/FC-St type ocfs2 (rw,_netdev,heartbeat=local)
/dev/sdk on /vms/IPsan-St-001 type ocfs2 (rw,_netdev,heartbeat=local)
/dev/sdl on /vms/ISO_POOL type ocfs2 (rw,_netdev,heartbeat=local)
3. Execute the debugfs.ocfs2 -R “fs_locks -B” command to identify whether any lock is blocked for each disk.
a. If the output is as follows, it indicates that disks sdb and sde are not blocked, whereas disk sdc has blocked locks. Three dlm locks on disk sdc are in blocked state.
root@ZJ-WZDX-313-B11-R390-IP-07:~# mount |grep ocfs2
ocfs2_dlmfs on /dlm type ocfs2_dlmfs (rw)
/dev/sdb on /vms/IPsan-St-002 type ocfs2 (rw,_netdev,heartbeat=local)
/dev/sde on /vms/VM_BackUp type ocfs2 (rw,_netdev,heartbeat=local)
/dev/sdc on /vms/IPsan-St-001 type ocfs2 (rw,_netdev,heartbeat=local)
/dev/sdd on /vms/ISO_POOL type ocfs2 (rw,_netdev,heartbeat=local)
root@ZJ-WZDX-313-B11-R390-IP-07:~# debugfs.ocfs2 -R "fs_locks -B" /dev/sdb
root@ZJ-WZDX-313-B11-R390-IP-07:~# debugfs.ocfs2 -R "fs_locks -B" /dev/sde
root@ZJ-WZDX-313-B11-R390-IP-07:~# debugfs.ocfs2 -R "fs_locks -B" /dev/sdc
Lockres: P000000000000000000000000000000 Mode: No Lock
Flags: Initialized Attached Busy Needs Refresh
RO Holders: 0 EX Holders: 0
Pending Action: Convert Pending Unlock Action: None
Requested Mode: Exclusive Blocking Mode: No Lock
PR > Gets: 0 Fails: 0 Waits (usec) Total: 0 Max: 0
EX > Gets: 13805 Fails: 0 Waits (usec) Total: 8934764 Max: 5
Disk Refreshes: 0
Lockres: M000000000000000000020737820a41 Mode: No Lock
Flags: Initialized Attached Busy
RO Holders: 0 EX Holders: 0
Pending Action: Convert Pending Unlock Action: None
Requested Mode: Protected Read Blocking Mode: No Lock
PR > Gets: 2192274 Fails: 0 Waits (usec) Total: 15332879 Max: 1784
EX > Gets: 2 Fails: 0 Waits (usec) Total: 5714 Max: 3
Disk Refreshes: 1
Lockres: M000000000000000000020137820a41 Mode: No Lock
Flags: Initialized Attached Busy
RO Holders: 0 EX Holders: 0
Pending Action: Convert Pending Unlock Action: None
Requested Mode: Protected Read Blocking Mode: No Lock
PR > Gets: 851468 Fails: 0 Waits (usec) Total: 409746 Max: 8
EX > Gets: 3 Fails: 0 Waits (usec) Total: 6676 Max: 3
Disk Refreshes: 0
b. Query the usage information of the blocked dlm locks on the owner node. If you find the owner of the dlm lock is node 5, locate node 5 in file /etc/ocfs2/cluster.conf. SSH into that node and execute the dlm query command again to review the usage on each node.
root@ZJ-WZDX-313-B11-R390-IP-07:~# debugfs.ocfs2 -R "dlm_locks P000000000000000000000000000000" /dev/sdc
Lockres: P000000000000000000000000000000 Owner: 5 State: 0x0
Last Used: 0 ASTs Reserved: 0 Inflight: 0 Migration Pending: No
Refs: 3 Locks: 1 On Lists: None
Reference Map:
Lock-Queue Node Level Conv Cookie Refs AST BAST Pending-Action
Converting 10 NL EX 10:1260
c. The output shows that node 7 continuously holds the lock without releasing it, causing blockage for other nodes.
root@ZJ-WZDX-313-B12-R390-FC-05:~# debugfs.ocfs2 -R "dlm_locks P000000000000000000000000000000" /dev/sdk
Lockres: P000000000000000000000000000000 Owner: 5 State: 0x0
Last Used: 0 ASTs Reserved: 0 Inflight: 0 Migration Pending: No
Refs: 12 Locks: 10 On Lists: None
Reference Map: 1 2 3 4 6 7 8 9 10
Lock-Queue Node Level Conv Cookie Refs AST BAST Pending-Action
Granted 7 EX -1 7:1446 2 No No None
Converting 4 NL EX 4:1443 2 No No None
Converting 2 NL EX 2:1438 2 No No None
Converting 8 NL EX 8:1442 2 No No None
Converting 6 NL EX 6:1441 2 No No None
Converting 3 NL EX 3:1438 2 No No None
Converting 1 NL EX 1:1442 2 No No None
Converting 10 NL EX 10:1260 2 No No None
Converting 5 NL EX 5:1442 2 No No None
Converting 9 NL EX 9:1259 2 No No None
d. On the blocked node, such as node 7 in this example, you can also execute the following command to view the corresponding blocking process:
ps -e -o pid,stat,comm,wchan=WIDE-WCHAN-COLUMN | grep D
PID STAT COMMAND WIDE-WCHAN-COLUMN
22299 S< o2hb-C12DDF3DE7 msleep_interruptible
27904 D+ dd ocfs2_cluster_lock.isra.30
e. To resolve storage blockage, perform the following tasks to restart the corresponding server:
On the blocked node, execute the ps -ef |grep kvm command to view all VMs running on that host.
Query all VM processes at the CLI and records information such as each VM's VNC port.
As a best practice, use VNC or the VM's remote desktop to shut down the VM from inside. If some VMs cannot be shut down, execute the kill -9 pid command to forcibly terminate the VM process.
Use the reboot command to restart faulty hosts. In case the reboot command fails, log in to the host's management interface via the iLo port, select secure server reboot or reset to restart.
After the server starts, identify whether the system operates correctly.
Forcible repair of the shared file system
Symptom
When a server accidentally loses power or has other anomalies, the shared file system data stored on the disks might become inconsistent. This issue can lead to anomalies in subsequent use of the shared file system. Disk operations, especially using dd and fio commands, can cause disk damage requiring repair. Without repair, data loss and server suspension might occur during operation, resulting in service interruptions.
Impact
User services might be interrupted and data loss might occur.
Analysis
This issue is caused by a server anomaly such as a sudden loss of power.
Solution
1. Pause the corresponding shared file system on all hosts.
2. Taking one host as an example, perform a pre-check. For example, for disk dm-0, execute the fsck.ocfs2 -fn /dev/dm-0 command and save the output.
3. Execute the repair command (for example, fsck.ocfs2 -fpy /dev/dm-0) to perform the repair.
4. After the repair, activate the storage pool on all hosts.
5. Start the corresponding VM services on all hosts.
|
|
CAUTION: · As a best practice to perform a repair, contact technical support for remote processing first. · Save the output during the process and collect logs for the technical support to analyze. · If the damage is severe, the shared file system might still be unusable after repair. Contact the technical support for help. |
Fail to start the shared storage pool with a prompt of no available slot in the storage pool
Symptom
When you start the shared storage pool in the management platform, the system prompts that the storage pool has no available slot.
Impact
The storage pool cannot start, affecting the deployment of user services.
Analysis
Check logs at the back-end and identify whether an error as follows is reported:
Error: Disk /dev/disk/by-id/dm-name-2225d000155a30dda had been mounted by other hosts, not need to format it
If such an error is reported, it indicates that the storage volume has already been mounted for a host in another cluster. The system detects that and stops the mounting process.
Solution
Unmount the storage volume from another platform.
A multipath configuration failure is prompted when adding shared storage on the Web interface
Symptom
When you add a storage pool on the Web interface, the system prompts that multipath configuration failed and that please check or contact the administrator (Error code: 5106).
Impact
New storage pools cannot be added, affecting the deployment of user services.
Analysis
Check the system logs to identify whether the shared storage volume WWID recognized by UIS is consistent with the WWID set on the storage side. If they are inconsistent, it indicates that the volume is edited on the storage side after being mapped to UIS. As shown in the following figure, the WWID recognized by UIS ends with 698 while that on the storage side ends with 699.
Solution
Perform a forcible scan for storage on each host to re-recognize the configuration on the storage side.
Network exceptions
Packet loss or service disruption occurs on hosts or the VM network
Symptom
A host or VM has network issues, such as packet loss or network service disruption.
Impact
Users’ accesses to the service network are affected.
Analysis
The network configuration is incorrect, or failures occur on the network lines.
Solution
· Identify whether the vSwitch aggregation operates correctly.
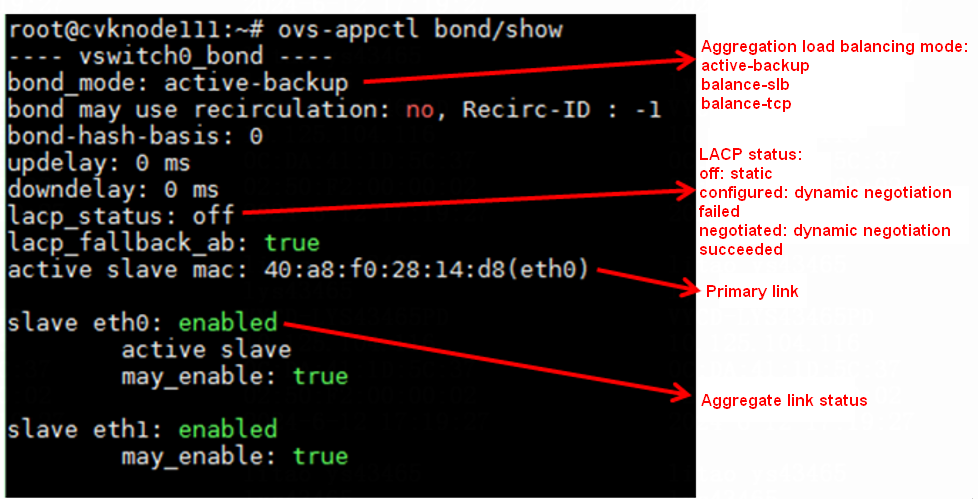
As shown in the figure above, execute the ovs-appctl bond/show command to view the aggregation configuration of the vSwitch.
¡ If the vSwitch uses static active-backup aggregation, the physical switch does not require any aggregation group.
¡ If the vSwitch uses static load balancing aggregation, you must also configure a static aggregation group on the physical switch. If the aggregation configuration on the switch is inconsistent with that on the server, network forwarding failures occur.
¡ If the vSwitch uses dynamic aggregation, check the lacp_status field. If the field displays configured, it indicates that dynamic aggregation negotiation has failed. In this case, check the configuration of the physical switch's aggregation group, including the type of aggregation group, the correctness of the aggregation group's port members, and whether the ports are in select state.
· Identify whether the physical NIC state of the vSwitch is correct. After identifying the physical NIC used by the vSwitch from the interface, execute the ifconfig ethx command to view the state of the NIC. For example:
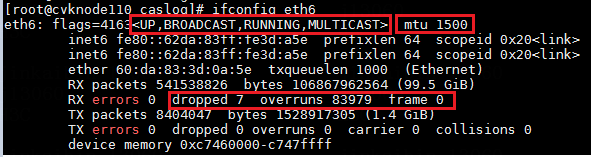
In the output:
¡ <UP, BROADCAST, RUNNING, MULTICAST>—The NIC is in up state and can send and receive packages correctly.
¡ <UP,BROADCAST,MULTICAST>—The NIC is in up state at the software level but in down state at the link layer. In this case, execute the ip link show dev ethx command. If the NIC state displays NO-CARRIER, it indicates that the physical link of the NIC is down. Check the network cable connections. If it is a fiber optic card, replace the fiber optic cable or the transceiver.
![]()
¡ <BROADCAST,MULTICAST>—The NIC is in down state at the software level. Execute the ifup ethx or ip link set dev ethx up command to bring up the NIC at the software level.
· Identify whether the MTU of the NIC is correct. If the MTU configuration is incorrect, edit it on the vSwitch interface.
· Identify whether the NIC drops or misdirects packets. If yes, execute the ifconfig ethx, sleep 10, and ifconfig ethx commands to identify whether the number of dropped packets or that of error packets increases. If no, ignore the issue. If yes, perform further tasks to troubleshoot the issue.
¡ dropped—The package has entered the ring buffer but has been discarded due to insufficient memory or other system reasons when being copied to memory. Use the ethtool -G ethx rx xxx command to increase the NIC's ring buffer size. Note: Changing the NIC's ring buffer might temporarily disrupt the NIC. As a best practice, change it when no service is running.
¡ overruns—The ring buffer is full, causing the physical NIC to discard packets before they reach the ring buffer, usually due to the CPU's inability to timely process NIC interrupts. To resolve this issue, edit the interrupt affinity of the NIC to process interrupts on an idle CPU.
¡ frame—Number of received packets with CRC errors and being non-integer bytes long. As a best practice, replace the network cables or fiber optic cables and transceivers.
¡ errors—Total number of all received error packets, including ring buffer overflow, too-long-frames error s, CRC errors, and overruns.
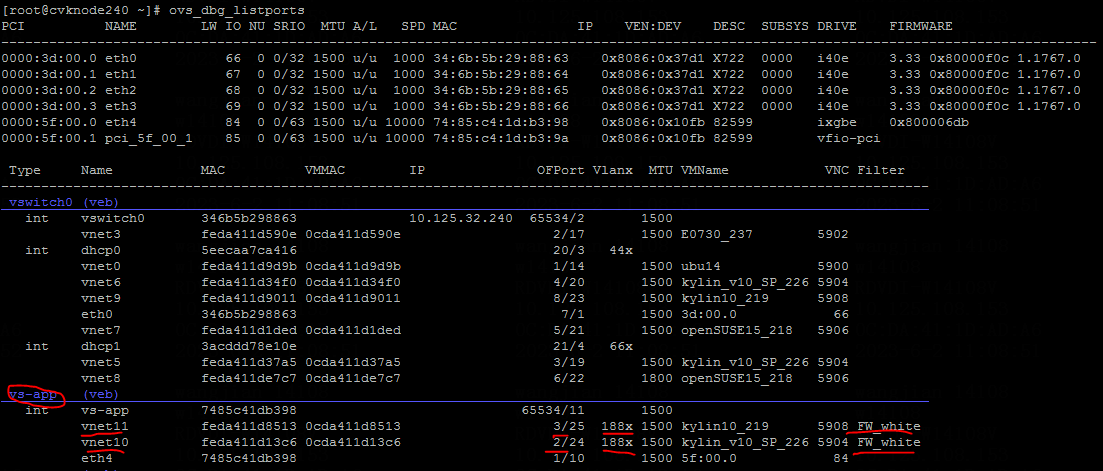
· Identify whether vNIC network configuration is correct. Execute the /opt/bin/ovs_dbg_listports command at the CLI on the CVK host to view the current network topology information, which is of significant importance for troubleshooting.
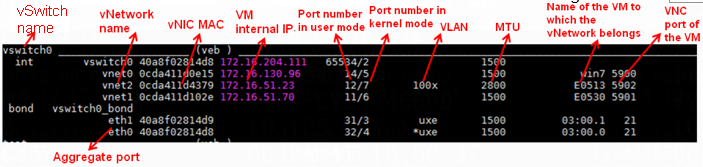
¡ Identify whether the VLAN configuration is correct. In the UIS virtualization network topology, locate the corresponding vnetx device using the VM's MAC address (obtainable through the management platform interface). Then, check the vNIC's VLAN configuration to ensure it meets the current network's service requirements.
¡ Identify whether the IP/MAC binding is correct. On the Edit VM page of the management platform, enter the vNIC IP address to identify whether IP/MAC binding is configured for the vNIC.
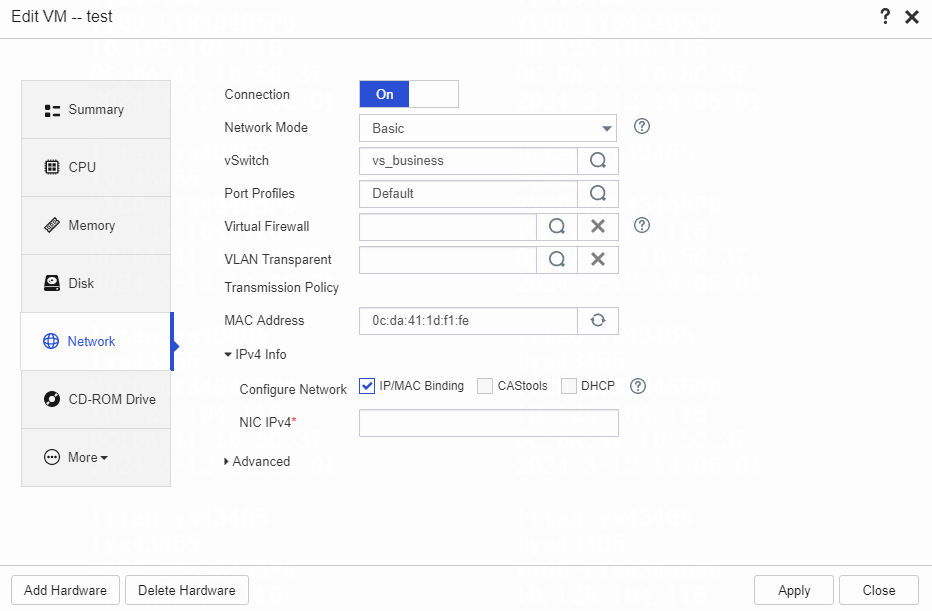
Once a vNIC binds to an IP address, it can only transmit data packets using the bound IP. If it transmits data packets through another IP, the OVS flow table will intercept them.
As a best practice in scenarios where a VM has multiple IPs, remove the IP/MAC binding configuration. Also, verify that the bound IP address is consistent with the internal IP of the VM.
· Identify whether the ACL/vFirewall configuration is correct. Incorrect ACL/vFirewall configuration might cause the OVS flow table to intercept packets transmitted by VMs. Especially in Cloud OS scenarios, verify that the IP addresses that cannot communicate with the VM are allowed by the security groups, because Cloud OS uses the allowlist mechanism by default.
· Identify whether antivirus is enabled for the VM. An anomaly in antivirus scenarios might result in the interception of VM packets by the antivirus module, causing network disruption. The antivirus module might also limit VM traffic, leading to bandwidth throttling issues.
To resolve this issue, disable the antivirus feature. Execute the service ds_am stop, service ds_agent stop, and service ds_filter stop commands to disable AsiaInfo antivirus.
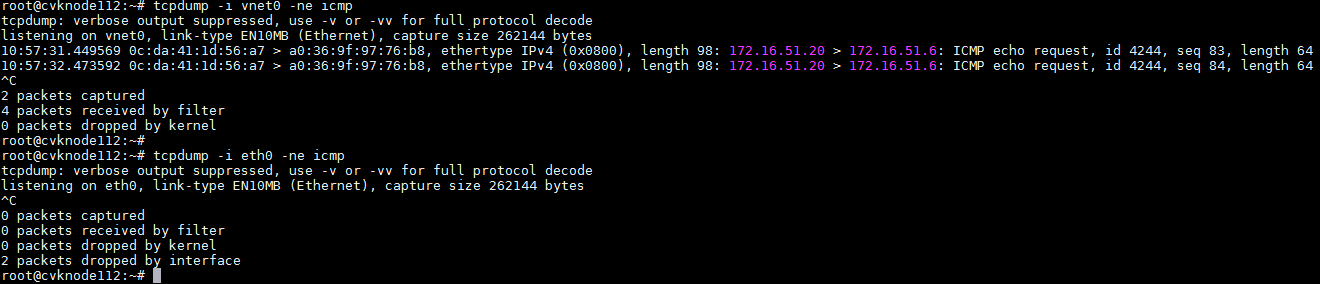
· If the issue persists after the above troubleshooting steps, capture packets to locate the packet loss issue.
The check_network script is a general packet capture script for UIS. To use it, follow these restrictions and guidelines:
check_network.sh
[--vswitch=xxx]//Specify the vSwitch for packet capture. By default, the script automatically captures packets from the vSwitch and its bound physical ports.
[--iface="vnet0,vnet1,vnet2,..."]//Specify the vnet device for packet capture.
[--iface_mac="0c:da:41:1d:f6:4b,0c:da:41:1d:1d:7d,..."]//Specify the VM NIC for packet capture by its MAC address.
[--ping=x.x.x.x]//Initiate a ping task on the device executing the script. You can specify only one IP address in the ping command.
[xxxxxxxxxxx]//Specify the packet capture filters to prevent the PCAP file from taking up too much space. Supported conditions are as shown in the following example. All the parameters mentioned above are optional. You can configure the parameters as needed.
Dump example:
ARP: arp and host x.x.x.x
ICMP: icmp and host x.x.x.x
ICMP6: icmp6 and host x:x::x:x
DNS: port domain
DHCP: udp and port 67 and port 68
SSH: port 22 and host x.x.x.x
LLDP: ether proto 0x88cc
LACP: ether proto 0x8809
Examples of how to use a script:
¡ Issue 1: Intermittent fault alarms on vswitch0. Perform the following tasks to capture packets:
- Execute the /home/test/check_network.sh --vswitch=vswitch0 --ping=172.23.51.112 "icmp and host 172.23.51.112” command on the problematic CVK host.
--vswitch=vswitch0: Specifies vSwitch vswitch0 to capture packets.
--ping=172.23.51.112: Enables the script to automatically initiate a ping task targeting 172.23.51.112. In practice, specify the IP address of the CVM host.
"icmp and host 172.23.51.112”: Specifies packet capture filters. In practice, specify the IP address of the CVM host.
- Execute the /home/test/check_network.sh --vswitch=vswitch0 "icmp and host 172.23.51.114” command on the CVM host.
No need for the --ping parameter, because a ping task has already been initiated on the CVK host.
--vswitch= vswitch0: Same as above.
"icmp and host 172.23.51.112": Specifies packet capture filters. In practice, specify the IP address of the CVK host.
¡ Issue 2: The VM experiences a significant surge in I/O in the early morning hours. Capture packets to identify which main services are running on the VM during the I/O surge.
- Execute the /home/check_network/check_network.sh --iface_mac="0c:da:41:1d:f6:4b,0c:da:41:1d:1d:7d” command on the CVK host where the VM resides.
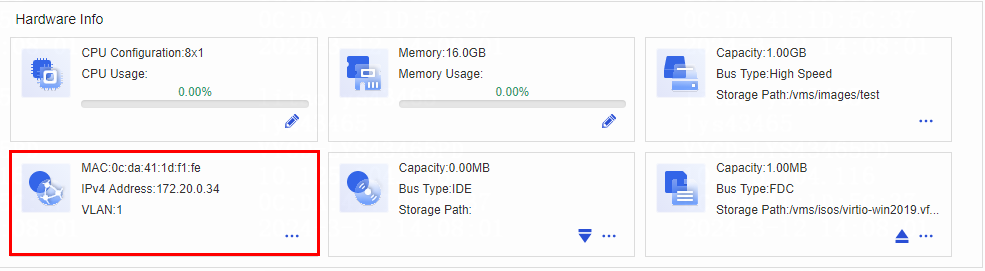
-- iface_mac: Specifies the MAC address of the VM's NIC. If you specify multiple MAC addresses, separate them by commas. To view the MAC addresses of the VM's NICs, access the VM summary page in the management platform.
- Descriptions of script-generated files:
At directory /root/tcpdump/, related logs and packet capture files are generated:
-rw-r----- 1 root root 37 Jun 7 10:37 20230607103752-check_network.pid—Process PID numbers for tcpdump and ping tasks generated by running the check_network script.
-rw-r----- 1 root root 3313 Jun 7 10:37 20230607103752-ovs_dbg_listports—Network topology information when the check_network script runs.
-rw-r----- 1 root root 1412 Jun 7 10:38 20230607103752-ping.log—Log of the ping task.
-rw-r----- 1 root root 287 Jun 7 10:37 check_network.log—Operation log of the check_network script.
drwxr-x--- 2 root root 4096 Jun 7 10:37 eth2—Capture file for the physical NIC bound to vswitch0.
drwxr-x--- 2 root root 4096 Jun 7 10:37 vnet0—Capture file for the specified vNIC.
drwxr-x--- 2 root root 4096 Jun 7 10:37 vnet1, rwxr-x--- 2 root root 4096 Jun 7 10:37 vnet3, and wxr-x--- 2 root root 4096 Jun 7 10:37 vswitch0—Capture files for vswitch0.
¡ Ending the script task.
Check the .pid files in the check_network operation log and pay attention to the timestamp information.
cat /root/tcpdump/20230518100318-check_network.pid
2403 2405 2407 2408
Execute the kill commands to terminate the processes with pids listed in the above pid file. In this example, execute the kill 2403, kill 2405, kill 2407, and kill 2408 commands.
|
|
CAUTION: If you run the check_network.sh script multiple times, the system generates multiple .pid files. After capturing packets, manually kill the pids recorded in these .pid files. · After capturing packets, promptly end the capture task to prevent ongoing packet capture from occupying system space. · After capturing packets, please package the /root/tcpdump directory and send it to the technical support for analysis. |
VM IP address conflict occurs
Symptom
The host (for example, 172.16.51.23) is in an abnormal connection state, yet all services on the host are displayed normal. The logs show failed connection attempts to the host. When you SSH the host with the correct password, the SSH connection fails, prompting incorrect password.
Impact
You cannot access the host.
Analysis
Capture packets on both the local PC's NIC and on the host's vSwitch 0 simultaneously. Then, initiate an SSH request from the PC and analyze the captured packets. An example is as follows:
· The request packet on the local PC shows that the MAC address corresponding to IP address 172.16.51.23 is 0c:da:41:1d:10:2e.
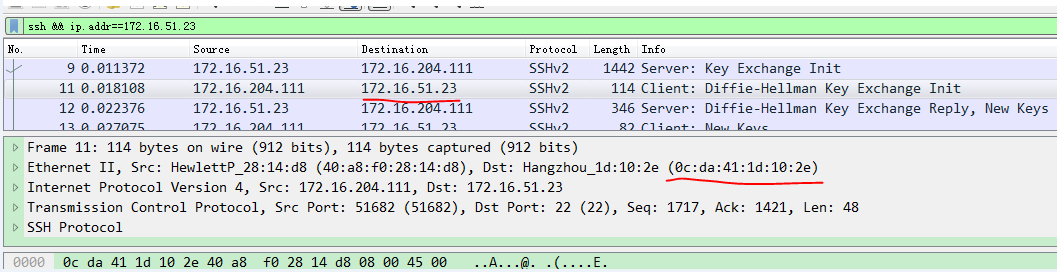
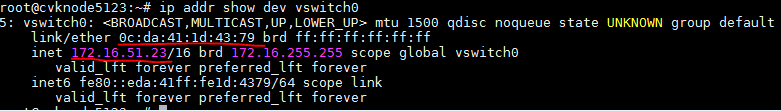
· No request is captured on the host. Check the MAC address of vSwitch 0 in the CVK, which is 0c:da:41:1d:43:79, and the IP address is 172.16.51.23.
· Output shows that two devices within the LAN are configured with IP address 172.16.51.23, causing IP address conflict.
Solution
Replace the conflicted IP address with another one.
VMs cannot access the gateway address after ACL configuration
Symptom
The VM can access other IP addresses correctly but cannot access the gateway (for example, 172.16.51.6).
Impact
Users’ VM services are affected.
Analysis
The packet forwarding path is VM NIC -> vNetwork -> host NIC -> physical switch. Capture packets on the vNetwork and host NIC eth0. The results are as follows:
The vNetwork has received the ICMP request, but it was not captured on the Ethernet interface.
Perform the following tasks to view the ACL configuration on a vNetwork:
1. Execute the ovs_dbg_listports command to view the VM to which the vNetwork belongs.
2. Execute the virsh dumpxml vm_name command to view the XML document of the VM. You can find the interface node and view the following information:
<interface type='bridge'>
<mac address='0c:da:41:1d:56:a7'/>
<source bridge='vswitch0'/>
<vlan>
<tag id='1'/>
</vlan>
<virtualport type='openvswitch'>
<parameters interfaceid='bfcd8333-2282-4d08-a0bb-cc14a37ff1e9'/>
</virtualport>
<target dev='vnet0'/>
<model type='virtio'/>
<driver name='vhost'/>
<hotpluggable state='on'/>
<filterref filter='acl-test'/>//ACL name.
<priority type='low'/>
<mtu size='1500'/>
<alias name='net0'/>
<address type='pci' domain='0x0000' bus='0x00' slot='0x03' function='0x0'/>
</interface>
3. Execute the virsh nwfilter-dumpxml acl_name command to view the specific contents of the ACL.
root@cvknode112:~# virsh nwfilter-dumpxml acl-test
<filter name='acl-test' chain='root'>
<uuid>41f62fca-275b-4a72-8ad8-515d9e9589c1</uuid>
<rule action='accept' direction='in' priority='4' statematch='false'> //Permit incoming traffic by default.
<all/>
</rule>
<rule action='accept' direction='out' priority='5' statematch='false'>//Permit outgoing traffic by default.
<all/>
</rule>
<rule action='accept' direction='in' priority='6' statematch='false'>//Permit incoming traffic by default.
<all-ipv6/>
</rule>
<rule action='accept' direction='out' priority='7' statematch='false'>//Permit outgoing traffic by default.
<all-ipv6/>
</rule>
<rule action='drop' direction='in' priority='10' statematch='false'>
<icmp dstipaddr='172.16.51.6' dstipmask='32'/>//Drop ICMP packets with the destination address 172.16.51.6.
</rule>
</filter>
4. Analyze the ACL rule to determine that the OVS ACL rule drops the packet.
root@cvknode112:~# ovs-appctl dpif/dump-flows vswitch0 | grep "172.16.51.6"
recirc_id(0),in_port(8),eth_type(0x0800),ipv4(dst=172.16.51.6,proto=1,tos=0/0xfc,frag=no), packets:10426, bytes:1021748, used:0.369s, actions:drop
5. View the kernel flow entries of OVS and you can also view information about dropped packets.
Solution
Edit the ACL configuration of the VM.
SSH connection cannot be established due to the vFirewall
Symptom
Both VMs are configured with a vFirewall, and the policies do not contain any rules of blocking SSH. The VMs are also configured with the same VLAN, but they cannot SSH each other.
Impact
VMs cannot SSH each other, affecting users' network services.
Analysis
Both VM NICs are bound to vs-app, and the VMs are configured with the same VLAN 188 and vFirewall FW_white, as shown in the following figure:
The user-space flow tables for the two VMs are as follows:
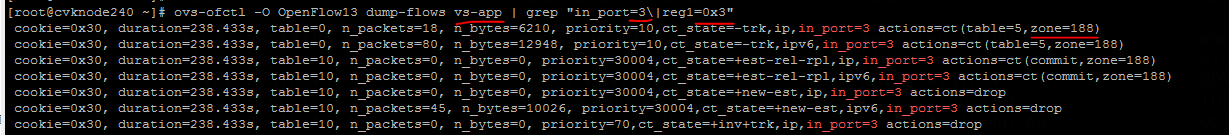
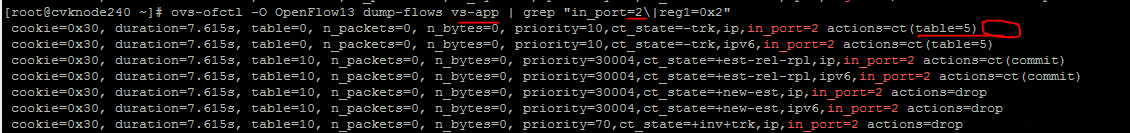
The output shows that the zone values in the flow tables are inconsistent, with one being 188 and the other 0. Both should be 188. The inconsistency causes SSH operations to fail.
Solution
Use scripts set_cvm_port_flow.sh and set_cvk_port_flow.sh to resolve the issue.
· Use the set_cvm_port_flow.sh command to execute the script on the CVM host. The specific steps are as follows:
¡ Upload scripts set_cvm_port_flow.sh and set_cvk_port_flow.sh to the same directory on the CVM host.
¡ Execute the bash set_cvm_port_flow.sh command to upload script set_cvk_port_flow.sh to directory /opt/bin/ for all CVK hosts.
¡ After execution, view the log at /var/log/set_cvk_port_flow.log to identify whether any flow table errors were corrected.
· Execute the set_cvk_port_flow.sh command on the CVK host to repair the flow for a specific VM port or to repair the flow for all VM ports without specifying any parameter. The specific steps are as follows:
bash /opt/bin/set_cvk_port_flow.sh vnetx
If the parameter is incorrect, a prompt will appear.
bash /opt/bin/set_cvk_port_flow.sh aa:bb:cc:dd:ee:ff
If the parameter is incorrect, a prompt will appear.
bash /opt/bin/set_cvk_port_flow.sh
· Remarks:
¡ Execute script set_cvm_port_flow.sh only on CVM hosts. The script has no parameters.
script can only run on CVM!
example:
set_cvm_port_flow.sh check whether the virtual port configuration vfirewall and flow table are correct on cvm and cvk
¡ Every CVK host has a scheduled task of automatically executing script set_cvk_port_flow.sh at 23:00 daily. It automatically corrects any incorrect VM flows.
¡ The CVK log description is as follows:
-----------------------------------------2022/08/29 11:21:50-------------------------------------
cvknode116 vnet0 of vswitch0 is config FW, the flow table is correct, do not need revalidate flow
cvknode116 vnet1 of vswitch0 is not config FW, do not need revalidate flow
cvknode116 vnet2 of vswitch0 is config FW, the flow table is error, do need revalidate flow
cvknode116 vnet3 of vswitch0 is config FW, the flow table is correct, do not need revalidate flow
cvknode116 vnet4 of vswitch0 is not config FW, do not need revalidate flow
cvknode116 vnet5 of vswitch0 is not config FW, do not need revalidate flow
cvknode116 vnet6 of vswitch0 is not config FW, do not need revalidate flow
-----------------------------------------2022/08/29 11:21:50-------------------------------------
Restart the host after configuring DNS on the VM of the Galaxy Kylin operating system, and the configuration fails
Symptom
Restart the host after configuring DNS on the VM of the Galaxy Kylin operating system, and the configuration fails.
Impact
The users' VM network is affected.
Analysis
The DNS configuration file for a VM of the Galaxy Kylin operating system is located at /etc/resolv.conf, which is a symbolic link file.
Solution
Delete the current symbolic link file /etc/resolv.conf and create a new file /etc/resolv.conf. Then, add the required DNS profile to the new file.
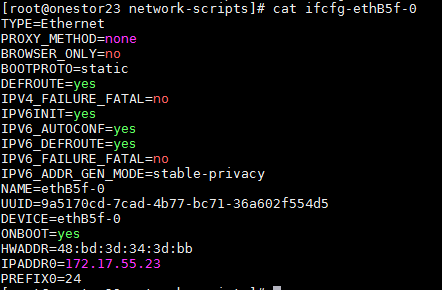
When you configure an IPv4 address for an Ubuntu 20 VM, the Web interface prompts an error: Failed to edit VM xxx configuration
Symptom
When you configure an IPv4 address in Ubuntu 20 or later OS versions, the management platform prompts an error: Failed to edit VM xxx configuration. The cause of the error: Failed to configure IPv4 and IPv6 network information via CAStools.
Impact
You cannot configure the network settings for VMs running the Ubuntu 20 or later OS versions on the management platform page.
Analysis
When you configure an IPv4 address, the system sets the MTU value last. If the log at /var/log/set-ipv6.log contains error Can not find /etc/netplan/tools-netcfgv6.yaml to update mtu, the system incorrectly stops calling the script, preventing the IP address configuration.
Solution
Manually create file /etc/netplan/tools-netcfgv6.yaml at the CLI of the VM. Alternatively, configure the IPv6 address first, and then configure the required IPv4 address.
Troubleshooting storage service exceptions
Block storage exceptions
Some VMs or storage volumes are suboptimal on UIS
In scenarios where part of the services is affected, only some client-side storage volumes are inactive and the related VMs are either shut down or suspended.
Services in a ONEStor node pool are all running incorrectly
Symptom
As shown in the following figure, when some storage volumes have alarms or are operating incorrectly on the client side, all storage volumes in a ONEStor node pool are detected suboptimal.
Figure 3 View suboptimal storage volumes on the client side
Solution
The troubleshooting process is the same as that in scenarios where all storage services in the cluster are affected. The only difference is that the operation scope is narrowed from the entire cluster to the faulty node pool.
Some services in a ONEStor node pool are running incorrectly
Symptom
When some storage volumes have alarms or are operating incorrectly on the client side, only some of the storage volumes in a ONEStor node pool are detected suboptimal.
Solution
Identify whether the data health of the cluster is 100%, and then troubleshoot the exception accordingly:
If the data health of the cluster is 100%:
You can view the data health of the cluster by using one of the following methods:
· Access the dashboard of the Web cluster management interface, and then identify whether the data health of the cluster is 100%.
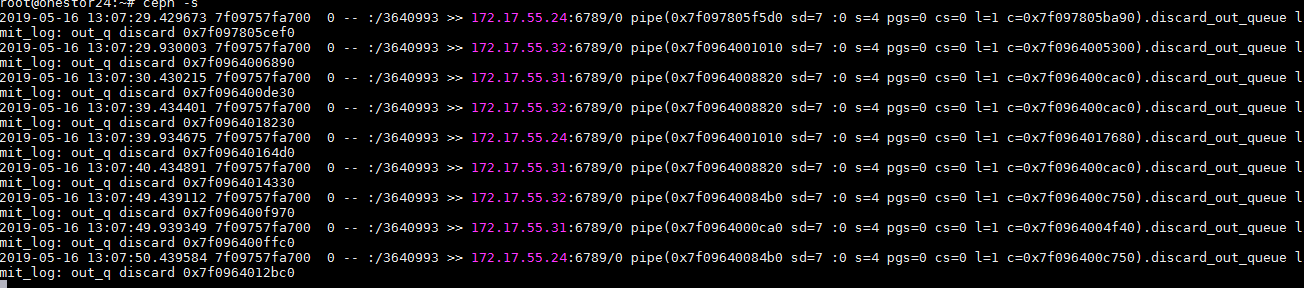
· Execute the ceph -s command at the backend of any node, and then identify whether the command output displays HEALTH_OK.
Figure 4 Viewing the data health of the cluster at backend
To resolve this exception, perform the following operations:
1. Identify whether the faulty client can communicate with all tgt nodes in the storage cluster over the service network. If the client cannot communicate with a tgt node over the service network, check for incorrect link and network configurations (including network port, gateway, and route settings) between the client and the tgt node, and restore the network connection to normal.
Figure 5 Pinging the service-network IP address of a tgt node
Figure 6 Checking for incorrect routing information
Figure 7 Check for abnormal network ports
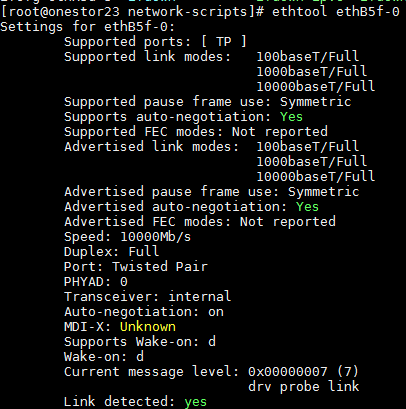
Figure 8 Check for incorrect NIC configurations
2. If the client can communicate with all tgt nodes in the storage cluster over the service network, but cannot access the HA VIP, you can execute service keepalived restart on each node. If the exception persists, delete the HA group and recreate it.
Figure 9 Restarting the keepalived service
![]()
3. If no faults are found after the previous checks, execute service tgt forcedrestart on all nodes within the HA group to forcibly restart their tgt processes.
Figure 10 Forcibly restarting the tgt process
![]()
4. After completing the above steps, reconnect the client to the faulty storage volumes. If the storage volumes still cannot be connected, contact Technical Support.
If the cluster health is not 100%:
You can view the data health of the cluster by using one of the following methods:
· Access the dashboard of the Web cluster management interface, and then identify whether the data health of the cluster is 100%.
· Execute the ceph -s command at the backend of any node, and then identify whether the command output displays HEALTH_WARN or HEALTH_ERR.
To resolve this exception, perform the following operations:
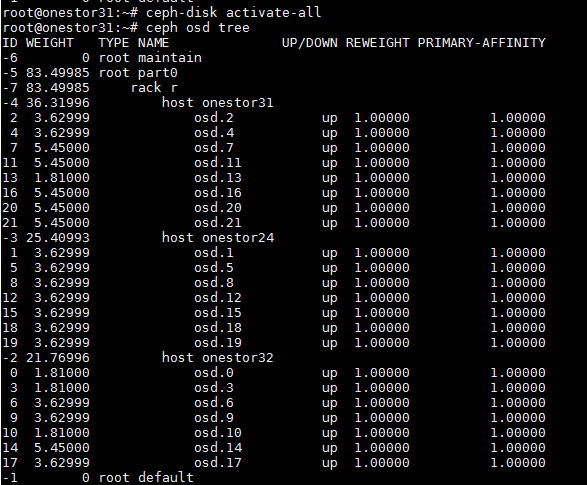
1. Execute the ceph osd tree command to identify whether more than one cluster node has OSDs in down state. If so, log in to each of the faulty nodes, and then execute the ceph-disk activate-all command to activate the down OSDs. If some OSDs cannot be activated on a node, contact Technical Support.
Figure 11 Checking the cluster for OSDs in down state
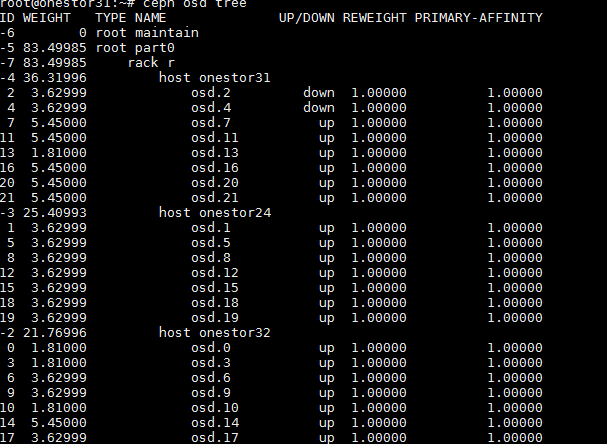
Figure 12 Bringing up OSDs
2. If the number of nodes with down OSDs does not exceed one, but the output of the ceph -s command displays pg peering/stale/inactive/down:
a. Execute the ceph health detail command to find the OSDs hosting the abnormal PGs.
b. Log in to the nodes hosting these OSDs, and then restart the OSDs one by one.
c. If the exception persists after the OSDs are restarted, contact Technical Support.
The detailed procedure is as follows:
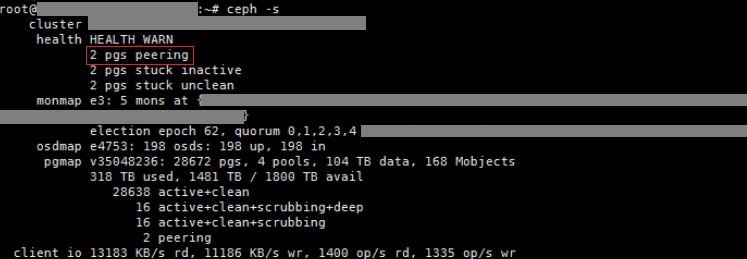
a. Execute the ceph -s command on a random node of the cluster. The command output shows that two PGs are constantly in peering state.
Figure 13 Viewing PG status
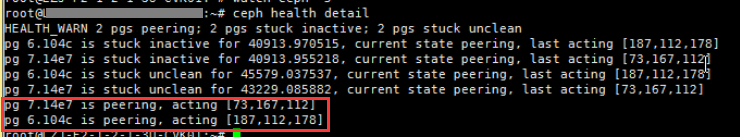
a. Execute the ceph health detail to locate the abnormal PGs. As shown in the following figure, the two PGs in peering state are 7.14e7 and 6.104c. PG 7.14e7 resides on osd.73, osd.167, and osd.112. PG 6.104c resides on osd.187, osd.112, and osd.178. Since osd.112 is hosting both of the PGs, restart osd.112 preferentially as a best practice.
Figure 14 Viewing the OSDs hosting a PG
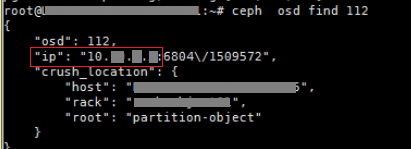
a. Execute the ceph osd find 112 (OSD 112 is used for illustration only. You can substitute 112 with the real OSD ID as needed on a live network) to find the IP address of the host on which osd.112 resides.
Figure 15 Obtaining the IP address of the host on which an OSD resides
a. Log in to the previous host via SSH, and then execute the systemctl restart ceph-osd@112.service command to restart osd.112.
b. After the restarting is completed, execute the ceph -s command to verify that the two abnormal PGs are no longer in peering state. If they are still in peering state, restart the other OSDs found in step b one by one.
3. After completing the above steps, reconnect the client to the faulty storage volumes. If the storage volumes still cannot be connected, contact Technical Support.
All VMs or storage volumes on UIS are suboptimal, and the cluster is suboptimal
In either of the following scenarios, all services are affected:
· All client hosts are fenced and restarted (only for CAS).
· All storage volumes are inactive, and the related VMs are either shut down or suspended.
In one of the following scenarios, the cluster is suboptimal:
· On the dashboard of the Web cluster management interface, the data health of the cluster is not 100%.
· At the backend of a cluster node, the output of the ceph -s command does not display HEALTH_OK.
· You cannot obtain the cluster status either through the Web cluster management interface or the ceph -s command.
More than one node has OSDs in down state
Symptom
After executing the ceph osd tree command at the backend of a random cluster node, you find that more than one cluster node has OSDs in down state.
Solution
· If OSDs on some nodes are all down, identify whether those nodes can communicate with the other nodes in the cluster over either the storage front-end network (also called service network) or the storage back-end network.
a. If a faulty node cannot communicate with the other cluster nodes, log in to the console of the node through either HDM or iLO, and identify whether the node has a black screen or is stuck.
- If the node has a black screen or is stuck, restart the node through HDM.
- If the operating system of the node can operate normally, execute the ip addr command to check for network ports in down state. If a network port is down, identify whether the related physical link is properly connected. If the physical link is properly connected, execute the ifup command to manually start the network port. Then, execute the ip addr command to again to identify whether the network port has come up. If the network port remains down, execute the reboot command to restart the node.
Figure 16 Checking for network ports in down state
Figure 17 Manually starting a network port
![]()
Figure 18 Confirming whether a network port is up
a. If the node still cannot communicate with the other cluster nodes after the above actions, contact Technical Support.
b. If the node can communicate with the other cluster nodes after the above actions, log in to the node via SSH, and then execute the ceph-disk activate-all command to activate the down OSDs. If manual OSD activation fails, contact Technical Support.
· If some nodes have a few (not all) OSDs in down state, log in to each of the faulty nodes via SSH, and then execute the ceph-disk activate-all command to activate the down OSDs. If manual OSD activation fails on a node, contact Technical Support.
After completing the above operations, reconnect the client to the faulty storage volumes. If the storage volumes still cannot be connected, contact Technical Support.
Only one node has OSDs in down state or the cluster does have OSDs in down state
Symptom
After executing the ceph osd tree command at the backend of a random cluster node, you find that only one node has OSDs in down state or the cluster does have OSDs in down state. However, the cluster is still suboptimal. The output of the ceph –s command displays pg peering/stale/inactive/down.
Solution
First, execute the ceph health detail command to find the OSDs hosting the abnormal PGs. Second, log in to the nodes hosting these OSDs, and then restart the OSDs one by one. Third, if the exception persists after the OSDs are restarted, contact Technical Support.
The detailed procedure is as follows:
1. Execute the ceph -s command on a random node of the cluster. The command output shows that two PGs are constantly in peering state.
Figure 19 Viewing PG status

2. Execute the ceph health detail to locate the abnormal PGs. As shown in the following figure, the two PGs in peering state are 7.14e7 and 6.104c. PG 7.14e7 resides on osd.73, osd.167, and osd.112. PG 6.104c resides on osd.187, osd.112, and osd.178. Since osd.112 is hosting both of the PGs, restart osd.112 preferentially as a best practice.
Figure 20 Viewing the OSDs hosting a PG

3. Execute the ceph osd find 112 (OSD 112 is used for illustration only. You can substitute 112 with the real OSD ID as needed on a live network) to find the IP address of the host on which osd.112 resides.
Figure 21 Obtaining the IP address of the host on which an OSD resides

4. Log in to the previous host via SSH, and then execute the systemctl restart ceph-osd@112.service command to restart osd.112.
5. After the restarting is completed, execute the ceph -s command to verify that the two abnormal PGs are no longer in peering state. If they are still in peering state, restart the other OSDs found in step b one by one.
After completing the above steps, reconnect the client to the faulty storage volumes. If the storage volumes still cannot be connected, contact Technical Support.
Cluster status information is unavailable
Check procedure
1. Log in to the Web cluster management interface, and then identify whether the Dashboard, System Log, and Operation Log tabs are displayed. As shown in the following figure, you can find that only the System Log and Operation Log tabs are displayed.
2. Execute the ceph -s command on each node. As shown in the following figure, you can find that this command does not output any information.
Figure 22 The ceph -s command has no output at the backend
Solution
1. Identify whether all monitor nodes can communicate with non-monitor nodes in the cluster over either the storage front-end network or the storage back-end network.
a. If a monitor node cannot communicate with non-monitor nodes, log in to the console of the node through either HDM or iLO, and identify whether the node has a black screen or is stuck.
- If the node has a black screen or is stuck, restart the node through HDM.
- If the operating system of the node can operate normally, execute the ip addr command to check for network ports in down state. If a network port is down, identify whether the related physical link is properly connected. If the physical link is properly connected, execute the ifup command to manually start the network port. If the network port remains down after manual restarting, execute the reboot command to restart the node.
b. If the node still cannot communicate with non-monitor nodes after the above actions, contact Technical Support.
c. If the node can communicate with non-monitor nodes after the above actions, perform the following operations:
- Verify that the other monitor nodes can also communicate with non-monitor nodes. Repeat the above steps for faulty monitor nodes.
- Execute the systemctl restart ceph-mon.target command on all of the monitor nodes to restart their monitor processes.
2. After completing the above steps, execute the ceph –s command to view the cluster status. If the cluster is still suboptimal, troubleshoot the exception as described in chapters 4.1 and 4.2. If the ceph –s command still has no output, contact Technical Support.
If this exception occurs after a ceph-mon process or monitor node is restarted, you must completely shut down the restarted ceph-mon service.
To completely shut down a ceph-mon service, execute the touch /var/lib/ceph/shell/mon_maintaining and systemctl stop ceph-mon.target commands in sequence.
The client cannot reach the HA VIP, and the system does not display information about the active HA node
|
|
NOTE: The exception does not occur in scenarios where converged deployment uses 127.0.0.1 for mounting. |
Check procedure
1. Execute the ping command on the client to ping the HA VIP used for storage volume mounting. You can find that the client cannot reach the HA VIP.
2. View information about the current active HA node. You can find that the system does not display information about the active HA node.
Solution
Log in to the Web cluster management page, navigate to the Volume Mappings > iSCSI HA page, and then view the current active HA node. If no information is displayed, you can execute the service keepalived restart command at the backend of each node within the HA group.
The iSCSI HA VIP is unreachable
Symptom
The iSCSI HA VIP is unreachable.
Possible cause
· Possible cause 1: The configurations of service NICs have been changed.
· Possible cause 2: Multiple clusters are using the same iSCSI HA group ID (also called VRID).
Troubleshooting
1. Identify whether certain NIC operations were performed, such as changing the bond interfaces of NICs or switching over service-network NICs and storage-network NICs. If so, this exception might be caused by NIC configuration changes. If no NIC configuration changes exist, continue to check for the cause of this exception.
2. Execute the cat /var/log/messages | grep VRID command in the OS command shell of an iSCSI HA node. If error information similar to the following is output, the cause of the exception might be that multiple clusters are using the same iSCSI HA group ID. If you cannot determine the cause of the exception, contact Technical Support.
Apr 25 17:10:27 onestor206 Keepalived_vrrp[555604]: ip address associated with VRID not present in received packet : 192.16.1.214
Apr 25 17:10:27 onestor206 Keepalived_vrrp[555604]: one or more VIP associated with VRID mismatch actual MASTER advert
Solution
Possible cause 1
Delete the original iSCSI HA group and recreate it. For more information about this task, see the online help for this product.
Possible cause 2
· Make a new iSCSI HA plan and assign different iSCSI HA group IDs (VRID) to the related clusters. For more information about this task, see the online help for this product.
· Delete the original iSCSI HA group and recreate it. For more information about this task, see the online help for this product.
Failure to read or write data through the iSCSI HA VIP
Symptom
Although the iSCSI HA VIP is accessible, if this IP address is used for read/write operations, those operations will fail.
Possible cause
The cluster is busy.
Fault localization
Execute the cat /var/log/messages | grep io error command in the OS command shell of an iSCSI HA node. If error information similar to the following is output, the cause of the exception might be that the cluster is busy. If you cannot determine the cause of the exception, contact Technical Support.
Mar 8 11:39:58 wy-ost209 tgtd: procaioresp(221) io error 0x1f33160 28 -110
Solution
1. Ease the storage service load on the cluster.
2. Limit the IOPS of the cluster. You can achieve this goal either by configuring network devices (such as switches) or by using the related features provided on the Web management interface of the storage system. For more information about how to limit the cluster IOPS through the Web management interface, see the online help for this product.
3. Contact Technical Support to perform hardware or device upgrade for the cluster.
The client can ping the HA VIP, but it cannot mount storage volumes
|
|
NOTE: The exception does not occur in scenarios where converged deployment uses 127.0.0.1 for mounting. |
Check procedure
Although the client can reach the HA VIP used for storage volume mounting, it cannot mount storage volumes.
Solution
1. Log in to the Web cluster management interface, and then identify whether the HA group using the HA VIP is enabled with the load balancing feature. If the load balancing feature is enabled, use the ping command on the client to ping the real IP addresses of nodes in the HA group.
¡ If the real IP address of a node is unreachable, check for incorrect link and network configurations (including network port, gateway, and route settings) between the client and the node, and then restore the network connection to normal.
¡ If all nodes in the HA group are reachable, execute the telnet ip 3260 command on each node to Telnet to them. Make sure the ip argument is replaced with the real IP address of each node. If you fail to Telnet to a node, execute the service tgt forcedrestart command on that node.
2. If the high availability group has not enabled load balancing or has enabled it but the client can ping the actual IP addresses of all nodes, execute the service tgt forcedrestart command on all nodes to forcibly restart the tgt process. If no faults are found after the previous checks, If one of the following conditions exists, you can execute service tgt forcedrestart on all nodes within the HA group to forcibly restart their tgt processes.
¡ The HA group is not enabled with the load balancing feature.
¡ The HA group is enabled with the load balancing feature, and the client can reach all nodes in the HA group.
3. After completing the above operations, reconnect the client to the faulty storage volumes. If the storage volumes still cannot be connected, contact Technical Support.
Troubleshooting file storage exceptions
Failure to access a share via a load balancing domain name
Symptom
When LB domain names are used for accessing CIFS shares, some users fail to log in.
Possible cause
The DNS server settings used by the client conflict with those for the storage cluster.
Fault location
Identify whether the DNS server address of the storage cluster is specified for the client in conjunction with other DNS server addresses. If so, the possible cause of this exception is that the DNS server settings used by the client conflict with those for the storage cluster. If you cannot determine the cause of the exception, contact Technical Support.
Solution
1. Change the DNS server address settings for the client, ensuring that the client is configured with only one DNS server address of the storage cluster. If the related users can log in successfully after the DNS server address settings are changed, the exception has been resolved.
2. If the exception persists, contact Technical Support.
When you delete an abnormal NAS node, the system prompts that the specified node cannot be connected
Symptom
When you delete an abnormal NAS node, the deletion fails and the system prompts the following error message.
![]()
Possible cause
The storage front-end network has failed.
Fault location
Examine the storage front-end network of the cluster. If the storage front-end network cannot be connected or is unresponsive, the possible cause of this exception is that the storage front-end network is down. If you cannot determine the cause of the exception, contact Technical Support.
Solution
Restore the storage front-end network to normal or contact Technical Support. After the storage front-end network is recovered, delete the NAS node again. If the NAS node is successfully deleted, the exception has been resolved.
After an authentication method change, the client prompts a lack of access permissions
Symptom
After the authentication method is changed on the management interface of the storage system, the client prompts that you do not have access permissions and you need contact the network administrator to request access permissions.
Possible cause
Residual user information exists on the client.
Fault location
If the residual user information is invalid under the new authentication mode, the client's access request will be rejected. If the client can access the shared directory after the cached user information is cleared, the possible cause of this exception is that the client has residual user information. If you cannot determine the cause of the exception, contact Technical Support.
Solution
1. Clear the cached login information as follows:
a. In the client’s Windows operating system, press WIN+R, and then enter cmd to open the Windows command shell.
b. Execute the net use * /del /y command to clear the cached login information.
c. Verify that the shared directory is accessible. If the client can access the shared directory, the exception has been resolved.
2. If the shared directory is still inaccessible, perform the following operations:
a. In the client’s Windows operating system, press WIN+R, and then enter regedit.
b. Find and delete the address in HKEY_CURRENT_USER/Software/Microsoft/Windows/CurrentVersion/Explorer/RunMRU.
c. Verify that the shared directory is accessible. If the client can access the shared directory, the exception has been resolved.
3. If the shared directory is still inaccessible, perform the following operations:
a. In the client’s Windows operating system, right-click the Computer icon, select Manage > Services and Applications > Services.
b. Find and restart the Workstation service.
c. After the service is restarted, verify that the shared directory is accessible. If the client can access the shared directory, the exception has been resolved.
After the NFS service is unmounted, the TCP connection still exists
Symptom
After the NFS service is successfully unmounted from the client, the mount information no longer exists on the client. However, the related TCP connection still exists.
Possible cause
The client and the server have not been completely disconnected.
Fault location
The client does not actively terminate TCP connections with the server. The client re-establishes a TCP connection to the server as long as it initiates a request, even if the server has forcibly terminated their connections. If the TCP connection disappears after the client is restarted, the possible cause of this exception is that the client and the server have not been completely disconnected. If you cannot determine the cause of the exception, contact Technical Support.
Solution
Restart the client. If the TCP connection to the server disappears immediately or after the TCP connection timeout timer expires, the exception has been resolved.
Failure to access a CIFS shared directory
Symptom
A Hyper-V VM running on a Windows client fails to access a CIFS shared directory.
Possible cause
The Windows client and the storage cluster are not in the same AD domain.
Fault location
Add the Windows client and the storage cluster to the same AD domain. If the Hyper-V VM can access the CIFS shared directory, the possible cause of this exception is that the Windows client and the storage cluster are not in the same AD domain. If you cannot determine the cause of the exception, contact Technical Support.
Solution
Add the Windows client and the storage cluster to the same AD domain, and then identify whether the Hyper-V VM can access the CIFS shared directory. If the CIFS shared directory is accessible, the exception has been resolved.
When NFS shares are in use, services on some clients might be laggy or interrupted
Symptom
When multiple clients synchronously access an NFS share, one of the clients experiences laggy services or service interruption.
Possible cause
The faulty client uses the same name as another client.
Fault location
Contact Technical Support to check system logs for logs about the client with duplicate name. If such logs are found, the possible cause of this exception is that the client uses the same name as another client. If you cannot determine the cause of the exception, contact Technical Support.
Solution
Rename the conflicting clients, ensuring that they use different names. Then, identify whether the affected services can operate correctly. If they can operate correctly, the exception has been resolved.
When an FTP client accesses a shared directory, the directory is not refreshed
Symptom
When an FTP client accesses a shared directory, the content of the directory is not refreshed
Possible cause
Residual document information exists on the FTP client.
Fault location
FTP clients might directly use cached information to display document lists instead of sending refresh requests to the server. If the content of the shared directory is updated after you refresh the shared directory, the possible cause of this exception is that the client has residual document information. If you cannot determine the cause of the exception, contact Technical Support.
Solution
Wait for a while and identify whether the FTP shared directory is updated. If not, refresh the FTP shared directory from the client. For more information about this operation, contact Technical Support. If the FTP shared directory is updated, the exception has been resolved.
Exceptional disconnection of the Windows 10 client
Symptom
The shared connection of the Windows client is disconnected abnormally.
Analysis
The shared file is renamed with the ren command at the CLI of the Windows 10 operating system.
Fault location
In the Windows 10 operating system, using the ren command at the CLI will repeatedly open the shared directory until the process reaches its maximum, causing the shared connection to disconnect. After you use the ren command in the Windows 10 client to rename the shared file, if the client is disconnected abnormally, the issue might be caused by the defect in the Windows 10 operating system. If the reason cannot be located, contact Technical Support for help.
Solution
Do not use the ren command at the CLI of the Windows 10 operating system to rename the shared file. If the issue already exists and cannot be recovered, contact Technical Support for help.
Replace the operating system other than Windows 10 for the client.
NAS server deletion failure
Symptom
The system management page displays that the NAS node state is normal. An error occurs when you delete the NAS node.
Analysis
The NAS node is experiencing network issues.
Fault location
If the cluster network is abnormal and the NAS node also has network issues, the abnormal state of the NAS node might not be synced to the management page. After the storage cluster management network is restored, if the storage system management page displays abnormal NAS node state, a network issue might occur to the NAS node. If the reason cannot be located, contact Technical Support for help.
Solution
Troubleshoot and restore the cluster management network, or contact Technical Support for help. After the network returns to normal state, perform the delete operation again. If the operation succeeds, the issue is resolved.
Insufficient rollback quota size upon snapshot rollback
Symptom
Create a quota policy for a non-empty directory and create a snapshot after the directory is full. An error message is displayed that the rollback quota size is insufficient for snapshot name during snapshot rollback.
Analysis
The total rollback snapshot size exceeds the hard quota threshold of the directory.
Fault location
Examine the hard quota threshold in the directory quota policy. If it is less than the total rollback snapshot size, the failure might be due to insufficient quota size. If the reason cannot be located, contact Technical Support for help.
Solution
Set the hard quota threshold in the directory quota policy to a value greater than the size of the snapshot rollback data. Then, perform the snapshot rollback operation again. If the rollback is successful, the issue has been resolved.
Quota management - Incorrect number of directory files
Symptom
Open the directory with file count quota. You can see that the quota usage has reached 100%, but the actual usage is less than 100%.
Analysis
Temporary files are occupying the file count quota.
Fault location
Temporary files are also counted in the file count quota. If temporary files exist in the directory, the issue might be caused by counting temporary files into the quota. If the reason cannot be located, contact Technical Support for help.
Solution
1. Exit the operating system's file editor to release the file count quota occupied by temporary files.
2. Increase the hard threshold for directory quotas and adjust the file count quota for the directory. For more information, see the online help of the product.
Troubleshooting network, device, and other issues
Incorrect login to the Web interface
Symptom
The front-end Web interface cannot be logged in correctly.
Impact
You cannot log in to the front-end Web interface correctly, and cannot perform platform management.
Analysis
The related services on the management platform page might have exceptions.
Solution
After logging into the CVM node backend through SSH, execute the service uis-core status command to identify whether the uis-core service is running correctly.
· If uis-core is disabled, restart it by executing the service uis-core restart command.
· If uis-core is running, execute the ps -ef | grep uis-core command to obtain the PID of uis-core.
¡ Execute the jstack -l PID > /vms/file name command to obtain the uis-core stack file.
¡ Execute the jmap -dump:format=b,file=/vms/file name PID command to obtain a memory image.
¡ Execute the service uis-core restart command to restart uis-core.
After logging in to the CVM node backend through SSH, execute the service tomcat8 status command to identify whether tomcat8 is running correctly.
· If tomcat8 is disabled, execute the service tomcat8 restart command to restart tomcat8.
· If Tomcat8 is running, execute the ps -ef | grep tomcat8 command to obtain the PID of tomcat8.
¡ Execute the jstack -l PID > /vms/file name command to obtain the tomcat8 stack file.
¡ Execute the jmap -dump:format=b,file=/vms/file name PID command to obtain the memory image of tomcat8.
¡ Execute the service tomcat8 restart command to restart tomcat.
Collect the previous files to facilitate fault location.
¡ The log reports a rabbitmq initialization failure: The rabbitmq service is running correctly (check with the service rabbitmq-seerver status command), but the system time is incorrect, which is earlier than May 2021. Attempt to change the system time to the current time and restart the host.
¡ The rabbitmq service is experiencing an issue and an error message is displayed that Too short cookie string, as shown in the figure below.
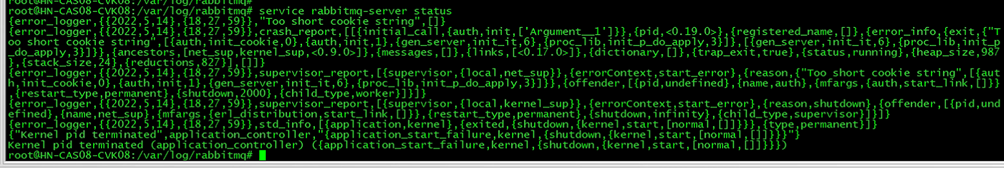
- Identify whether the root directory (/) of the disk is full.
- Delete the /var/lib/rabbitmq/.erlang.cookier file.
¡ Start rabbitmq by executing the service rabbitmq-server start command and verify the permissions of the cloud user.
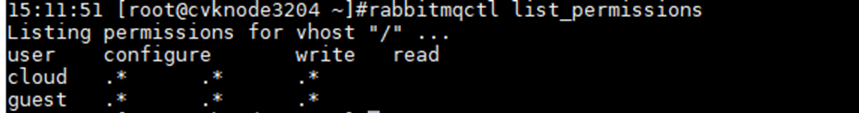
If the cloud user's permissions are incorrect, reinitialize the rabbitmq user permissions by running the rabbitmq-init.sh script in the update package.
¡ The rabbitmq service is abnormal. When you execute the rabbitmq-server command to start the rabbitmq service, insufficient permissions is reported for the log directory (/var/log/rabbitmq), as shown in the figure below:
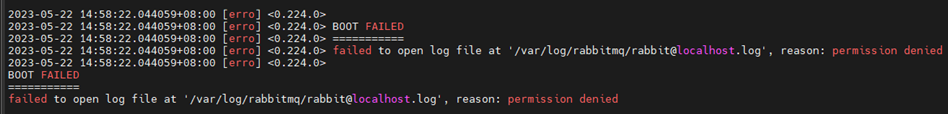
Manually create the rabbitmq log directory /var/log/rabbitmq.
If the directory exists, try assigning permissions to the rabbitmq user.
¡ Start the rabbitmq service. The rabbitmq service is abnormal. Try starting it with the rabbitmq-server command. The startup process takes a long time and then times out. See the figure below for more information.

- Troubleshoot the iptables to make sure ports 4369 and 5672 required by rabbitmq are not blocked.
- Examine the iptables rules and permit the ports required by rabbitmq.
- Start the rabbitmq service.
Failure to access the front-end Web interface with a log report of database connection failure
Symptom
You cannot open the front-end Web interface correctly, and a log reports a database connection failure.
Impact
You cannot log in to the front-end Web interface correctly, and cannot perform platform management.
Analysis
· A power outage occurs and causes a database service exception.
· A database file permission error occurs.
· The database space is full.
Solution
· The database data directory, log directory, and the files in the directories must be owned by the mysql user. If not, execute the chown mysql:mysql -R /var/lib/mysql command (execute the /var/lib/mysql-share command for dual devices) to change the ownership. Take the same action for the /var/log/mariadb directory.
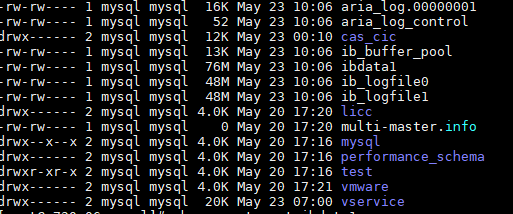
· The table creation failed due to insufficient space. For how to resolve this problem, contact Technical Support.
Response failure for viewing VM and storage pool information on the front-end Web interface
Symptom
The front-end Web interface gets stuck when you view information about VMs and storage pools, and you cannot perform further operations.
Impact
The front-end Web interface gets stuck, and you cannot perform management operations correctly.
Analysis
· Certain tasks such as VM destroying, backup, and snapshot have not been completed.
· The storage IO is under high pressure.
· A storage fault occurs, for example, fence umount.
Solution
· Waiting for the task to complete. View the task progress on the front-end console.
· Verify that the storage pool in the system backend is operating correctly, and troubleshoot any storage issues.
Failure of a host to identify the USB device inserted into the CVK host
Symptom
After you insert the USB device into the host, you cannot find the device when adding a USB device to the VM in the management platform.
Impact
The USB device cannot be used.
Analysis
· The USB device is not inserted into the correct slot.
· The USB device is faulty.
Solution
Change the USB device slot. You can use the lsusb –t command to check whether the USB device is inserted into the correct slot. For example:
root@cvk-163:~# lsusb -t
/: Bus 04.Port 1: Dev 1, Class=root_hub, Driver=xhci_hcd/6p, 5000M
/: Bus 03.Port 1: Dev 1, Class=root_hub, Driver=xhci_hcd/15p, 480M
/: Bus 02.Port 1: Dev 1, Class=root_hub, Driver=ehci-pci/2p, 480M
|__ Port 1: Dev 2, If 0, Class=hub, Driver=hub/8p, 480M
/: Bus 01.Port 1: Dev 1, Class=root_hub, Driver=ehci-pci/2p, 480M
|__ Port 1: Dev 2, If 0, Class=hub, Driver=hub/6p, 480M
In the return results of the command, UHCI represents USB1.1, EHCI represents USB2.0, and XHCI represents USB3.0. Typically, USB 1.1 supports up to 12 Mbps transmission rate, USB 2.0 supports up to 480 Mbps transmission rate, and USB 3.0 supports up to 5 Gbps transmission rate.
If the server supports multiple USB bus standards, after you add a USB 2.0 device to the server, a new USB device is added under the USB 2.0 (ehci-pci) bus. This indicates that the device is inserted into the correct slot.
If the device is still not recognized after the previous operations, execute the lsusb command before and after plugging and unplugging the USB device to check for any new devices. For example:
root@ CVK:~# lsusb
Bus 001 Device 001: ID 1d6b:0002 Linux Foundation 2.0 root hub
Bus 005 Device 001: ID 1d6b:0001 Linux Foundation 1.1 root hub
Bus 004 Device 001: ID 1d6b:0001 Linux Foundation 1.1 root hub
Bus 003 Device 001: ID 1d6b:0001 Linux Foundation 1.1 root hub
Bus 002 Device 001: ID 1d6b:0001 Linux Foundation 1.1 root hub
Bus 006 Device 002: ID 03f0:7029 Hewlett-Packard
Bus 006 Device 001: ID 1d6b:0001 Linux Foundation 1.1 root hub
If no new devices are displayed, the system cannot identify them. Change a USB device and try again.
Failure to enable HA for the cluster upon changing the system time
Symptom
When you set the time on a CVM host to more than 10 days in the past, HA fails to be enabled for the cluster, and the task console displays a message that HA process response timeout.
Impact
You cannot enable the cluster HA feature.
Analysis
The backend HA process failed to connect to the database. As a result, the HA process cannot start correctly. The log reports a message that SSL connection error: protocol version mismatch.
Solution
Set the host time to the current time.
Add the skip_ssl option to the file /etc/mysql/mysql.conf.d/mysqld.cnf.
Host NIC failure
Symptom
A NIC failure alarm occurs for the host.
Impact
User services are affected.
Analysis
Examine whether the NIC has been manually disabled, whether the link is disconnected, and whether the negotiation is normal. Check if any NIC-related error logs exist in syslog.
Solution
Based on the corresponding situation, try to restore the issue by enabling the NIC, resolving connection and negotiation issues, upgrading the NIC firmware, or replacing hardware components.
Host MCE fault alarm
Symptom
An MCE fault alarm occurs on the host. You can view errors or alarms in /var/log/mce.log file at the back end.
Impact
The host has experienced a hardware failure and requires immediate repair.
Analysis
The issue might be caused by hardware failures such as host server memory or MPU faults. You need to check the server hardware logs for any exceptions.
Solution
Migrate the VM to another host as soon as possible, isolate the host, and replace the faulty hardware.
Packet loss on an aggregate link
Symptom
At a specific deployment site, you can ping from the server (for example, 192.168.12.19) to a physical switch (for example, 192.168.12.254), but might fail to ping from the physical switch (192.168.12.254) to the server (192.168.12.19) occasionally.
Impact
Packet loss occurs in the user network, affecting the stability of the virtualization environment.
Analysis
The network diagram is as follows:
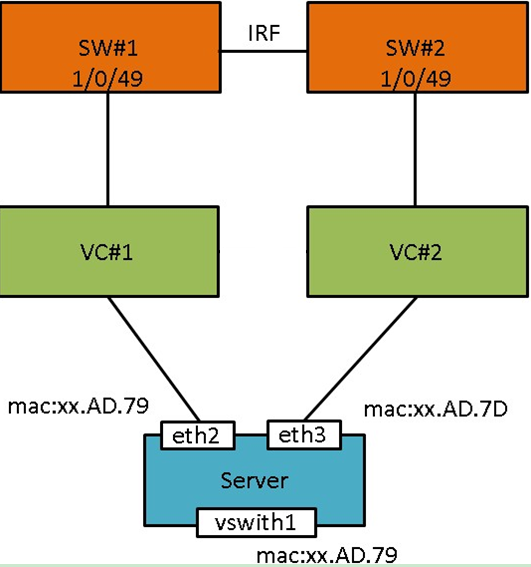
In this example, a UIS blade server is deployed at the site, with VC devices in the server chassis as network interconnect modules. The blade server's eth2 and eth3 are connected to VC#1 and VC#2, respectively. VC#1 and VC#2 are connected to switches SW#1 and SW#2, respectively. SW#1 and SW#2 form an IRF fabric.
Install the UIS system on the blade server, bind vSwitch1 to eth2 and eth3, and configure static link aggregation for load sharing. Both eth2 and eth3 have the LLDP feature enabled.
The IP address of vSwitch vswitch1 is 192.168.12.19 and its gateway address is 192.168.12.254 that is configured on a physical switch.
1. You can ping the switch (192.168.12.254) from the server (192.168.12.19), but might fail to ping the server (192.168.12.19) from the switch (192.168.12.254) occasionally.
2. Through further testing, you can see that when eth2 is the primary NIC, the CVK host (192.168.12.19) and the gateway (192.168.12.254) can communicate with each other. When the primary NIC is eth3, pinging the host from the gateway results in packet loss. Therefore, you only need to analyze the packet forwarding process when eth3 is used as the primary link.
¡ Packets from the CVK host (192.168.12.19) to the gateway (192.168.12.254) are forwarded along the path vswitch1-eth3-VC#2-SW#2.
¡ The MAC address FC:15:B4:1C:AD:79 of vswitch1 is recorded on the downlink port of VC#2 and the downlink port of SW#2.
¡ Packets from the gateway (192.168.12.254) to the CVK host (192.168.12.19) are forwarded based on the MAC address table of SW#2 and VC#2, which is the path SW#2-VC#2-eth3-vswitch1.
3. Use the tcpdump command to capture packets on NIC eth2 and save the packets.
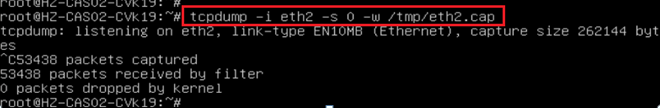
4. Save the packets to your local PC and analyze it with Wireshark. You can see that although NIC eth2 is a backup link, it continuously sends LLDP_multicast packets (LLDP is enabled on eth2). The packet information is as follows:
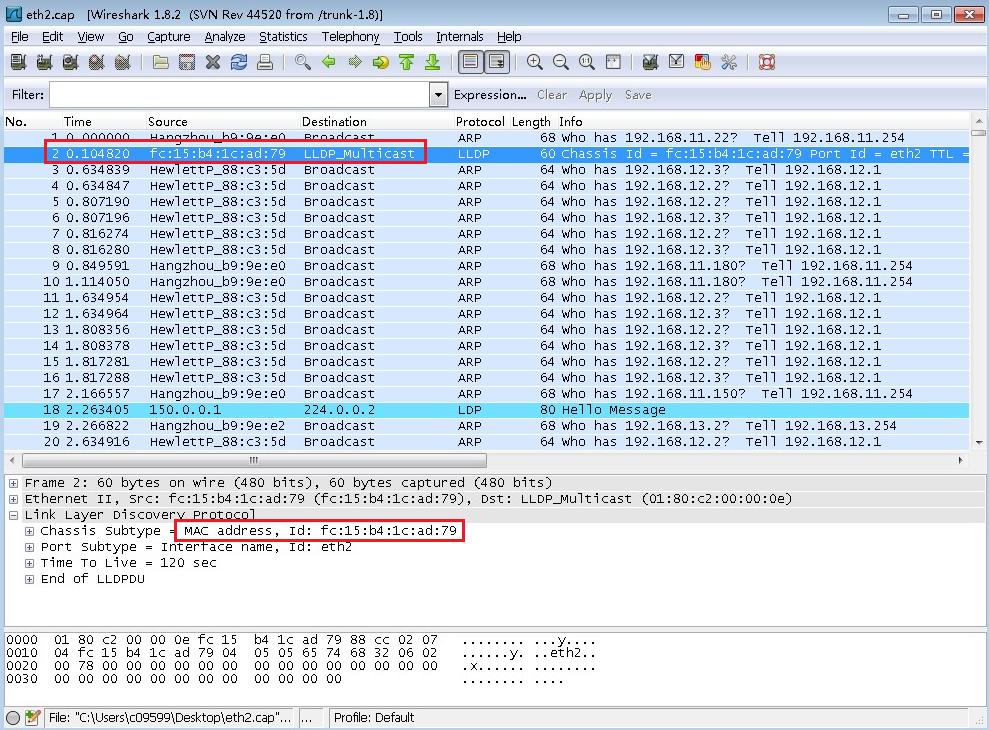
The MAC address for the LLDP_multicast packet is FC:15:B4:1C:AD:79.
5. When eth3 is the primary link, the MAC address of vSwitch vswitch1 (with MAC address FC:15:B4:1C:AD:79) must be learned by SW#2 and VC#2. However, NIC eth2 with the same MAC address sends LLDP_multicast periodically. This affects the MAC address table entries on VC#1, causing the MAC address FC:15:B4:1C:AD:79 to migrate to VC#1 and SW#1. As a result, the ping packets from the gateway to the host are forwarded along the path SW#1-VC#1-eth2. Because eth2 is in standby status and does not process packets, OVS discards the packets, resulting in a ping failure.
Solution
Disable LLDP on physical NICs.
Attacks from compromised host
Symptom
The host contains a virus that attempts to establish numerous connections externally, which can lead to significant network resource consumption and potentially result in network failure.
Impact
The service network of users is affected.
Analysis
Use tcpdump to capture packets and identify whether any abnormal traffic with the following characteristics exists in the environment:
· The traffic is used to initiate a DNS resolution request.
· The traffic is used to initiate a TCP SYN request, but typically it does not establish a connection.
· The destination IP addresses do not belong to the user environment. Instead, they belongs some data centers.
· The traffic volume is large.
Execute the netstat –atunp command to check for any abnormal processes attempting to establish network connections. An abnormal process might have the following characteristics:
· Connects to an external IP address, instead of the IP address in the user environment.
· The process name masquerades as a common process name such as cd, ls, echo, and sh.
· If the CVK cannot connect to the external network, the connection status might remain in SYN_SENT.
Execute the top -c command to check for any abnormal processes. An abnormal process might have the following characteristics:
· High CPU or memory usage.
· The process name masquerades as a common process name.
Check the /etc/crontab file for any abnormal scheduled tasks that have been added. In the current software version, certain scheduled tasks are available on the CVK. Any other scheduled tasks can be considered modified.
Solution
· Change the host password.
· Terminate the abnormal process and delete its executable file from the disk.
· Remove the abnormal tasks from /etc/crontab.
· Use professional antivirus software to scan and eliminate virus.
Host startup failure
Symptom
After the system hardware check is completed, an error message is displayed that No bootable device.
Impact
The host cannot start up correctly.
Analysis
· The server does not have an operating system installed, or the server lacks a bootable disk device.
· The server boot mode has changed.
· The RAID card is damaged or the RAID card driver is incompatible.
Solution
· Identify whether a disk exists or the disk is damaged. If the disk is damaged, contact the hardware vendor to repair the disk, and proceed with the system installation.
· If the server boot mode has changed, you need to reinstall the system.
· If the RAID card is damaged, contact the hardware vendor to repair the RAID card. If the RAID card driver is incompatible, contact Technical Support to resolve the issue.
System installation getting stuck, or no xconsole interface available after installation
Symptom
· During system installation, the process might get stuck or the system might crash.
· After installation, the xconsole interface is not available.
Impact
The system cannot be installed or used correctly.
Analysis
· The installation process is interrupted due to network issues.
· The USB drive format for installation is incorrect.
Solution
· Use Phytium CPU servers without the xsconsole interface.
· Use the Linux DD method to create a USB installation drive with the command format: dd if=/root/CAS-*.iso of=/dev/sdc bs=1M.
Slow disk alarm
Symptom
A slow disk alarm is displayed for the real-time alarm module on the management page.
Analysis
The hard drive mentioned in the slow disk alarm becomes faulty, resulting in slow read and write operations.
Fault location
If a hard drive is faulty, the I/O access speed might be slow, which can result in a slow disk alarm in the storage system. If the reason cannot be located, contact Technical Support for help.
Solution
Replace the faulty hard drive. For more information, contact Technical Support. After replacing the hard drive, if the slow disk alarm is cleared within 10 minutes, the fault is resolved. If the slow disk alarm is not automatically cleared within 10 minutes, manually acknowledge the alarm on the real-time alarm page of the storage system management page. For more information, see the online help of the product.
Collecting failure information
After you complete emergency response and recovery, collect failure information for troubleshooting or provide the information to H3C Support to locate and remove the failure.
Collecting log information from the back end
See H3C UIS HCI System Log Message Reference.
Collecting log files from the management platform
1. On the top navigation bar, click System, and then select Log Collection from the navigation pane.
2. Enter the log file size, select a time range, select the hosts for which the system collects logs, and then click Collect.
Figure 24 Collecting and downloading log files
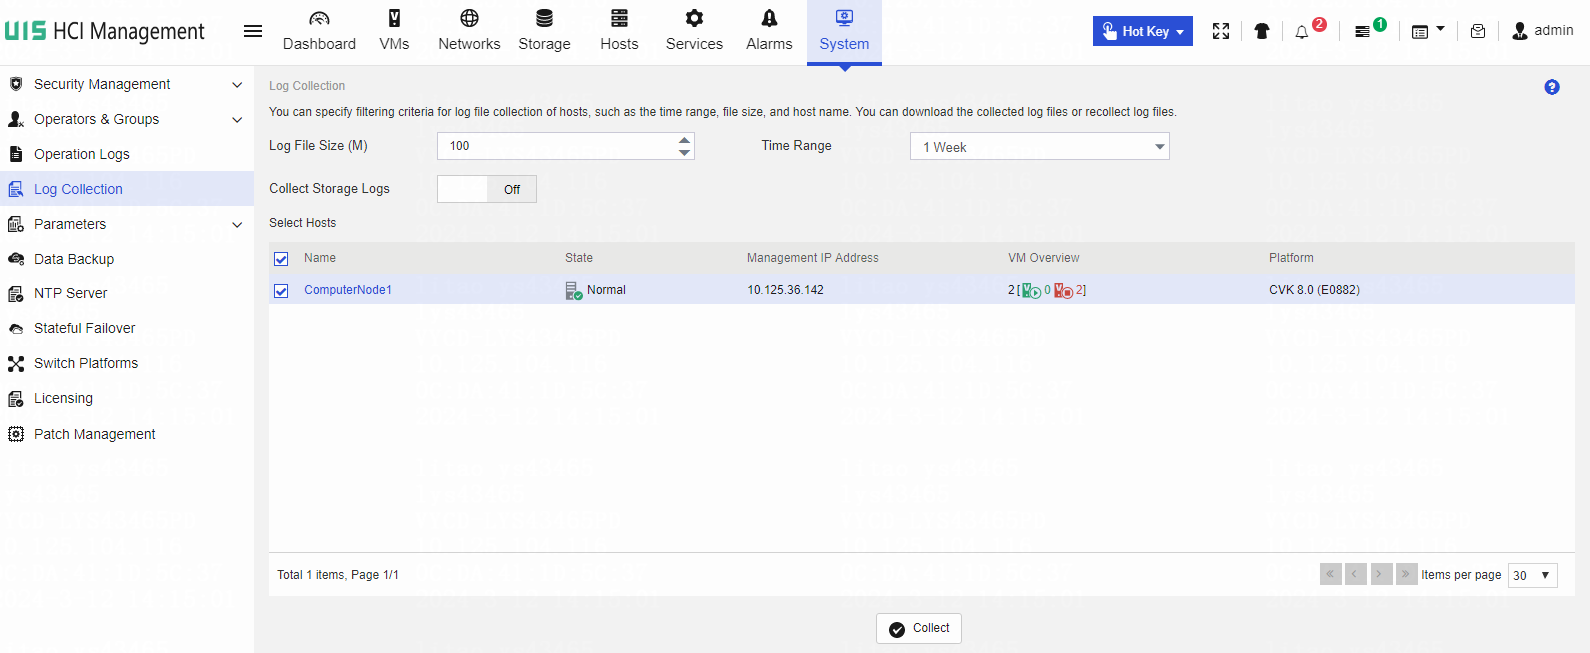
3. To download the log files, click Download. To collect logs again, click Recollect.
Viewing alarm information
1. On the top navigation bar, click Alarms.
2. From the navigation pane, select Alarm Management > Real-Time Alarms.
3. Click Filter.
4. Configure the filter criteria.
5. Click OK.
Figure 25 Viewing real-time alarm information

6. To export real-time alarms, click Export.
