
- Released At: 10-04-2025
- Page Views:
- Downloads:
- Table of Contents
- Related Documents
-
Maintenance Guide
Document version: 5W102-20250409
Copyright © 2025 New H3C Technologies Co., Ltd. All rights reserved.
No part of this manual may be reproduced or transmitted in any form or by any means without prior written consent of New H3C Technologies Co., Ltd.
Except for the trademarks of New H3C Technologies Co., Ltd., any trademarks that may be mentioned in this document are the property of their respective owners.
The information in this document is subject to change without notice.
System maintenance check on CAS
Checking the running status of CAS
Viewing the high-availability functions of the cluster
Viewing dynamic resource scheduling of a cluster
Viewing shared storage in a cluster
Viewing host performance monitoring
Verifying if CAS Tools are running correctly
Viewing the type of disks and NICs
Viewing performance monitoring of VMs
Log analysis and fault location
Introduction to the CAS module
Risks, restrictions, and guidelines
About disk backup disaster recovery
Commonly used commands and configuration
CVM backup process and service management information
CVM backup process and service management information
Configuring the heartbeat network for the shared file system
About the OVS command line tool
vNetwork configuration procedures
Software and software architecture for NTP
Software and configuration files
Main NTP configuration file ntp.conf
Using the restrict command for access control management
Using the server command to specify upper-stratum NTP servers
Introduction to CAS log collection
Typical scripts for issue location and analysis
Configuration cautions and guidelines
CAS configuration cautions and guidelines
Formatting a shared file system
Basic life cycle management for VMs
CAS installation and deployment
Hardware replacement for a CVK host
Replacing a CPU, memory, or disk
Changing, extending, updating, and unbinding licenses
Modifying the management IP address and host name
Flowchart for modifying the management IP and host name
Changing the physical interface bound to the management vSwitch
Changing the physical interface bound to the management vSwitch from the CAS Web interface
Changing the physical interface bound to the management vSwitch from the Xconsole interface
Adding a physical NIC to a CVK host
Modifying the CVK root password
Common issue analysis and troubleshooting method with logs
Backing up and restoring CVM configuration
Restoring the CVM configuration
Changing the default admin password
Common issue analysis and troubleshooting method with logs
Managing logs of a Windows operating system
Collecting logs of a Windows operating system
Viewing logs of a Windows operating system
Troubleshooting tools and utilities for CVK host issues
Installation being stuck at 21% for a long time
Cannot discover disks during system installation
Black screen or being stuck during system installation
System functions missing after installation
Analysis and detection of blocking issues in OCFS2
Troubleshooting network issues and capturing packets
A packet capture tool in Windows environment
A packet capture tool in Linux environment
Introduction to packet processing in CAS environment
Troubleshooting common stateful failover issues
Common inspection items for stateful failover
Common stateful failover issues
CVM login failure because of prolonged external storage error
A VM migration task gets stuck at 95% when you migrate a VM by changing the host and storage
AsiaInfo/360 compatibility issues
Checking the running status of AsiaInfo on the CAS system
Checking the running status of 360 on the CAS system (CAS 7.0 is incompatible with 360)
Common host and VM infection treatment
Storage link and multipath issues
Common VNC configuration issues
Common troubleshooting workflow
Common VNC configuration issues in the NAT environment
Configuration procedure in the single CVM environment
Handling common issues with plug-ins
Enabling CAStools and qemu-ga debug logging
Full initialization and quick initialization
Partially successful VM deployment (error code: 7501)
CAStools (qemu-ga) installation and upgrade failure
VM and CAS communication failure
Performance monitoring data anomaly
Windows CAStools (qemu-ga) domain joining issues
Anomaly on a Windows VM triggers a dump
VM initialization fails after template deployment
Failure to obtain MAC address information after login to the CAS management interface
Other common issues and operations related with CASTools
Troubleshooting common SRM issues
Overview
H3C Cloud Automation System (CAS) is a resource management platform developed by H3C for building cloud computing infrastructure. H3C CAS provides industry-leading virtualization management solutions for cloud computing infrastructure in data centers. It allows centralized management and control of the cloud computing environment through a unified management interface. Administrators can easily manage all hosts and VMs in the data center, improving control efficiency and simplifying daily work. Additionally, it reduces complexity and management costs in the IT environment.
H3C CAS server virtualization products are developed based on the open-source KVM kernel virtualization technology. The kernel performance and stability are optimized for telecom-grade high-performance forwarding, high-availability, and virtualization kernel security and management. With H3C's network expertise, the products offer overlay network solutions for virtual converged framework, innovative solutions such as cloud rainbow, Dynamic Resource eXtension (DRX), and GPU pool, and SRM for disaster recovery. The products aim to provide customers with stable, secure, easy-to-use, open, and high-performance virtualization management products and solutions.
H3C CAS products have been used across various industries in a large scale due to convenient operation, continuous stability of virtualization technology, and sustained improvement of performance. The CAS virtualization scenario utilizes storage, servers, and networks to provide customers with comprehensive virtualization solutions. As the number of application sites increases, the demand is increasing for a common maintenance guide to facilitate daily operations, common configurations, and anomaly processing.
This document explains principles, common issues and solutions, command tools, and configuration risks to better support maintenance. Continuous optimization and supplementation are required to provide accurate guidance for prompt fault resolution and smooth business operation.
CAS application scenarios
The CAS cloud computing management platform is a software suite launched by H3C for building cloud computing solutions. For customers who want to achieve centralized unified management of data centers, integrating existing IT facilities with virtualization and cloud operation management solutions is their best choice. It can perfectly cover the basic application areas of virtualization and cloud computing.
· Facility integration for servers
· Centralized and unified management of computing, network, and storage resources
· High availability and dynamic resource scheduling ensure continuous operation of data center services
· Fast migration and backup of VMs
· Multi-tenant security isolation
· User self-service portal
· Cloud service workflow
· Ensured cloud interoperability through open APIs
Product system structure
CAS contains the following components:
· Cloud Virtualization Kernel (CVK)
The virtualization kernel software that runs between the underlying facility layer and the upper customer operating system layer. CVK is used to shield the differences between underlying heterogeneous hardware and eliminate the OS's dependency on hardware and drivers. It enhances hardware compatibility, high availability, scalability, performance, and reliability in virtualization environments.
· Cloud Virtualization Manager (CVM)
Aims to implement software virtualization management for hardware resources such as computing, networking, and storage within the data center and provide automated services to upper-layer applications. The business scope includes virtual computing, virtual networking, virtual storage, high availability (HA), dynamic resource scheduling (DRS), VM disaster recovery and backup, VM template management, cluster file system, and virtual switch policy.
· Cloud Intelligence Center (CIC)
Contains a series of cloud-based modules. It integrates infrastructure resources, including computing, storage, and networking, and related policies into a resource pool, and allows users to consume resources on-demand to construct a secure, multi-tenant hybrid cloud. The business scope includes: organizations (virtual data centers), multi-tenant data and service security, cloud service workflows, self-service portal, and OpenStack-compatible REST APIs.
System maintenance check on CAS
To ensure stable operation of the CAS system, maintenance work is required. The main functions include viewing alarms, operation logs, clusters, hosts, VMs, packages, licenses, and logs.
Checking the running status of CAS
Log in to the management interface of CAS and check the overall system's health and running state. You must clear alarms and resolve system issues in time to maintain the correct operation of the system.
Checking alarms
After logging into CAS management homepage, the top right corner of the page displays the CAS system's alarm indicators, which include Critical, Major, Minor, and Info indications.
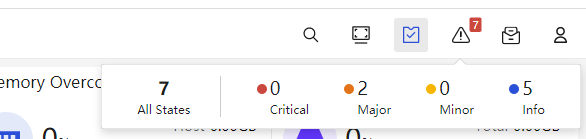
If the critical and major indication lights display an alarm message, it indicates that a system error is present. You must quickly identify and solve the problem.
To view real-time alarms, click the corresponding alarm indicator, or access Alarm Management > Alarms.
Troubleshoot problems based on the alarm source, type, alarm message, and alarm time on the real-time alarm page.
Log in to the CAS management console, select System, and view the administrator's operation logs on the Operation Logs page.
The operation log section allows viewing, downloading, and clearing operations. The operations have no risk to running services.
Viewing clusters
Viewing the high-availability functions of the cluster
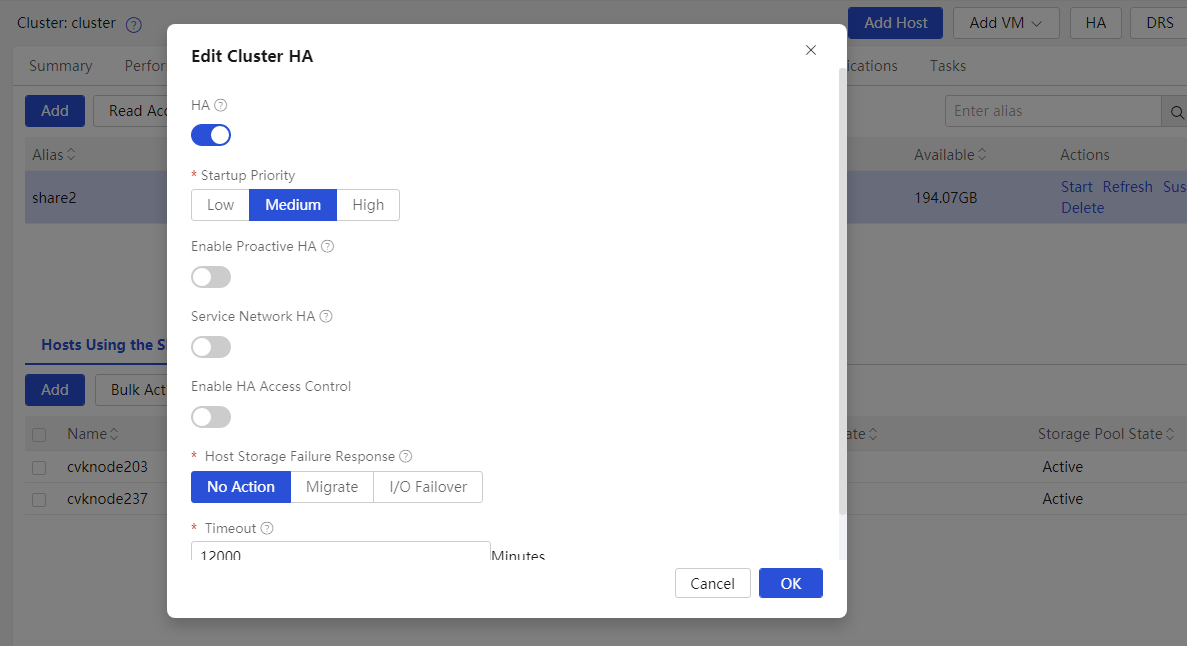
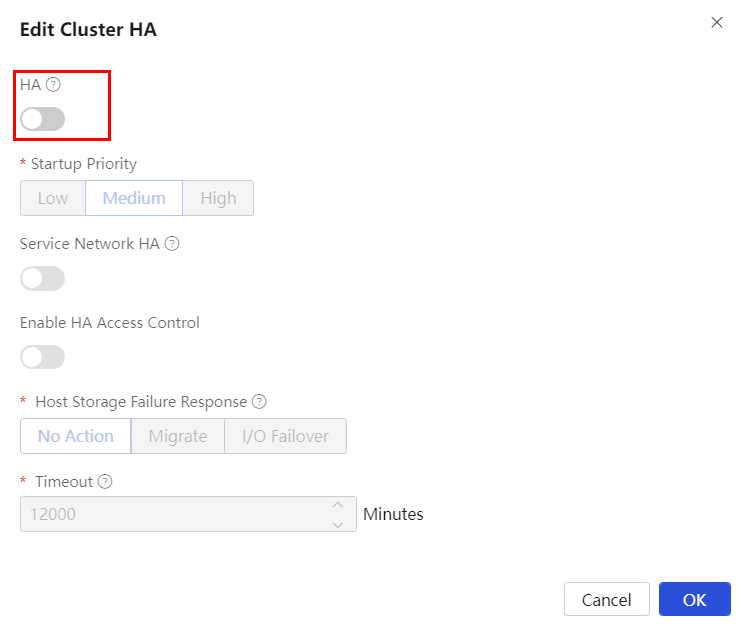
High availability (HA) allows the system to automatically migrate VMs from a faulty CVK to another in the cluster, minimizing downtime and out-of-service time.
Before configuring the service, validate if the cluster is enabled with HA. Without HA, VMs on a faulty CVK host cannot be migrated to another CVK host in the same cluster.
Select the clusters to be managed, click HA, and confirm whether to enable HA.
Viewing dynamic resource scheduling of a cluster
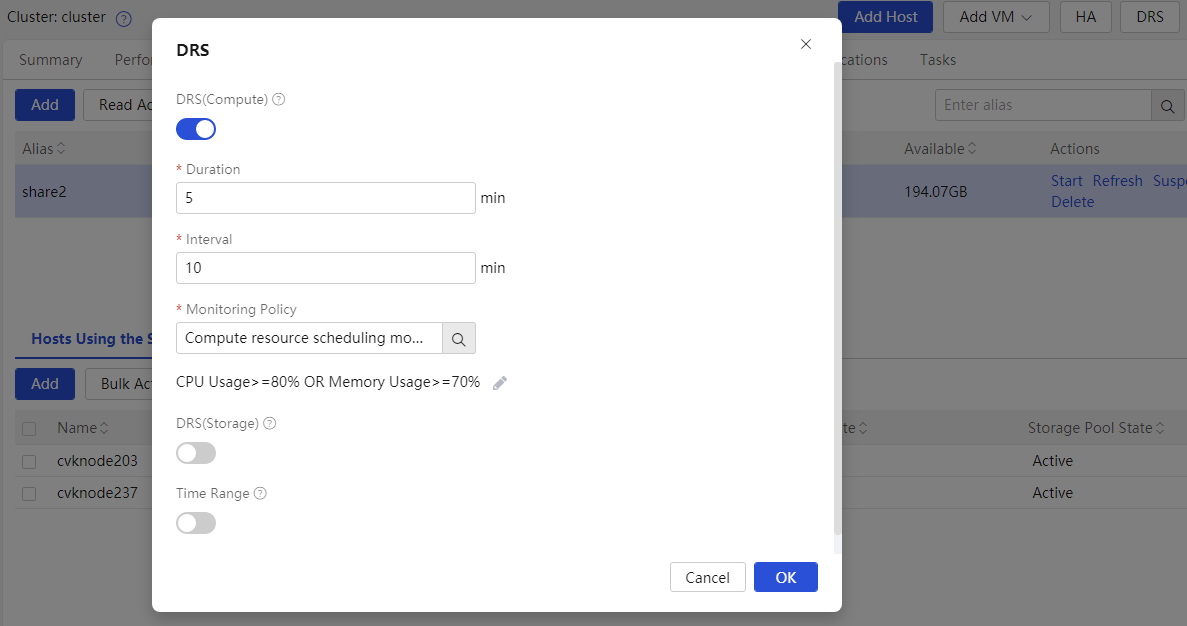
Validate if the cluster is enabled with computing resource DRS. If the feature is disabled, when a CVK host is overloaded in the cluster, VMs on the host cannot be migrated to other idle CVK hosts in the same cluster.
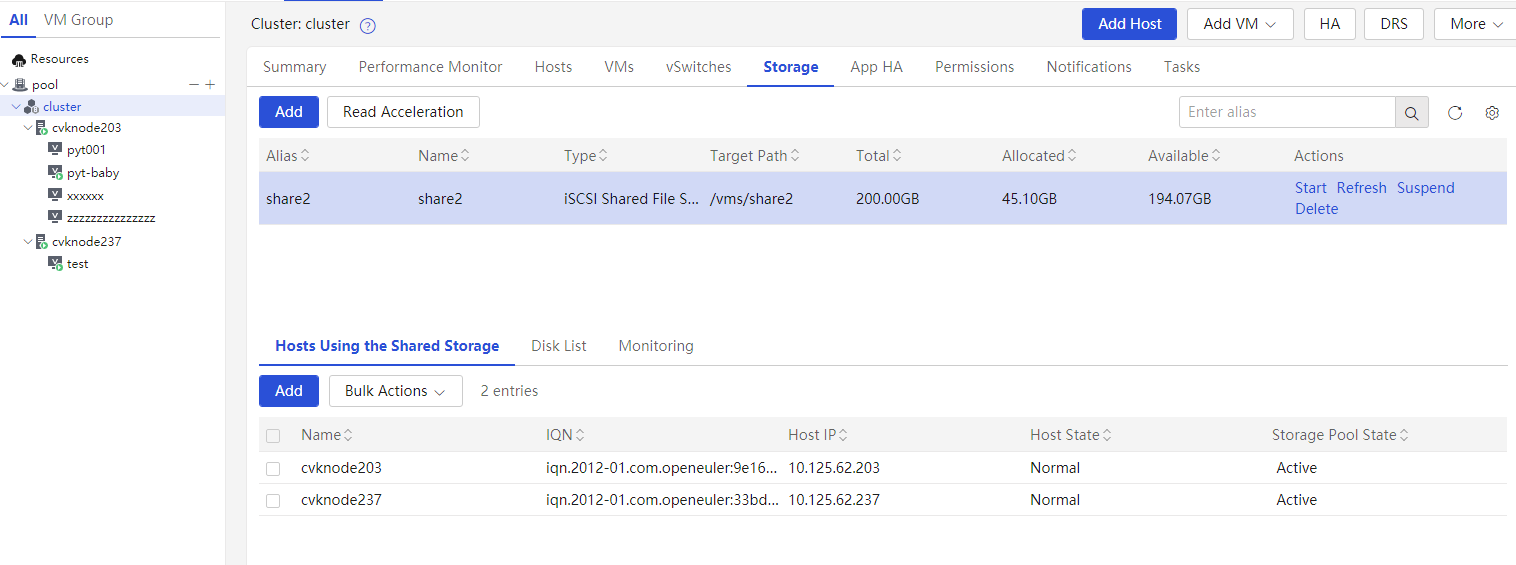
Viewing shared storage in a cluster
Verify if the shared storage on the Storage page of the cluster is being used by all hosts in the cluster. In a cluster, isolate mounted storage as a best practice. Use different LUNs for different clusters to improve security and accessibility.
Viewing hosts
Viewing host status
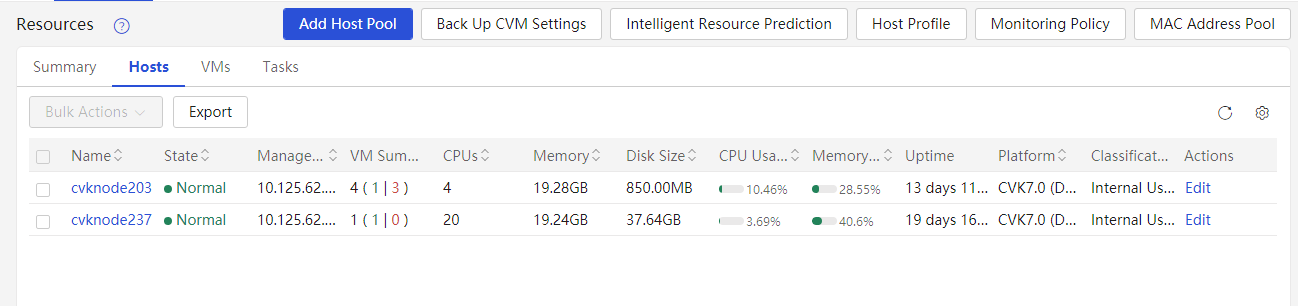
From the left navigation pane, select Resources. Click the Hosts tab, view all the managed hosts, and verify if abnormal hosts exist.
Check the CPU and memory usage of each host and make sure they are normal. Extra attention is required if the usage exceeds 80%.
Viewing the host run time
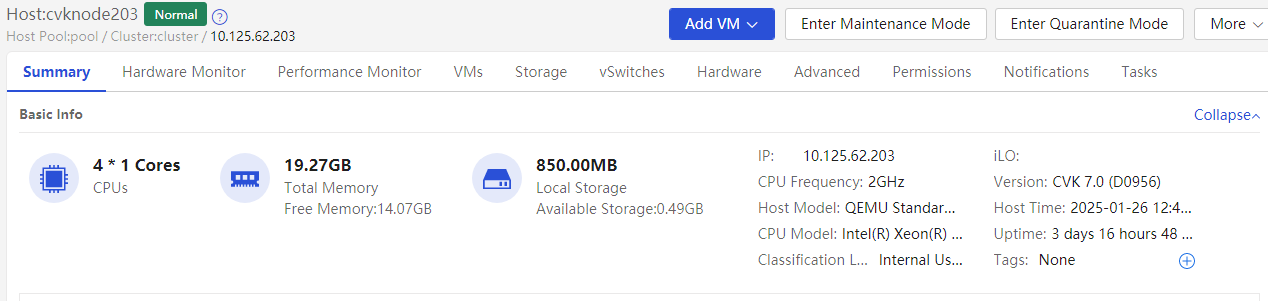
You can view the detailed profile of the host on the Summary page of the CVK host. By checking the run time, you can confirm whether the host has been restarted recently. You can also use the Uptime command at the CVK backend to view the run time.
Viewing host performance monitoring
You can view the CPU usage, memory usage, I/O throughput, network throughput, disk usage, and partition usage information of a host on the Performance Monitor page of a CVK host.
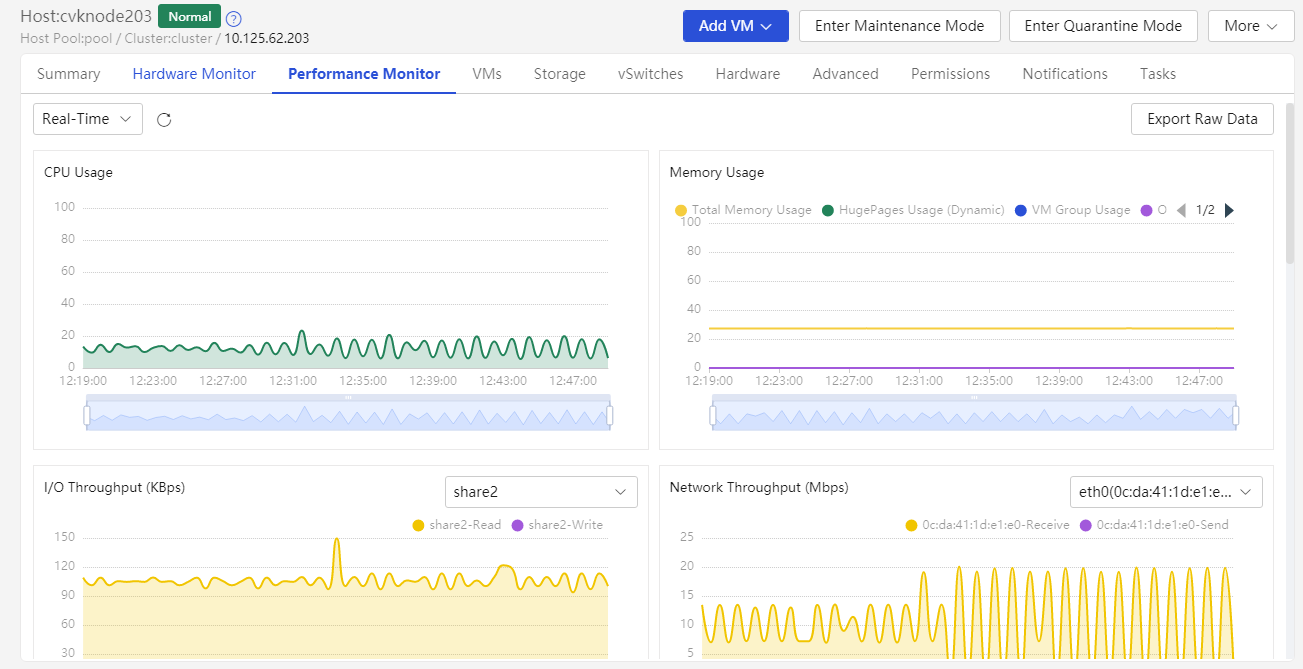
1. View the CPU usage of a host.
To view CPU usage information for a longer time-range, access the Performance Monitor page, click the ... button in the CPU Usage section.
You can also use the top command at the CVK backend to view the CPU usage in real time.
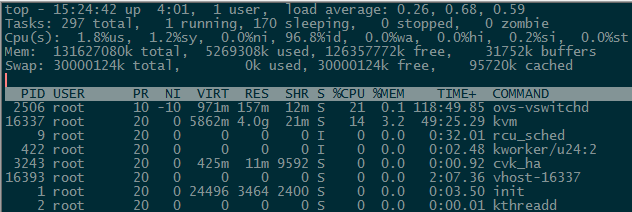
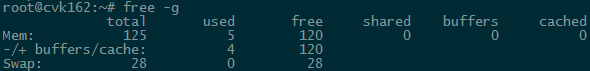
2. View the memory usage of a host.
To view memory usage information for a longer time-range, access the Performance Monitor page, click the ... button in the Memory Usage section.
You can also use the free command at the CVK backend to monitor the real-time memory usage. High usage of the Swap partition severely impacts the host performance and can result in automatic shutdown of VMs.
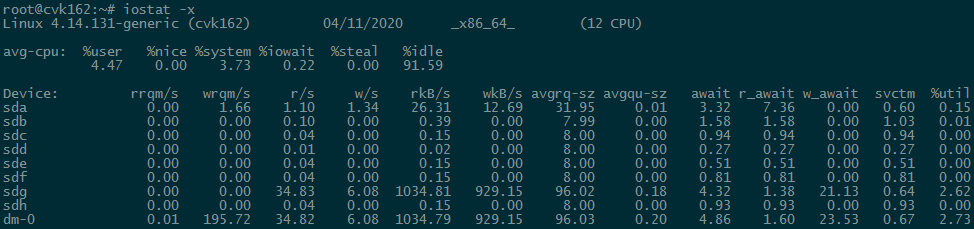
3. Check the I/O throughput of a host.
On the Performance Monitor page, click I/O Throughput to view host disk I/O information. Click the ... button to view I/O throughput information over a longer time range.
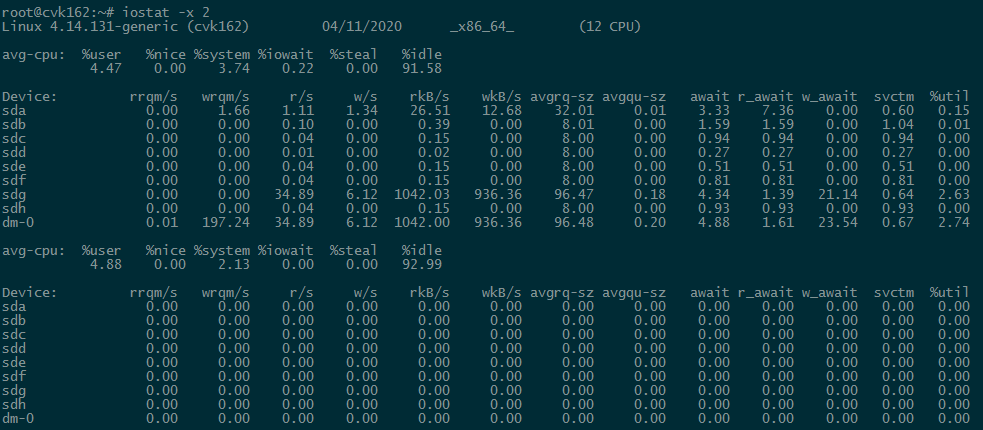
You can also use the iostat -x command at the CVK backend to view disk I/O information.
You can use the iostat -x 2 command at the backend to automatically refresh and calculate the results every 2 seconds.
4. View the network throughput of the host.
Click the ... button in the Network Throughput section on the Performance Monitor page to view network throughput information of each physical NIC over a longer time range.
View the disk usage of a host.
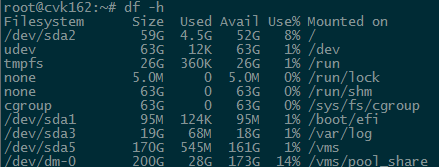
The Disk Request section on the Performance Monitor page presents information on disk usage of a host.
View the occupancy rate of host partitions.
The Partitions section on the Performance Monitor page displays the host's partition occupancy information.
You can use the df -h command at the CVK backend to check the partition occupancy information in real time.
Viewing virtual switches
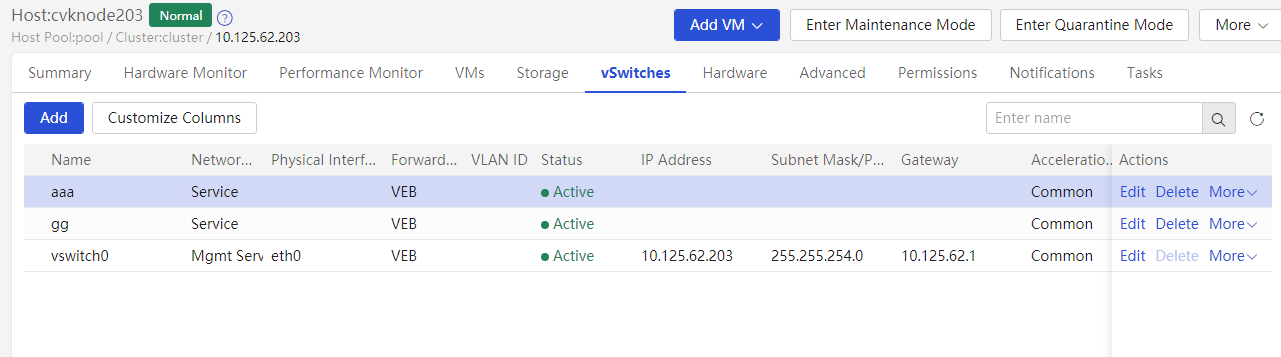
Check if the virtual switch names are consistent among hosts in the cluster.
Check the status of each virtual switch on the vSwitches page of the host to make sure they are active. Verify that only one gateway is configured among all virtual switches on the host.
Viewing physical NICs
Check the physical NICs of the host on the Physical NICs page. Available information includes rate, working mode, and activity status.
An anomaly can affect the performance of a virtual switch.
|
|
CAUTION: When a blade server uses VC, you must disable LLDP to avoid communication issues on the blade server and VMs on the server. |

Viewing VMs
Verifying if CAS Tools are running correctly
Typically, you can check the running state of the CAS Tools through the VM summary page of the CVM interface. Available states include running and abnormal. Abnormal state may be caused by not running or pending upgrade.
You can also determine the CAS Tools' manual running state through VMs.
· Linux VM:
For a Linux VM, you can check the state of CAS Tools at the backend by viewing information about the qemu-ga service.
For example, in an Ubuntu system:
root@cvknode-wj:~# service qemu-ga status
* qemu-ga is running
· Windows VM:
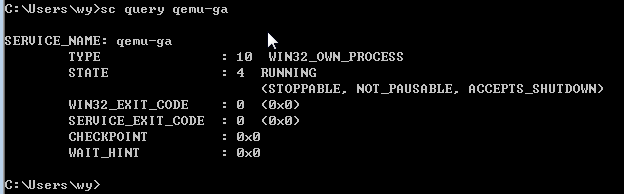
For a Windows VM, you can check the corresponding process in Device Manager to identify the state of CAS Tools. The process name is qemu-ga.
For example, in the Windows 7 system:

You can also use cmd to check the state:
Viewing the type of disks and NICs
Disk types
CAS supports the following types of disks:
· High-speed disk: virtio disk
IDE disk
High-speed SCSI disk: virtio SCSI disk
You can identify the disk type on the Modify VM > Disk page of the CVM interface.
The XML tags for the three types of disks in the background are also different:
· High-speed disk
<devices>
<emulator>/usr/bin/kvm</emulator>
<disk type='file' device='disk'>
<driver name='qemu' type='qcow2' cache='directsync' io='native'/>
<source file='/vms/images/win7-wj'/>
<backingStore/>
<target dev='vda' bus='virtio'/>
<alias name='virtio-disk0'/>
<address type='pci' domain='0x0000' bus='0x00' slot='0x08' function='0x0'/>
</disk>
· IDE disk
<disk type='file' device='disk'>
<driver name='qemu' type='qcow2' cache='directsync' io='native'/>
<source file='/vms/images/jj'/>
<backingStore/>
<target dev='hdb' bus='ide'/>
<alias name='ide0-0-1'/>
<address type='drive' controller='0' bus='0' target='0' unit='1'/>
</disk>
· High-speed SCSI disk
<disk type='file' device='disk'>
<driver name='qemu' type='qcow2' cache='directsync' io='native' discard='unmap'/>
<source file='/vms/images/gg'/>
<backingStore/>
<target dev='sda' bus='scsi'/>
<alias name='scsi2-0-0-0'/>
<address type='drive' controller='2' bus='0' target='0' unit='0'/>
</disk>
NIC types
CAS provides the following types of NICs:
· Common NIC
High-speed NIC
Intel e1000 NIC
SR-IOV passthrough NIC
For SR-IOV NICs, VMs display them as PCIe devices.
You can also use the VM XML to identify NIC types:
· Common NIC
<interface type='bridge'>
<mac address='0c:da:41:1d:41:6c'/>
<source bridge='vswitch0'/>
<vlan>
<tag id='1'/>
</vlan>
<virtualport type='openvswitch'>
<parameters interfaceid='2738d0d4-4133-4f4d-a187-5bbf7cddf9fd'/>
</virtualport>
<target dev='vnet6'/>
<model type='rtl8139'/>
<priority type='low'/>
<mtu size='1500'/>
<alias name='net1'/>
<address type='pci' domain='0x0000' bus='0x00' slot='0x0c' function='0x0'/>
</interface>
· High-speed NIC
<interface type='bridge'>
<mac address='0c:da:41:1d:33:b7'/>
<source bridge='vswitch0'/>
<vlan>
<tag id='1'/>
</vlan>
<virtualport type='openvswitch'>
<parameters interfaceid='0f40ef32-3e05-41ee-b68d-1e0ce1f5ca18'/>
</virtualport>
<target dev='vnet5'/>
<model type='virtio'/>
<driver name='vhost'/>
<priority type='low'/>
<alias name='net0'/>
<address type='pci' domain='0x0000' bus='0x00' slot='0x03' function='0x0'/>
</interface>
· E1000 NIC
</interface>
<interface type='bridge'>
<mac address='0c:da:41:1d:03:6e'/>
<source bridge='vswitch0'/>
<vlan>
<tag id='1'/>
</vlan>
<virtualport type='openvswitch'>
<parameters interfaceid='3739afd5-d624-476f-a653-f1d1e0ee3f2c'/>
</virtualport>
<target dev='vnet7'/>
<model type='e1000'/>
<priority type='low'/>
<mtu size='1500'/>
<alias name='net2'/>
<address type='pci' domain='0x0000' bus='0x00' slot='0x0d' function='0x0'/>
</interface>
Viewing performance monitoring of VMs
You can easily view the performance monitoring of a VM on the VM_name > Performance Monitor page of the CVM interface.
To obtain information about a single VM, use the qemu-agent-command command at the backend.
Command format:
virsh qemu-agent-command vm_name '{"execute":"guest-statistic"}'
Example:
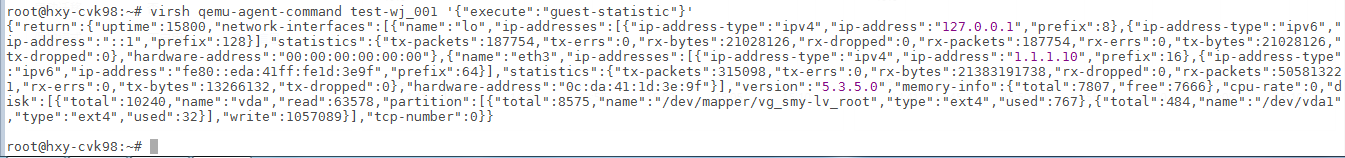
The command can obtain performance data reported by CAS Tools. To use this command, make sure CAS Tools is in running state on the VM.
Log analysis and fault location
Log troubleshooting for CAS Tools
For the running status of CAS Tools, the following parts must be focused on:
1. Check if the VM system is in normal state. For example, if the system can be pinged or accessed through SSH, if the Windows VM can be accessed remotely through mstsc, and if the console can be opened.
2. To troubleshoot the CAS Tools log when the system is operating correctly, access the /var/log directory to view the qemu-ga.log file in a Linux system, and access the installation directory of CAS Tools in a Windows system.
Typical problems:
· CAS Tools is not running
Two main causes result in this issue:
¡ An anomaly occurred in the qemu-ga within the VM.
¡ An anomaly occurred in the communication channel between the VM and CAS.
· View the version of qemu-ga.
In Linux: qemu-ga --version
In Windows, right-click qemu-ga.exe and click Properties. The file version displayed on the details tab represents the version number.
· Methods to enable debug logging for CAS Tools and qemu-ga:
¡ CAS Tools:
Modify /opt/bin/castools.conf
[handler_LogHandler]
class=FileHandler
level=DEBUG
formatter=LogFormatter
args=('/var/log/castools.log',)
¡ qemu-ga:
Linux: Modify /etc/qemu-ga/qemu-ga.conf to remove # in #verbose=true.
Windows: Change the access of the qemu-ga.conf file in the installation directory in the same way as in Linux
· Open-source qemu-ga issue:
Some Linux distributions have a pre-installed open-source qemu-ga program that can cause issues when running together with CAS qemu-ga. You must remove the pre-installed qemu-ga. To verify if the current qemu-ga is the open-source version or CAS version, use the qemu-ga --version command.
Performance data
You can refer to the relevant content of casserver. If anomalies exist in the performance data of specific VMs, you can use the qemu-agent-command command to verify if the collected data is normal.
Restrictions and guidelines
The function operation does not have risks.
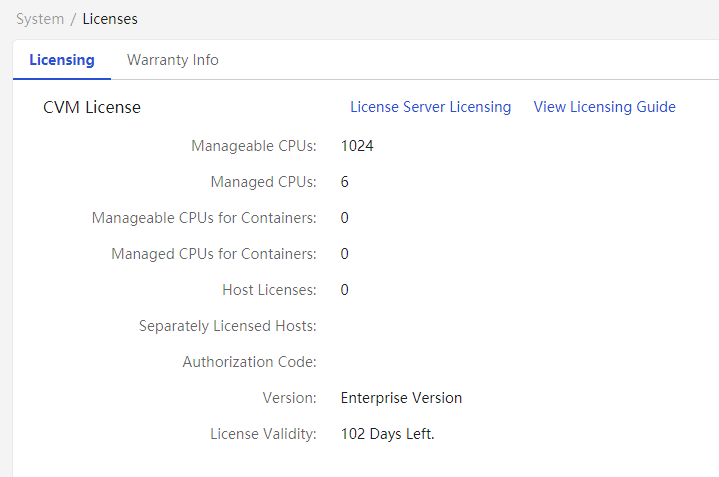
Viewing licenses
You can manage license configurations on the System > Licenses page.
The system mainly contains the following parts: local authorization, disk backup and disaster recovery, and heterogeneous platform migration.
You must use formal licenses for formal deployment. Temporary licenses can be used for testing or temporary deployment. Temporary licenses have an expiration date and may affect normal usage if expired. Make sure to update temporary licenses in advance to avoid license expiration.
The following figure shows the license interface.
Introduction to the CAS module
CAS is installed with a Linux operating system that contains various modules for implementing VMs. Each module is a self-contained system that is interrelated to form a unified virtualization management and implementation platform.
CAS mainly includes frontend configuration, calculation, storage, and network modules, as well as related scripts.
This section introduces the basic principles, common commands, and positioning methods of each module, which can be analyzed and referenced during problem processing.
Frontend configuration
The frontend includes the configuration interface of CVM/CIC, administrator operations, and management functions to implement virtualization. It mainly includes Tomcat and casserver.
Tomcat
Tomcat process description and service management
service tomcat8 restart | start | status | stop
Commands commonly used for troubleshooting
The following commands are applicable to both CVM and casserver components. In case of any issues, you can use the commands to obtain necessary information for analysis and feedback in a timely manner.
· Jstack: Jstack can be used to obtain information about Java stack and native stack for running Java programs.
Command format: jstack -l <pid> > <dstFileName>
· Jmap: Jmap can be used to obtain detailed information about memory allocation for running Java programs. For example, the number and size of instances.
Command format: jmap -dump:format=b,file=<destFileName, e.g. heap.bin> <pid>
· Jstat: You can observe information related to classloader, compiler, and gc. You can monitor resources and performance in real time.
Command format: jstat –gcutil <pid> <interval, unit: ms>
Log analysis and fault location
Log directory: /var/log/tomcat8/
· Catalina.out: Records CVM boot logs. If CVM cannot start up, you can view the logs.
· Cas.log: Records the internal operation logs of CVM. If the Web interface prompts errors, you can view the logs.
· hs_err_pid.log: Records Tomcat service anomalies, such as system crash.
· localhost_access_log: Records external requests to CVM, including interface requests and external interface requests, such as CVM interface calling by a plugin.
· jstack generation logs: Used to view specific stacks that may be stuck or blocked when interface tasks are not completed for a long time.
· jmap generation logs: The eclipse MemoryAnalyzer tool is required to resolve the logs. Typically, the logs are collected and then directly provided to the R&D team.
To view cas.log and jstack logs, fuzzy search based on interface services is supported. For example, to filter VM startup logs, you can use startDomain.
Restrictions and guidelines
As a best practice, do not execute Jmap when the environment management service is busy or the environmental pressure is high. You can use other commands if necessary to collect information.
Casserver backend processes
Casserver process description and service management
service casserver restart | start | status | stop
Commands commonly used for troubleshooting
Same as Tomcat.
Log analysis and fault location
Log directory: /var/lib/casserver/logs
· standardServer_bootstrap.log: Records casserver boot logs. If CVM cannot start up, you can view the logs.
· casserver.log: Records casserver internal running logs.
· jstack and jmap: Same as the Tomcat module.
Mysql
Mysql process description and service management
service mysql restart | start | status | stop
Access mysql, and use mysql –uroot –p <database, vservice by default for CAS>. As a best practice, do not include passwords in the command lines to avoid password recording in system logs.
Commands commonly used for troubleshooting
Refer to the Mysql repair document for repairing the Mysql environment.
Log analysis and fault location
Log directory: /var/log/mysql
Error.log: Record mysql-related errors. If the system cannot start up by using the start command, you can view the logs.
Performance monitoring
Performance monitoring description
The performance monitoring tab under the homepage of clusters, hosts, and VMs displays performance monitoring information for the corresponding clusters, hosts, or VMs. Performance monitoring of clusters displays CPU usage, memory usage, I/O throughput statistics, disk requests, and shared file system usage.
Performance monitoring of hosts displays CPU usage, memory usage, I/O throughput, network throughput, total number of network packets, number of lost network packets, disk requests, disk I/O latency, disk usage, and partition occupancy.
Performance monitoring of VMs includes CPU usage, memory usage, I/O throughput, network throughput, disk I/O latency, disk requests, number of connections, CPU usage, disk usage, and partition occupancy.
The chart type collects data in the past half hour. You can query historical performance data for host and VM performance data.
Commands commonly used for troubleshooting
· View if the casserver service is running: service casserver status
· Verify if a HA module is connected to casserver: netstat –anp|grep 9120
· View the running condition of the performance data report service: service cas_mon status
· Dump memory data: jmap -dump:format=b,file=e.bin <pid>
Log analysis and fault location
First, determine if the hosts or VMs are in running state. VMs and hosts that are not running have no performance data. Performance data issues can be divided into the follow types:
· Issues caused by MySQL database errors.
· Issues caused by casserver errors.
· Issues caused by errors of the performance data report service cas_mon.
MySQL database issues can be disregarded because when MySQL encounters a problem, it will first affect other functions.
Casserver-specific issues mainly manifest in two ways: The entire service process has crashed or the service process is still running but cannot provide functionality as expected. For the issue of a stopped Cassserver process, in most cases it is caused by OutOfMemory exceptions due to excessive memory usage or another reason that leads to the shutdown of the Cassserver service. If the process is still running but cannot provide functionality, it may be caused by insufficient system resources because too many pipes are triggered and consumes a large number of FDs.
Location process:
1. Verify if the mysql service is operating correctly. If the service is not operating correctly, troubleshoot mysql issues.
2. Log in to MySQL, check the corresponding data table, and verify if data for the recent time exist. If data for the recent time exists, troubleshoot Tomcat and locate CAS engineering.
3. Verify if the casserver service is running correctly. If it is not running, collect logs for analysis. (Logs in the /var/log/ and /var/lib/casserver/logs/ directories)
4. If casserver is running, verify if related error logs exist in /var/lib/casserver/logs/casserver.log. If error logs exist, analyze the cause based on the error information provided. If no error logs exist, verify if cas_mon has not reported any errors or if it has reported errors but the reported errors have not been processed by cassserver. You can use jstack to examine for any blocking threads. You can use jmap to export the memory mirror and analyze if data is not immediately written to the database after the data are received.
5. To verify if a cas_mon error exists, use netstat to examine if socket connections exist between cas_mon and cassserver. If no connection exists, perform cas_mon issue analysis. If such connections exist, use tcpdump to capture packets. Verify if relevant data packets exist. If such packets exist, analyze casserver. If no relevant data packets exist, it can be determined that the issue is caused by cas_mon errors. Analyze cas_mon.
6. Analyze cas_mon and verify if the service is running correctly. If the service is not running, review the /var/log/cas_ha/cas_mon.log file and Linux system logs to analyze why the service stopped. If the service is running, review the /var/log/cas_ha/cas_mon.log file for clues to the problem.
Restrictions and guidelines
The performance monitoring function only provides data display, and does not provide any risky operation interface. No operational risk exists.
Configuring SRM
About SRM
Disaster recovery management helps system administrators configure disaster recovery settings for protected and recovery sites. When the protected site or its production servers stop operation because of disaster or deliberate destruction, the recovery site takes over to ensure service continuity. A system administrator can set up disaster recovery protected and recovery sites, protection groups and resource mappings, and create recovery policies. Disaster recovery management supports storage replication and disk backup for disaster recovery.
Storage replication disaster recovery depends on server support for storage replication or storage replication adapter (SRAs). To use disaster recovery, first configure a protected site and a recovery site. If the storage servers support SRAs, configure the storage arrays. Then, map resources for the protection group and create a recovery plan. You can execute a recovery plan to test and restore functions. Recovery plan test is manually started and finished. It is used to verify site configuration, protection group, and recovery plan configuration. Recovery plan test does not affect VM business data. Recovery operations include scheduled recovery, failure recovery, and reverse recovery. Scheduled recovery and reverse recovery can be used in combination. Failure recovery and reverse recovery can be used in combination. Scheduled recovery restores running VM business at the recovery site. Failure recovery restores faulty VM business at the recovery site. Reverse recovery restores the VMs that are already running at the recovery site at the protected site. During the reverse recovery process, new data generated during the recovery site operation will also be restored on the VMs created at the protected site.
Troubleshooting commands
To view the CAS log, use the vi /var/log/tomcat8/cas.log command.
Troubleshooting
A VM cannot be allocated to a storage replication group
Verify that the following requirements are met:
1. The VM does not use resources that are bound to the host resources (hostdev), such as USB, CPU (CPUTune), NUMA, or optical drive or floppy drive using host volumes, or the resources are in an intelligent resource scheduling pool.
2. The storage used by the VM is among the shared storage resources of the protection group. For a multi-level storage resource, make sure each level is among those resources.
3. The virtual switch and port profile used by the VM is among the virtual switches and port profiles of the protection group. If the VM has multiple NICs, verify that every NIC meets this requirement.
4. The VM is not a DRX resource.
5. The recovery site does not have a VM with the same name as the one being recovered. To view VM names, execute the virsh list --all command or check the TBL_DOMAIN.DOMAIN_NAME field in the database.
6. The volume file used by the protected VM exists.
7. The VM's port profile exists in the /etc/libvirt/qemu/domainProfile/{domainName}.xml file.
8. The VM is not in another protection group.
Errors occurs during recovery plan rest, scheduled recovery, failure recovery, or reverse recovery for a storage replication protection group using 3PAR SRAs
Troubleshoot the issue based on the specific cause. For example:
· If an error occurs when recover plan test is started or finished, try executing the failed task again. The 3PAR SRA script can be executed repeatedly regardless of the current status. If the operation button is grayed out, set the STATUS field of the corresponding record in the TBL_SRM_RECOVERY database to 1 for the protected or recovery site to indicate failure. Although the button is operable, you must delete the mounted storage before clicking the button. Remove storage pools from hosts instead of deleting shared file systems. Then, restart Tomcat before operating the button again.
· If an error occurs during scheduled recovery or failure recovery, check the role of the remote copy group on the storage server backend. If the button is still operable, retry the recovery task. If the role has switched, check why the recovery site cannot mount the storage or start the VM. Common causes include insufficient CPU or memory resources on a host, or no host detects the volume in the remote copy group. After resolving the issue, retry the task. If the button is no longer operable, go to the protected and recovery site's backend to set the STATUS field in the corresponding record in the TBL_SRM_RECOVERY database to 1 to indicate failure. If the recovery site has mounted relevant storage resources, delete the resources. Remove storage pools from hosts instead of deleting shared file systems. Then, restart Tomcat. Next, check the role of the remote copy group. If the role has not changed, try to execute the recovery task again. If the role has changed, have the recovery site to meet the requirements before executing the task again.
· For an error occurring during reverse recovery, if the button is inoperable, modify the STATUS field in the database, delete storage pools at the recovery site, and restart Tomcat. Then, execute reverse recovery again.
Synchronization of device replication relationships fails after SRAs are configured
This issue occurs if CVK is not added to the primary or backup site. Commands issued by SRAs are passes by the CVK hosts to the storage servers. Verify that both primary and backup sites contain CVK hosts supporting SRAs. For 3PAR storage, check the /opt/3par/hpe3parsra/srminterface/command.pyc script. For MacroSAN storage, check the /opt/Macrosan/sra/command.pl script. To verify connectivity between 3PAR storage devices and storage servers, perform ping operations. Verify correctness of usernames and passwords, and enable HTTPS on storage servers for 3PAR storage. To view the information, execute the showwsapi command on the storage servers.
A replication relationship is added for a pair of LUNs newly added on the storage servers of the primary and back sites and the replication relationship cannot be found during storage mapping configuration of a protection group
Verify that the replication relationship has been synchronized from the Web interface of the sites. You can check if the newly added LUN information has been synchronized in the storage array management list of site management. Ensure that all recovery plans are placed in initial state. Otherwise, the relationships that have already been added to the protection group after storage replication synchronization might be incorrect or missing.
An error occurred when scheduled recovery, reverse recovery, and scheduled recovery are executed in turn for non-SRA storage
Non-SRA storage programs do not synchronize LUNs. Before executing a recovery task, synchronize LUNs manually. If you do not synchronize LUNs before reverse recovery, the subsequent scheduled recovery will fail.
Storage LUN device promotion fails before scheduled recovery is performed for non-SRA storage.
· Ensure that snapshot is enabled for related LUNs of the primary and backup sites on the storage servers.
· Ensure that the number of snapshot time points of the related LUNs in the primary and backup sites has not reached the upper limit on the storage servers.
· Ensure that automatic time point saving is enabled on the storage servers for the related LUNs in the primary and backup sites.
· Ensure that the LUNs have been manually synchronized.
· Make sure that at least one CVK host in the backup site can access the storage devices configured for the protection group. Check whether the identifier of the storage adapter of the backup site CVK host exists in the Initiator associated with the target client of the storage server.
Recovery of some VMs fails after scheduled recovery is finished
· If non-SRA storage is used, LUNs might not be synchronized before scheduled recovery is executed.
· During the recovery of multiple VMs, some VM might not start successfully due to CVK being busy. In this case, retry the recovery task to resolve the issue.
· If a migration operation has been executed for the VMs in the protected group before failure recovery, the failure to synchronize the VM LUNs to the backup site might cause the VM recovery to fail.
· During recovery, the system will check if the resources on the host are sufficient. If not, adjust the resources to ensure that the recovery site has enough resources before executing the task.
Storage resource suspension fails during scheduled recovery.
If the storage is occupied by an active process, suspension will fail. For example:
· The bug report (201607260323) describes an active VM outside of the protection group that references files from the storage of the protection group through the optical drive.
· An operator has not logged out of the storage directory through SSH.
The desired remote copy group cannot be found when storage scan with 3PAR SRAs is performed.
To resolve this issue:
1. Connect to 3PAR servers and check if the remote copy group's status is correct.
2. Ensure that the protected volumes in the remote copy group are exported to the hosts at the protected site, and the backup volumes are exported to the hosts at the recovery site.
3. Check if the expected remote copy group information is in the /srm/sra/conf/data/rcgroupinfo_XXXX.xml file on each CVK host. Execute device discovery on CVK hosts without the information. If the target WWN is discovered by using this method, delete the remote copy group from the rcgroupinfo_XXXX.xml file on CVK hosts where the WWN is not found.
In version E0705, reverse recovery with 3PAR SRAs fails due to a null pointer exception.
Firstly, verify that the null pointer failure is triggered during the second syncOnce execution. Check the cas.log file to see if the error stack where the null pointer is reported contains the keywords syncOnce and SiteRecoveryManagerHandler.reversePlan. If they exist, log in to the two 3PAR servers and use the showrcopy command to check if the role of the remote copy group used by the protection group has been switched, which means the latest role of the remote copy group added to the protection group as primary is now secondary. If this condition is met, perform the following tasks to restore the environment:
1. Stop the restored VMs at the recovery site, and delete the VMs without clearing the storage volumes.
2. Stop the storage pools mounted by the protection group at the recovery site and delete it. Only delete the storage pools on the hosts. Do not delete the shared file systems of the host pools.
3. Log in to the 3PAR servers and perform a switchover operation for the remote copy group in the protection group. After the operation is successful, check the role of the remote copy group again. The remote copy group should be restored to the state it was when it was added to the protection group. For example, if its role was primary when it was added to the protection group, its role now is also primary.
4. Start storage and VMs at the protected site to ensure normal business operations.
|
|
IMPORTANT: Although the business is now running correctly, the recovery plan is still in failed state. This is a normal phenomenon. |
Risks, restrictions, and guidelines
During the disaster recovery process, there is a high risk of operational errors, mainly concentrated in the configuration part, with fewer risks in the post-configuration operations. Follow these restrictions and guidelines:
· If a non-SRA storage server is used, and the storage arrays at both the protected and recovery sites have replication and snapshot function licenses, data replication can be achieved.
· If a SRA-supported storage server is used, make sure that you have obtained the relevant licenses for the storage server. For example, for 3PAR, you need to obtain all the remote copy-related licenses that support SRAs.
· The data of the protected VMs is stored on shared storage resources that have replication relationships configured.
· You must obtain a license for CAS CVM to register the SRM feature.
· After the disaster recovery environment is configured, if a MacroSAN storage server is used, data synchronization must be completed before any recovery plan can be carried out.
· For storage arrays that support SRA function, SRM disaster recovery process can automate the entire VM restoration process. For storage arrays that don not support SRA function, SRM process needs manual preparation of the storage environment before VM restoration process can take place.
· If you use 3PAR servers as class 2 storage servers, follow these restrictions and guidelines:
¡ When you create a remote copy group, make sure that the WWNs of the LUNs with mapping relationships within the group are consistent.
¡ When you add a LUN on 3PAR devices to CVK as a shared file system or block device, ensure that the LUN has not been added to a remote copy group, or if it is, the role of the LUN in the remote copy group is primary.
¡ Currently, CAS disaster recovery only supports restoration in the event of a primary CVM fault or link fault between the primary CVM and primary storage server. It does not support restoration in the event of a primary storage server fault, but this will be supported in the future.
¡ CAS disaster recovery CAS only supports remote copy chains of RCFC type.
¡ Before synchronizing the storage replication relationships on CAS, verify that the roles of all remote copy groups used by CAS are not primary-rev or secondary-rev.
¡ To add a new storage replication relationship for use by CVM after synchronizing the storage replication relationships, you need to synchronize the storage replication relationships again after configuring them on the storage server. Before synchronization, ensure that all recovery plans are in initial state to avoid inconsistency before and after synchronization for the existing storage replication relationships.
¡ Do not execute switchover, restore, start, or stop operations on remote copy groups that have joined protected groups on storage servers. Otherwise, recovery or recovery plan test might fail.
Disk backup disaster recovery
About disk backup disaster recovery
Disk backup disaster recovery protects VMs or physical production servers installed with the disaster recovery client. The real-time disk replication feature of the disaster recovery client copies data of protected objects by operating system to the recovery site to restore the protected objects as VMs. With the snapshot chain and real-time synchronization mechanisms, data can be backed up and synchronized in seconds to satisfy the requirements of high-performance RPO data recovery.
Troubleshooting commands
· To check the status of a CDP server, execute the cdapserverservice status command.
· To start a CDP server, execute the cdapserverservice start command.
· To stop a CDP server, execute the cdapserverservice stop command.
· To check the status of a CDP storage node, execute the cdapstorage status command.
· To start a CDP storage node, execute the cdapstorage start command.
· To stop a CDP storage node, execute the cdapstorage stop command.
Troubleshooting
A host cannot be configured as a disaster recovery storage node
Symptom: When a host is configured as a disaster recovery storage node, the system prompts that the system is not initialized and you must initialize it first.
Cause: The AceSure server package has not completed initialization.
To troubleshoot this issue:
1. Verify that the host does not have an IPv6 address. Disaster recovery does not support IPv6.
2. Check whether the initialization is completed by examining the /var/log/firstboot.log file.
Figure 1 Successful initialization
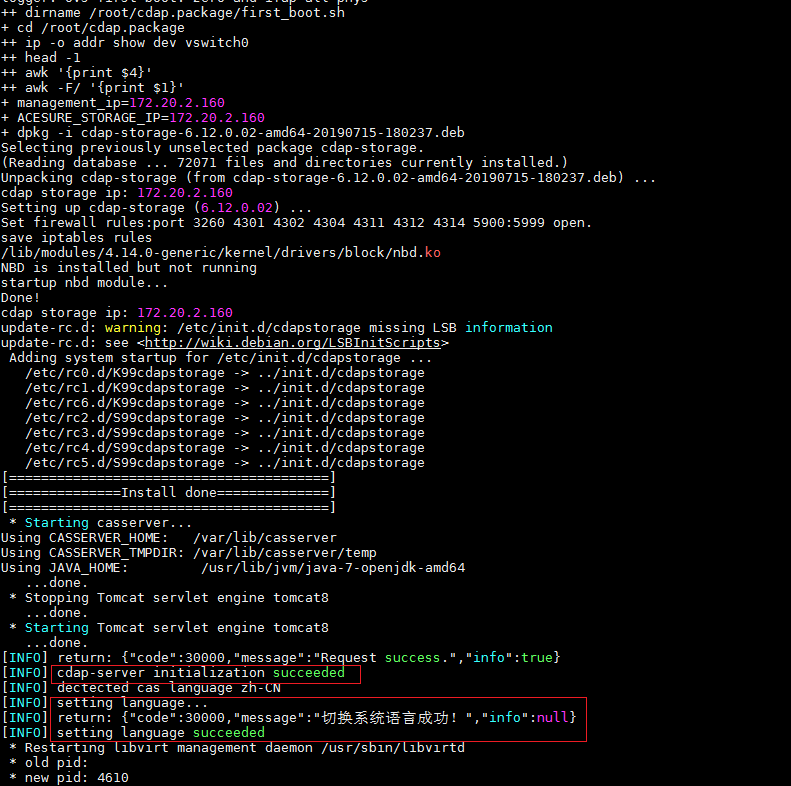
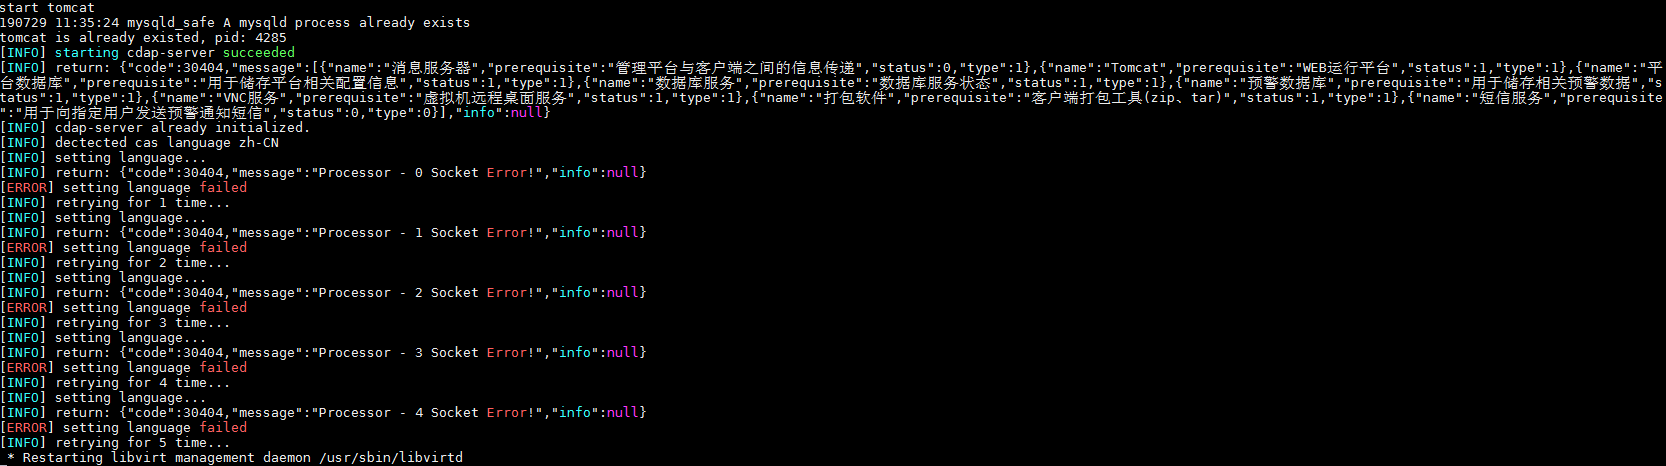
Because the host is an IPv6 host, initialization and language format configuration fail.
Figure 2 Failed initialization
To resolve this issue:
· Method 1: Run front.upgrade/acesure/cdap/first_boot.sh in the upgrade package.
· Method 2: Log in to the AceSure console and manually complete initialization.
In the Vi /usr/local/cdap/6.0/server/tomcat/webapps/ROOT/WEB-INF/classes/appVersion.properties file, verify that forbidden_web=false exists.
Log in to CVM IP address:9980 with the default username admin and password admin. Start the configuration, use the default primary and secondary IP addresses (the CVM address), and then click Next until completion.
The disaster recovery management function is invisible after an upgrade is performed from a version earlier than E0701L01
Cause: The original SRM disaster recovery function is an enterprise edition feature. After the upgrade, the disaster recovery function can only be used in the enterprise enhanced edition.
Solution: Register with the enterprise enhancement license. This operation is performed by marketing personnel.
After the disk backup disaster recovery license is registered, the license information displayed is abnormal
Cause: The cas_mon service starts later than the cdapserver service. Check license information in the vi /usr/local/cdap/6.0/server/var/message.log file. This issue does not affect operation.
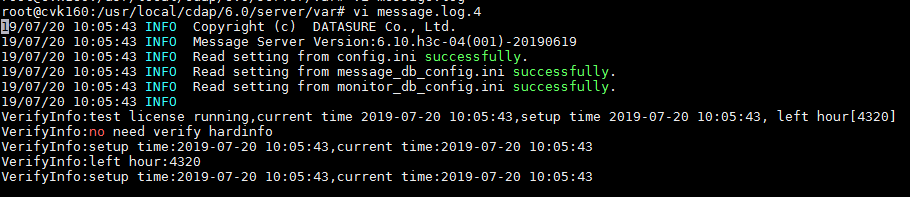
Solution: Restart the cdapserverservice service after installing a new environment. Execute the cdapserverservice stop and cdapserverservice start commands in turn. If protection groups have been configured, resolve this issue when no backup tasks are in progress.
A storage node goes offline if shared storage is repeatedly configured as disaster recovery storage medium
Cause: When a storage node is offline, it means that the AceSure storage node service is offline, not that the storage node itself is actually offline. To set up shared storage as storage media, restart the cdapstorage service for the configuration to take effect. Storage nodes might be restarting when you repeatedly configure shared storage as disaster recovery storage medium.
Solution: Avoid frequent configuration or try again later.
A production server cannot be found when nodes are adding to a disk backup protection group
Troubleshooting:
1. Verify that the production server is assigned an IP address, and the server can reach the management network and backup network of the recovery site.
2. Verify that Agent is running by using the following commands.
¡ Windows: cdap_client_agent_ex.exe
Verify cdap_client_slave_mount_ex.exe is running.
¡ Linux: server client_agent status
3. Protect group mappings: Verify consistency between the number of virtual switches and production servers. Verify that the VM's storage pools, virtual switches, and port profiles are not in the mapped resources.
4. Verify that the MESSAGE_SERVER_LAN_IP_ADDRESS of Agent is the server IP address of the recovery site.
¡ Windows: \Program File(x86)\Dsagent\Agent.ini
¡ Linux: /usr/local/saltfish/bin/Agent.ini
5. VMs with PCI, USB, SR-IOV, GPU/VGPU, TPM, NUMA binding, mounted optical drive, and floppy drive will be filtered and not allowed to be added.
6. VMs deployed via DRX fast deployment, DRX fast clone, and floating desktop pool, as well as VMs in fixed desktop pool protection mode, are not allowed to be added.
7. VMs with host physical CPU bindings are not allowed to be added.
8. The server is not in any protection group.
9. A VM with the same name exist at the recovery site.
The backup status of a production server is abnormal
· A production server is not successfully added to a protection group. However, the backup status of the production server is in a paused state.
Solution: On the production server addition page, click the restore button for the VMs with abnormal backup status.
· The backup state of VMs in the disk backup protection group is paused or abnormal.
Solution: Check whether there has been a backup network change. If a backup network change has been made, the cdapserverservice service of the recovery-side CVM and the cdapstorage service of the corresponding storage node need to be restarted.
Check for network abnormalities and unreachability. You can ping between the production server and the host, and you can also check the slave_process.log and general.log in the Agent logs of the production server to see the current address used for communication with the AceSure console. If there is a network abnormality, the log will display connect error num=10053.
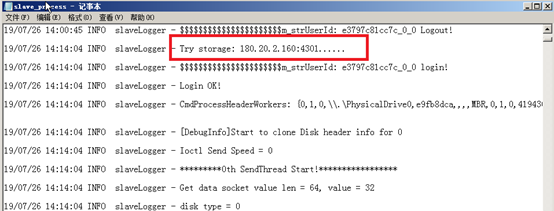
If the network is normal, select the abnormal production server and start the backup task.
Other factors that might lead to the paused backup status include:
¡ The disaster recovery storage media has no available capacity. As a result, the backup state will automatically become pause.
¡ If the production server's Agent is not running, check the cdap_client_agent service in Windows or the client_agent service in Linux.
· The backup status of VMs in the disk backup protection group is displayed as not configured.
Solution: Select the abnormal production server and issue backup configuration.
· The backup status of the VMs in the disk backup protection group is displayed as empty.
Cause: The production server or Agent is offline.
Bulk deletion of production servers fails for a disk backup protection group
· When there are a large number of VMs in the disk backup protection group, some of them might fail to be deleted in a bulk deletion operation.
Cause: AceSure takes a 2-minute cycle to process deletion tasks, and timeouts might occur due to network issues, disk performance, and task concurrency. You can delete the production servers again.
· When you delete a disk backup protection group for stateful failover or cluster business, you cannot delete it offline, and the backup state must be consistent during the deletion process.
A Linux recovery server cannot load the operating system, and the DataSure boot option must be selected
For example, if a recovery server recovered from a heterogeneous platform (VMware) cannot be started normally on the CAS platform and enters emergency mode, you can restart the VM and select the DataSure boot option to load the system correctly. This boot option is used to handle situations where the server cannot be started correctly.
Risks, restrictions, and guidelines
· Backup network best practices
As a best practice, set up a dedicated backup network as a disaster recovery backup network for a host. The primary and secondary addresses of the client must be their management network address and backup network address respectively. Configure two NICs for a production server, one to interconnect with the AceSure console network for communication between the console and Agent, and another to interconnect with the backup network for data transmission.
After a backup network is deployed to a virtual switch, if the virtual switch is modified by adding a new network or changing the IP address, the backup network configuration needs to be redeployed.
· Backup network changes
To make backup network changes, configure the backup network during non-busy hours, the console's cdapserverservice and cdapstorage services, and redeploy backup tasks to all protection groups. If changes are made during a backup operation, it will cause the backup operation to pause or fail. As a best practice, plan the networks during the initial setup and avoid changing the backup network settings for a live network.
· Restrictions and guidelines for client download
Only disk backup disaster recovery requires a client. Install the client on protected production servers (VMs, physical servers, or bare metal servers). Because the client requires the recovery server IP address, download the client after configuring the recovery network proxy IP address at either the recovery or protected side. As a best practice, download the client at the recovery site.
Use one of the following methods to download and install the client:
¡ Download the client from the Web interface and install it directly on a VM.
¡ For Linux systems, copy the URL link, paste it into the command line of a VM to download and install the client. The URL link is a Linux command line and is not supported by Windows.

· Install Agent on a production server
For client compatibility, see the CAS compatibility matrixes. Make sure that the client version matches the kernel version of the target production server.
After installing Agent on the Windows system, you must restart the system services for the installation to take effect. To view the Agent service:
Navigate to Task Manager > Services > CDAP Service.
Figure 4 CDAP service
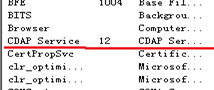
Figure 5 CDAP process
![]()
For Linux production servers, manually select a client version whose compatible kernel version matches or is similar to the kernel version of the operating system.
After installation, you do not need to restart the Linux system. You can use the following command to check whether the service is running correctly.
¡ [root@localhost bin]# service client_agent status
¡ [root@localhost bin]#ps –ef |grep cdap
· Restrictions and guidelines for creating a new VM or VM template by cloning a VM with Agent-installed
In the initial environment, you might need to deploy Agent in bulk. When you clone a production server with Agent-installed as a VM template, delete the AgentSysteminfo configuration file under the Agent installation path on the production server. Then, clone the running production server to create a VM or VM template. The Agents on the cloned or template-deployed VMs will be in running status.
· Restrictions and guidelines for production servers and recovery VMs
¡ The first nine restrictions apply to VMs protected by storage replication disaster recovery. All the restrictions apply to VMs protected by back disaster recovery.
- Cloud rainbow migration.
- Convert to a template.
- Add VM hardware devices.
- Delete VM hardware devices.
- Volume migration within a storage pool.
- Migrate by storage.
- Migrate by host and storage.
- Migrate by host.
- Forbid deletion.
- Create restoration points.
- Create snapshots.
- Export as an OVF template.
- Managed by HA.
- Edit VM storage.
- Add VM or host rules.
- Forbid to add to a VM group or host group.
- Back up.
- Clone.
- Clone as a template.
- Backup policies.
¡ In storage replication protection groups, production servers have restrictions that include migrating by storage and migrating by hosts. In storage replication protection groups, production servers are allowed to be migrated by storage and migrated by host and storage.
¡ Agent on a recovery VM is in a non-running state. After the recovery VM is switched to a normal VM, its UUID and MAC address will change, and the AceSure field in the XML file will be deleted.
¡ Disaster recovery mechanism focuses on data accuracy. Consistency with the original production server in disk format, provisioning, and cluster size is not guaranteed.
· Disk expansion and addition for VMs in a protection group
¡ Storage replication—LUN replication has no impact on disk expansion and addition.
¡ Disk backup—To avoid data loss, if a production server in a disk backup protection group needs to add or expand a disk, the server must first be deleted from the protection group. After disk expansion or addition, the disk must be expanded or assigned a disk letter on the guest operating system, and then the production server must be added back to the protection group.
· Relationships between protection groups, recovery plans, and production servers
¡ Storage replication—One-to-one correspondence between protection groups and recovery plans.
¡ Disk backup—One protection group can correspond to multiple recovery plans, but one production server can only correspond to one recovery plan.
· Conditions for recovery plan test and scheduled recovery
During a recovery plan test, the second last snapshot is used to simulate the disaster scenario. If there is only one snapshot available on the production server, the test cannot be carried out. For server clustering and stateful failover setups, the snapshot count of a shared disk must be equal to or greater than 2 in order to perform the test. The production servers must not be modified during the test to ensure accurate and reliable results.
For a scheduled recovery, the last snapshot is used to restore the production server environment. However, if the production server is in a synchronization or backup state, recovery is not allowed. In the event of a failed recovery, you cannot perform another test to prevent further damage to the environment. Contact the development team for investigation and resolution in this case.
To query the snapshot number of a normal production server, click its display name in the protected production server list of a protection group to go to the snapshot information page. To view the number of shared disk snapshots for stateful failover and cluster environments, check the storage path.
· PE reverse recovery
After a recovery VM recovered by a disk backup protection group starts, to prevent data loss, use the PE tool to restore the backup data back to the production environment before cleaning backup data. Cleaning backup data will delete the recovery VM and its temporary files, but will not delete AceSure's backup data.
There are the following modes for PE restoration:
¡ Normal mode restores the snapshot point and all the data written at takeover before the restoration.
¡ Seamless mode restores a snapshot point and all data before the snapshot point and then restores the newly generated data in the VMs.
¡ Temporary data restoration only restores the newly generated data in the recovery VM.
· Maximum number of disks for VMs in a disk backup protection group
The production servers in a disk backup protection group can have up to 30 disks.
· Features not supported in the current software version
The current version does not support IPv6, stateful failover disaster recovery, disaster recovery in security mode, bulk deployment of Agent, and disaster recovery alarm. These features will be supported in later versions.
· For disaster recovery alarms, since the current version does not support disaster recovery alarms and CAS cannot read the backup data size in AceSure, enable the cluster shared storage usage threshold in CAS alarm management and set the backup storage on the host at startup as the disaster recovery storage medium. This enables timely expansion or backup data cleaning when storage capacity alarms occur, avoiding backup failure due to full storage.
HA
Overview
Figure 7 shows the HA modules and data flow direction.
Figure 6 HA modules and data flow direction
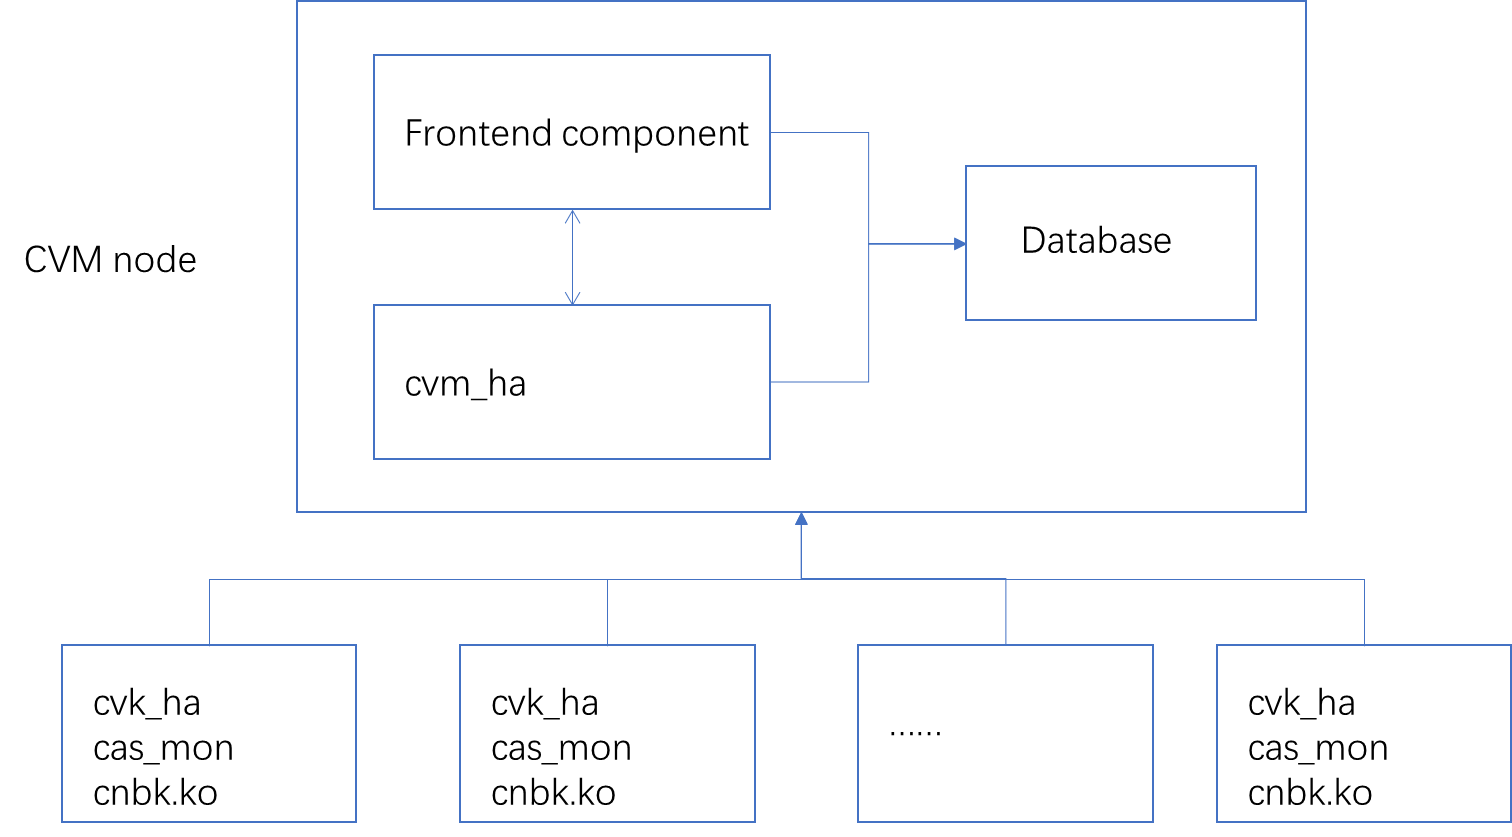
You can migrate or freeze VMs through HA.
· Migrate—If a VM uses the shared storage or a block device, the VM will be migrated to another CVK when the shared storage fails.
· Freeze—The VM will be frozen and enter suspended state when the shared storage fails. When the Shared Storage Fault Action parameter is Do Not Restart Host, this action can be configured. You can configure the Shared Storage Fault Action parameter on the System > Parameters > System Parameters page.
Command tool: cha –h. For more information, see the HA command help file.
Kernel module of HA
Implementation
The HA kernel module chbk.ko detects the host heartbeat between the CVK hosts and the storage heartbeat between the CVK hosts and the storage pool, and reports the detection results to the cvm_ha process. The cvm_ha process determines whether the management network of CVM and CVK is normal and whether the shared storage pool of CVK is normal.
Fault detection for the OCFS2 storage pool
· Active reporting by the storage module—When the storage module detects a storage pool fault. the fence will restart the host if the Shared Storage Fault Action parameter is Restart Host. If the Shared Storage Fault Action parameter is Do Not Restart Host, the storage module notifies the cvk_ha process of the storage pool fault through the cha command, and the cvk_ha process sends the message to chbk.ko, which reports the message to the cvm_ha process.
· OCFS2 storage pool heartbeat detection—The system reads timestamps from the heartbeat file /sys/kernel/debug/o2hb/storage_uuid/elapsed_time_in_ms. If the timestamp is greater than the heartbeat multiplied by 1000, the detection fails. If the number of consecutive failed detections is a multiple of 12, the cvk_ha process notifies the cvm_ha process of the storage pool fault.
Fault detection for the NFS storage pool
NFS storage pool heartbeat detection: chbk.ko writes timestamps to the heartbeat file /mount_path/.hostname_timestamp at the storage heartbeat interval. If the write fails, it is considered a detection failure. If the detection fails consecutively for three times or the number of failed detections is a multiple of 12, the cvk_ha process notifies the cvm_ha process of the storage pool fault and triggers the migration of VMs using the related storage pool.
Host heartbeat
chbk.ko sends a heartbeat packet to the cvm_ha process at the configured host heartbeat interval. If the cvm_ha process does not receive heartbeat packets for three consecutive intervals, the CVK management network will be considered failed.
Storage heartbeat and host heartbeat
Check the availability of VM disks: If a storage pool's heartbeat check fails, the VM disk in that pool is unusable. This can affect VM operations and trigger VM migration or freezing.
Detect host faults: If both storage heartbeat detection and host heartbeat detection fail, the host is considered faulty, and VM migration or freezing is triggered.
Therefore, host heartbeat and storage pool heartbeat are two important features of HA.
File path
The module path is /lib/modules/4.14.131-generic/kernel/lib/chbk.ko.
Common commands
To detect the kernel module loading state, use the lsmod | grep chbk command.
Problem location
Log file: /var/log/syslog
If a storage pool fails or recovers (keyword: storage pool name), or a heartbeat interruption occurs in the network (keyword: keepalive), you can find related records in the log file.
User-mode services
Service processes
The HA user-mode service processes (cvm_ha, cvk_ha, and cas_mon) work together to ensure high availability of VMs and their applications.
· cvm_ha—located in the CVM node, connects to the database to obtain information about clusters, hosts, storage pools, and VMs. It also synchronizes information with the cvk_ha process. The cvm_ha process and the chbk.ko module exchange messages to monitor the state of the CVK management network and the state of the shared storage pool. They notify the CVM to execute VM migration in case of anomalies.
· cvk_ha—runs on the CVK node, synchronizes data with the cvm_ha process, and is responsible for recording, checking, and reporting information about modules such as VMs, storage pools, block devices, and networks on the CVK.
· cas_mon—is responsible for collecting and reporting performance data, detecting and reporting alarms, and monitoring the lifecycle of VMs.
Implementation
Fault detection for the RBD storage pool
The cvk_ha process uses the ceph command to check the status of the RBD storage pool. If there are three consecutive anomalies detected, the storage pool is considered faulty. If HA is in freeze mode, the cvk_ha process freezes the VM. If it is in migrate mode, the cvk_ha process reports the storage pool state to the cvm_ha process, which notifies the front end to migrate the VM.
Block storage detection
The cvk_ha process opens a block device and sends a test command to check the state of the block device. If there are three consecutive failures, the block storage will be deemed faulty. If HA is in migrate mode, the cvk_ha process notifies the cvm_ha process of block device faults, and the cvm_ha process notifies the front end to migrate the VM. If HA is in freeze mode, the VM is frozen.
Virtual machine fault detection and restart
The front end adds a VM and synchronizes its state to the cvk_ha process, which is referred to as the expected state. If the cvk_ha process detected a VM in offline state instead of the expected online state, the VM status check fails. If a VM fails three consecutive checks, it is considered faulty. At this time, if the shared storage used by the VM fails, the cvk_ha process notifies the cvm_ha process to initiate VM migration. If the shared storage used by the VM is normal, the cvk_ha process tries starting the VM. If the VM is started, the cvk_ha process notifies the front end of successful fault recovery. If the VM fails to start, the cvk_ha process notifies the cvm_ha process to migrate the VM and informs the front end of failed fault recovery. After every 10 consecutive failures in checking the VM, the preceding process is performed once. The specific process is shown in the following figure:
Figure 7 VM fault detection

VM freezing
If HA is in freeze mode and the VM supports freezing, the cvk_ha process notifies the qume process to enable no_fence_start mode. High-speed SCSI hard disks support freezing, and IDE and other disks do not support freezing. When there is an I/O anomaly in the storage pool, the qume process switches the VM from running state to suspended state. If there is no I/O operation, the VM will not be set to the suspended state. The cvk_ha process sets the freeze flag in the VM XML file through libvirt.
<cas:freezestatus xmlns:cas=”umount-freezing”>1</cas:freezestatus>
If the storage pool recovers from failure, the qume process switches the VM to the running state and CVK_HA removes the freeze status.
<cas:freezestatus xmlns:cas=”umount-freezing”>0</cas:freezestatus>
When a VM that does not support freezing mode encounters a storage pool fault, it will be migrated to ensure availability.
Application HA
You can add an application monitoring policy for VMs from the Cluster > App. HA > Configure Monitoring Policies page.
The cvk_ha process uses CAStools to detect the HA state of VMs. If the CAStools state is abnormal for three consecutive times and the application HA state cannot be obtained, the cvk_ha process reports the application HA state as unknown. If CAStools runs normally and the VM application fails to pass three consecutive detections, the cvk_ha process reports the VM HA anomaly and restarts the VM application every three failed consecutive detections. After a VM application restarts for three consecutive times, the system will restart the VM and report an alarm if the HA strategy is to restart the VM.
Figure 8 VM application HA principle

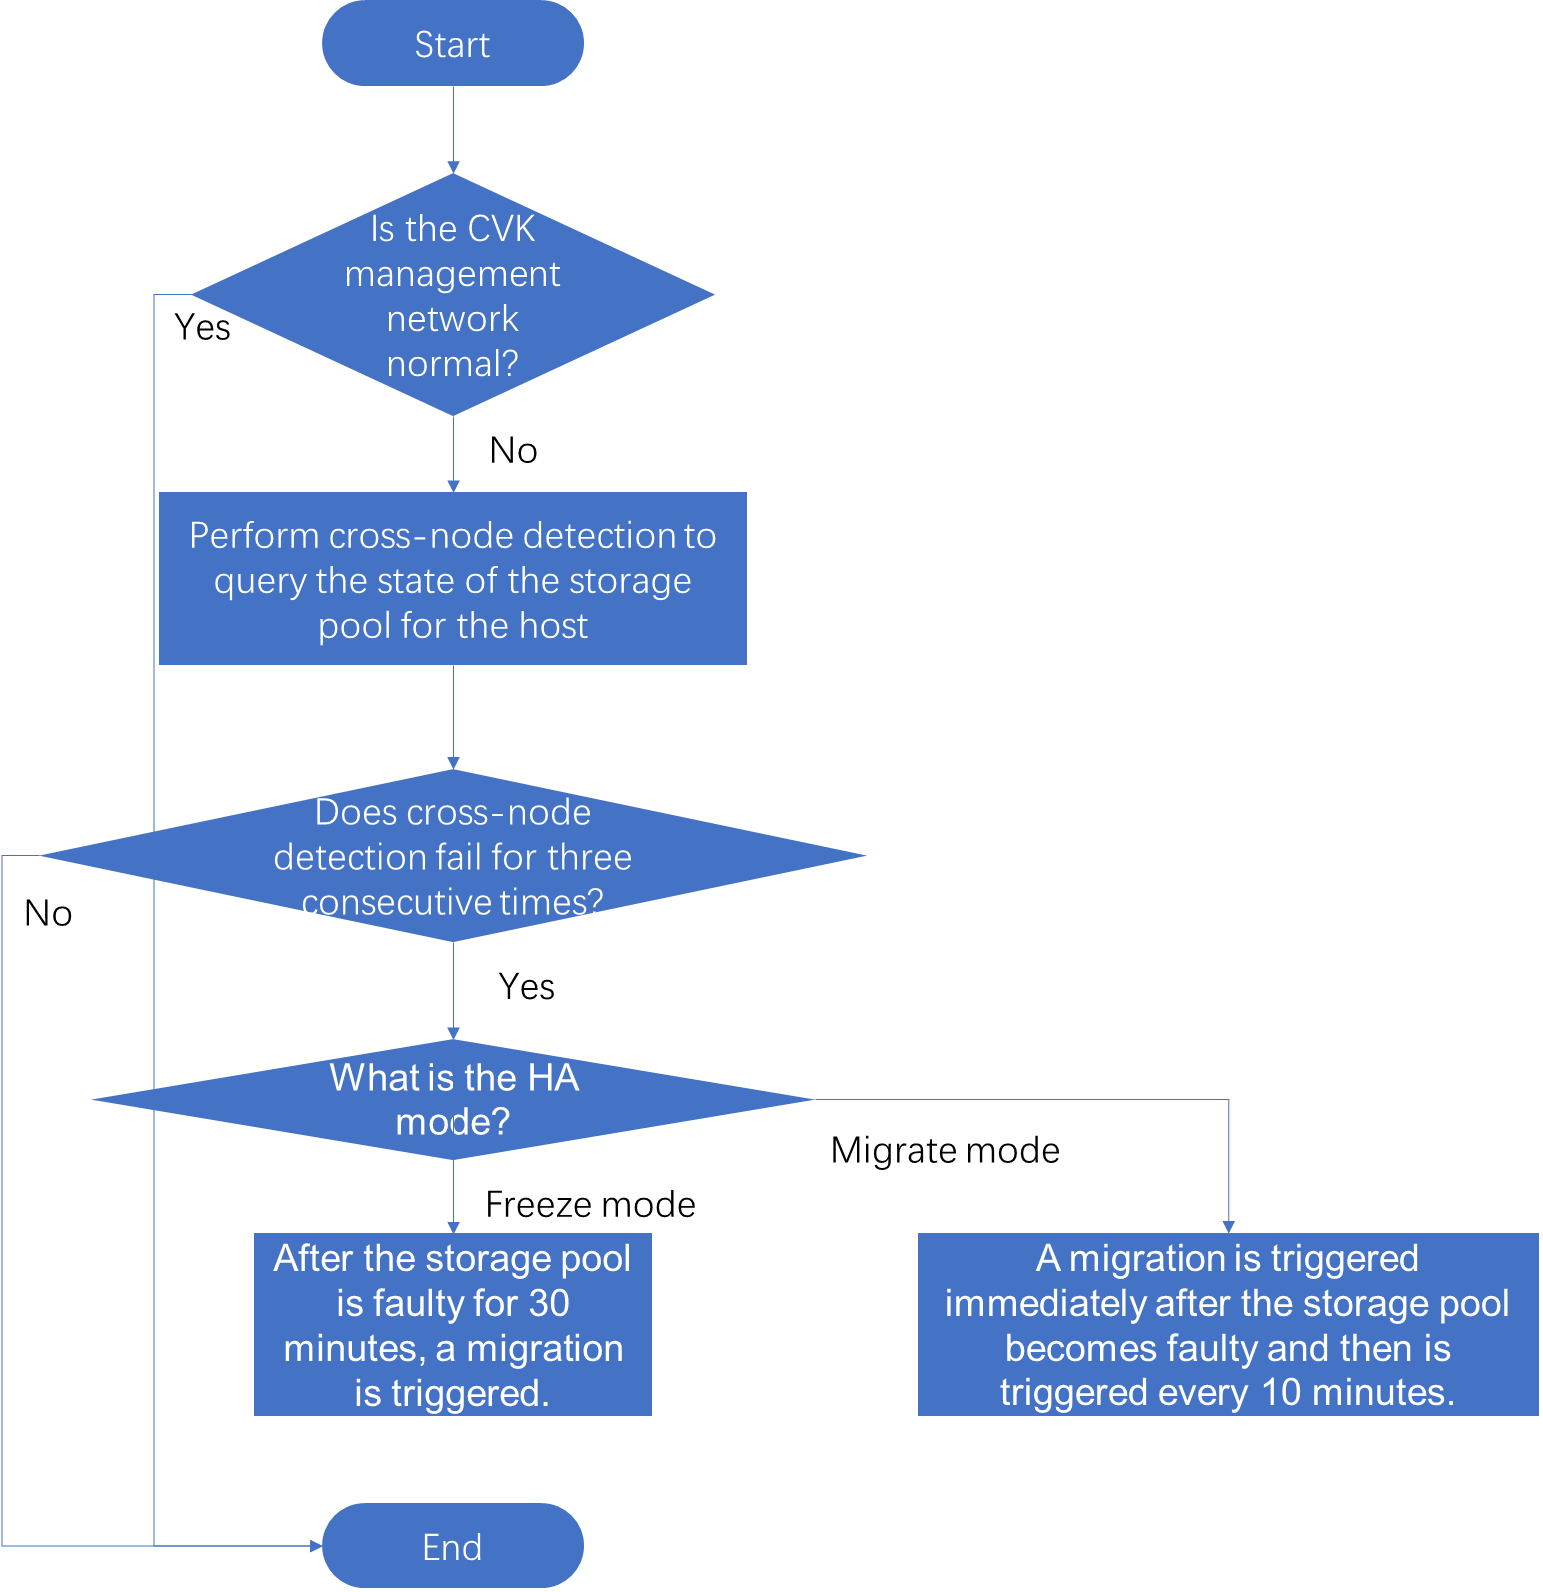
Host fault detection and VM migration
You can configure host heartbeat interval (the default is 10 seconds) from the System > Parameters > System Parameters page.
The chbk.ko module sends heartbeat messages to the cvm_ha process at the host heartbeat interval. If the cvm_ha process does not receive heartbeat messages for three consecutive intervals, it reports an alarm. This indicates a management network disruption between CVK and CVM. At this point, the cvm_ha process executes cross-node detection: Select a healthy CVK (with normal network connectivity and using the same storage pool as the current host (the storage pool status is normal)), and query the current host storage pool status. If the storage pool detection fails for three consecutive times, the current storage pool is considered faulty.
Freeze mode: If the storage pool is faulty and remains faulty for 30 minutes, the host is deemed faulty and VMs are migrated.
Migrate mode: If the storage pool is faulty, the host is deemed faulty and the cvm_ha process triggers VM migration once. Subsequently, the cvm_ha process triggers VM migration once every 10 minutes.
The process is as follows:
Figure 9 Host fault detection
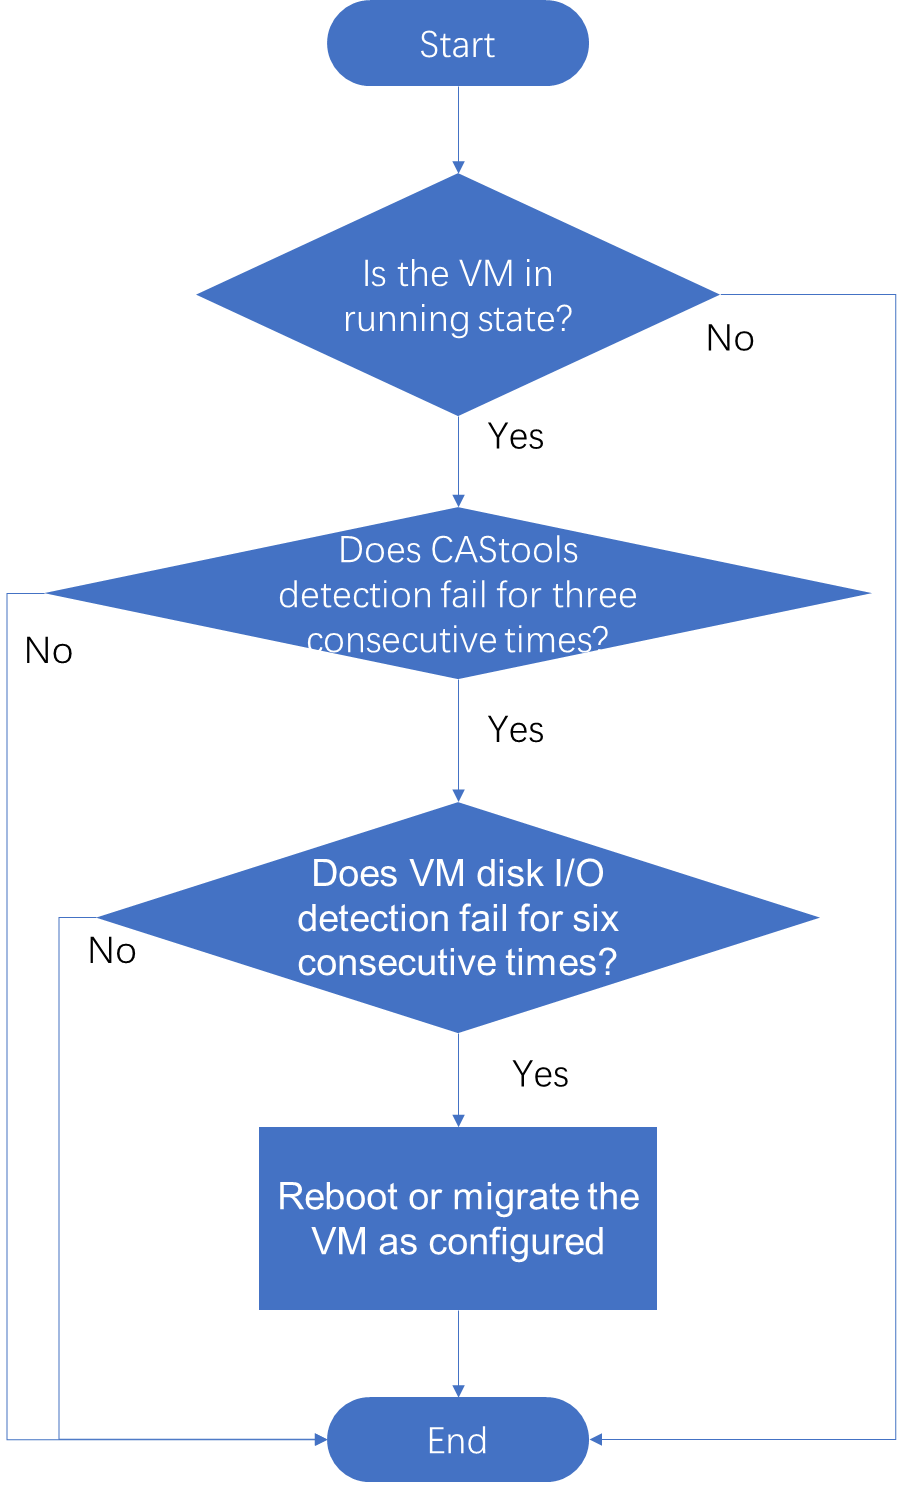
Blue screen fault detection
You can enable blue screen fault detection on VMs through CVM. The osha tag in the VM's XML file is 1 or 2. A value of 1 indicates restart, and a value of 2 indicates migration. The cas_mon process checks the state of the CAStools within the VM. If CAStools detection fails for three consecutive times, detect whether there is disk I/O on the VM. If no disk I/O is detected for six consecutive times, the VM has a blue screen fault. Perform VM restart or migration based on the configuration.
Note: Blue screen fault detection is performed only on VMs in running state, to prevent misjudgment if VMs are manually suspended.
Figure 10 Flowchart for detecting blue screen faults in VMs
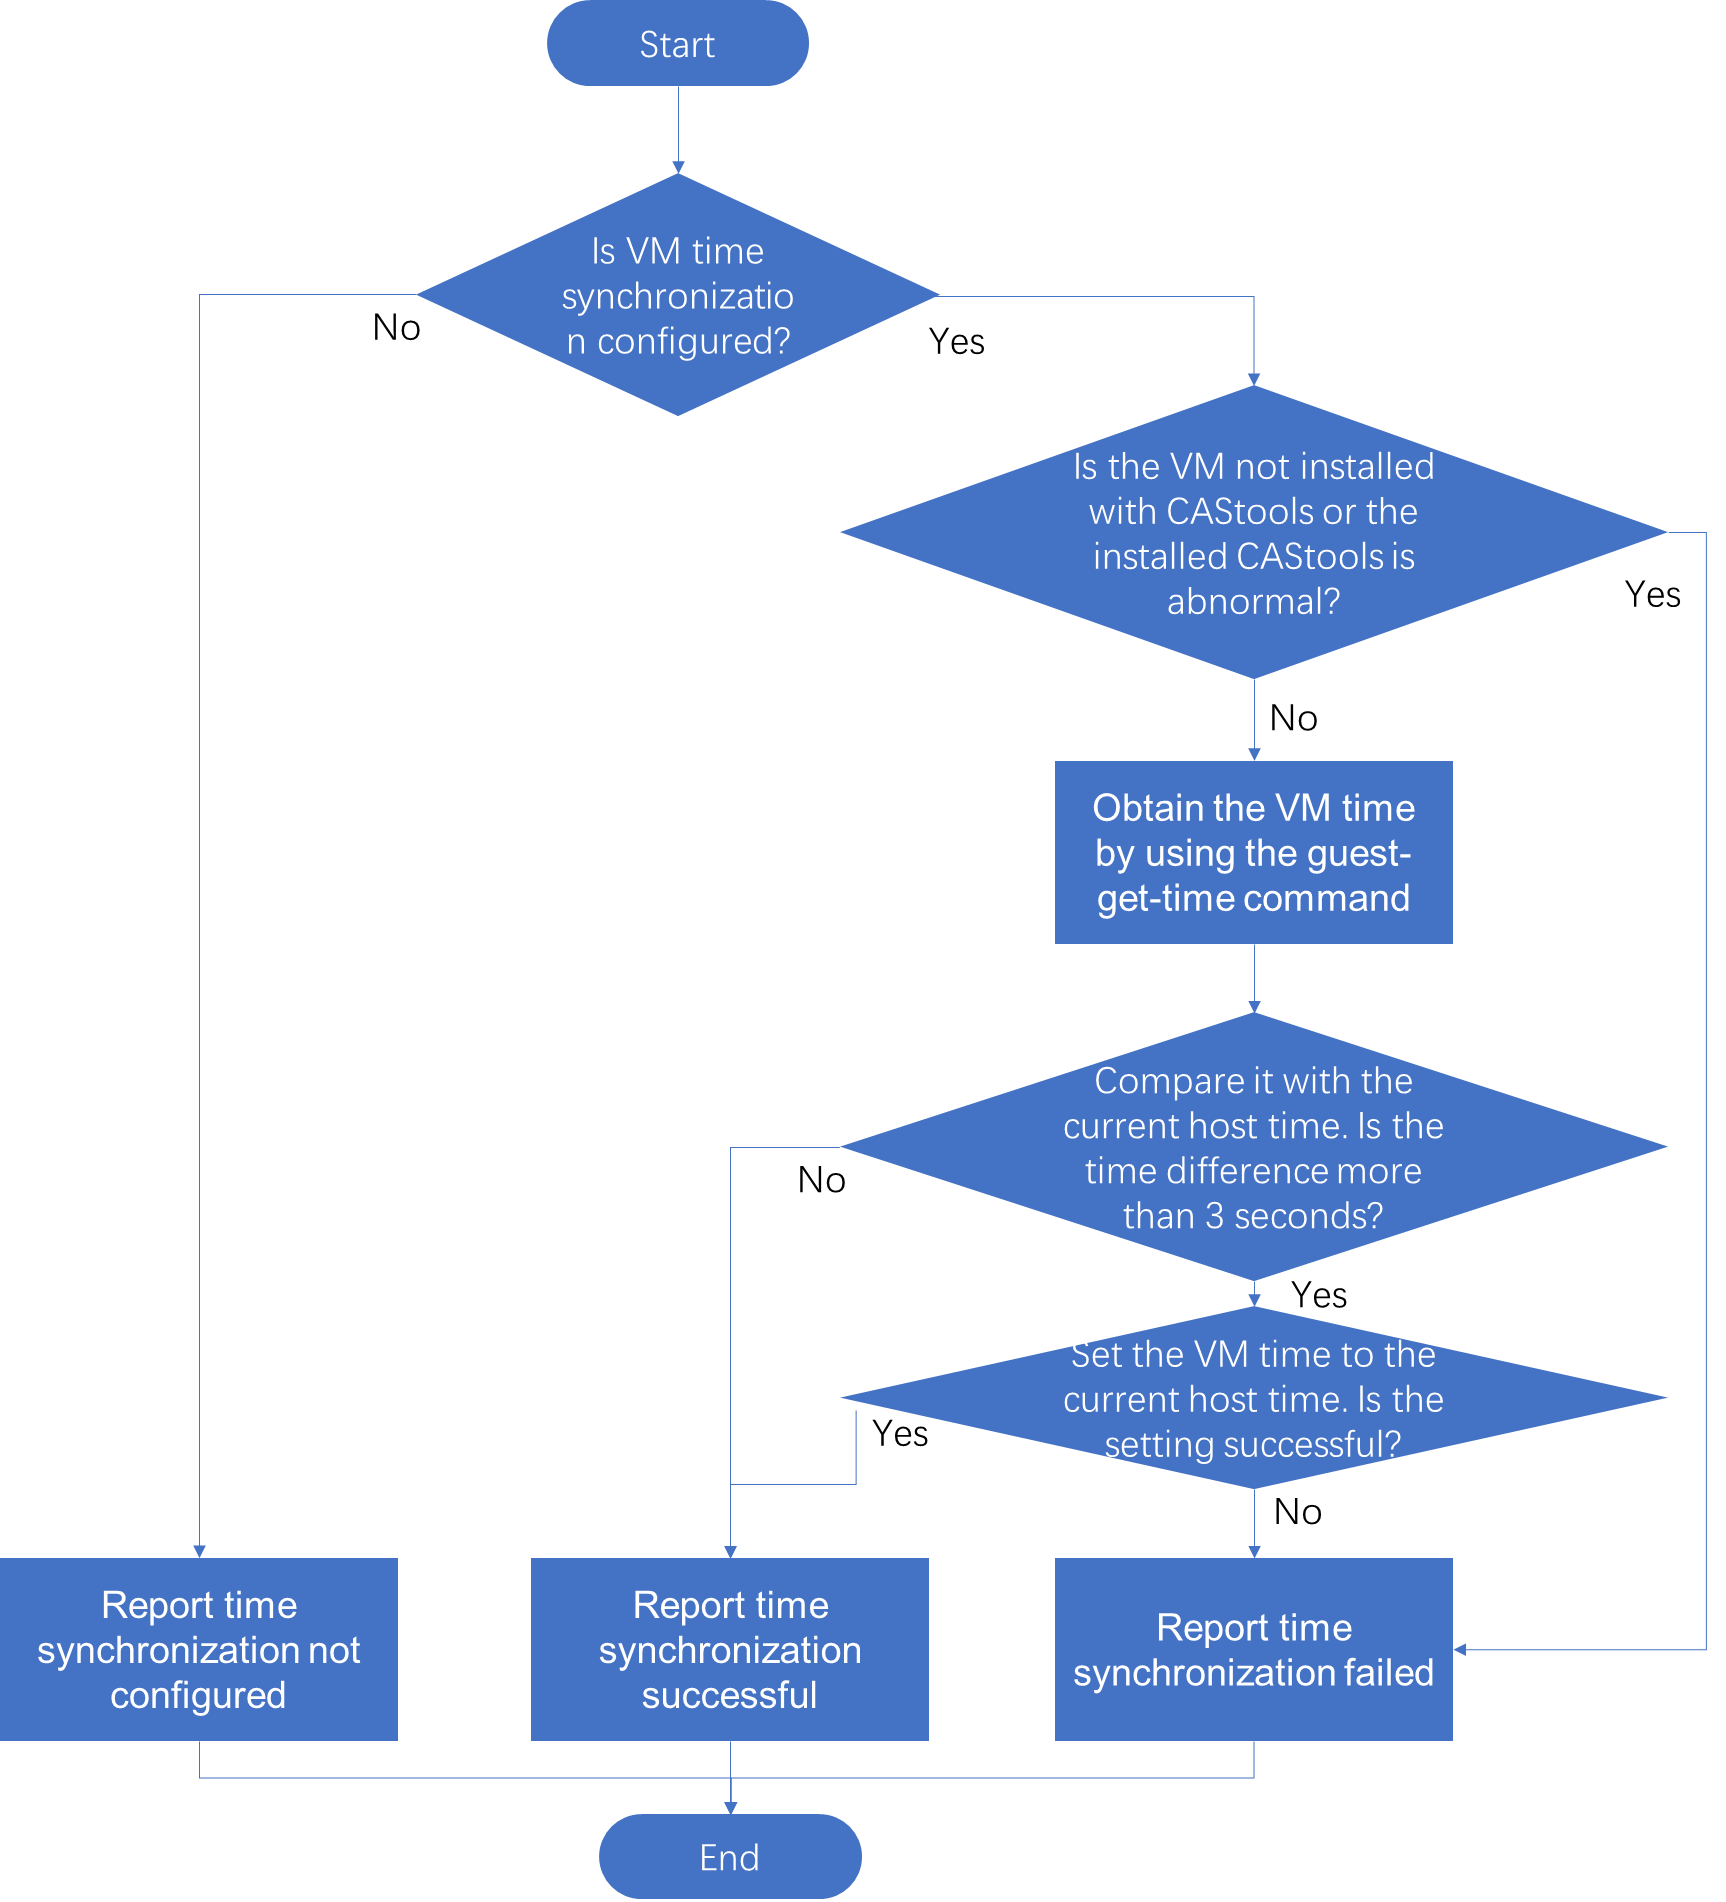
VM time synchronization
You can enable VM time synchronization through CVM by setting the timesync value to 1 in the VM XML file. Other values mean that time synchronization is disabled. If a VM is not installed with CAStools or the installed CAStools is abnormal, the cas_mon process reports the time synchronization state as failed through performance data.
If the CAStools state is normal, use the CAStools command to obtain the VM time and compare it with the current host time. If the time difference is more than 3 seconds, set the VM time to the current host time.
Figure 11 VM time synchronization
Report performance data
The cas_mon process collects the performance data of hosts, VMs, and storage pools. It passes the data to the front end through a TCP connection regularly.
Alarm services
Alarm configuration: CVM deploys alarm configuration to the cas_mon process, which records the alarm configuration in the memory and synchronizes it to the file /etc/cvk/casmon.conf.
Alarm detection and reporting: Alarms include internal alarms and external alarms. The cas_mon process detects and reports internal alarm. External alarms refer to alarms detected by other modules, such as storage. An external alarm is passed to the cas_mon process through the cha command. The cas_mon process reports or confirms the external alarm. The cas_mon process checks the current configuration for alarms, whether external or internal, and only reports them if they meet the relevant configuration requirements. See the CVM alarm management section for the configuration of alarms.
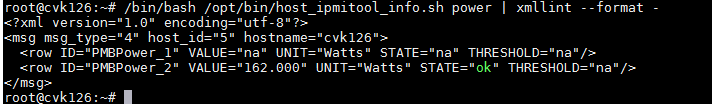
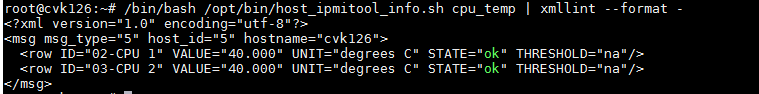
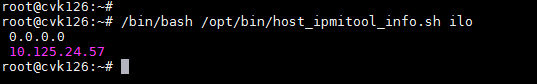
Hardware testing
HA provides a hardware detection script: - /opt/bin/host_ipmitool_info.sh. Based on the ipmi management tool ipmitool, it retrieves information about the host power, fan, CPU, memory, temperature, and iLO, and checks their states. For example:
View the power supply:
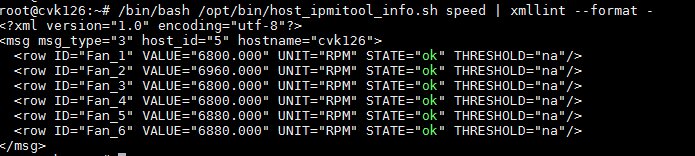
View the fan:
View the CPU temperature:
View iLO port information:
Commonly used commands and configuration
cas_mon-related
Configuration and file:
The configuration file is located at /etc/cvk/casmon.conf.
The log file path is /var/log/cas_ha/cas_mon.log.
The performance data reporting interval can be configured from the System > Parameters > System Parameters page. If the current version does not support configuring this parameter, the default reporting interval is 30 seconds.
Common commands:
To set the log level, use the cha set-loglevel mode -m command. The mode can be debug, info, error, warning, or fatal, and the default mode is info.
To obtain the host performance data , use the cha get-perf-data host –m command.
To obtain the VM performance data, use the cha get-perf-data vm -m command.
To operate the process, use the service cas_mon operate command. The operate parameter can be status, start, stop, or restart.
cvk_ha-related
Configuration and file:
The service process is the cvk_ha process and it can be found in the path /usr/sbin.
The log file is located at /var/log/cas_ha/cvk_ha.log.
Common commands:
To operate the process, use the service cvk_ha operate command. The operate parameter can be status, start, stop, or restart.
To query information about all VMs on CVK, use the cha cvkvm-list –k command.
To query information about a single VM on CVK, use the cha cvkvm-list vm –k command.
To query application HA information on a VM, use the cha appha-list vm –k command.
To set the log level for the cvk_ha process, use the cha set-loglevel mode –k command. The mode can be debug, info, error, warning, or fatal, and the default mode is info.
To query the freeze state of a VM, use the virsh metadata vmname umount-freezing command.
cvm_ha-related
Configuration and file:
The service process is located at /usr/sbin/cvm_ha.
The log file is located at /var/log/cas_ha/cvm_ha.log.
Common commands:
To operate the process, use the service cvm_ha operate command. The operate parameter can be status, start, stop, or restart.
To view the list of clusters managed by HA, use the cha cluster-list command.
To view the status of a cluster managed by HA, use the cha cluster-status cluster-id command.
Problem location
Performance data issue
Symptom: The VM performance data cannot be obtained, and the VM icon is displayed in blue at the front end.
Reason: There are three main reasons for the issue: frontend, network, and backend problems.
Fast location: In cas_mon debug mode, view reported data in /tmp/mon_pdc.xml.
1. To enable cas_mon debug mode, use the cha set-loglevel debug –m command.
2. After one performance data reporting internal, identify whether the file /tmp/mon_pdc.xml exists.
3. If the file /tmp/mon_pdc.xml exists, performance data is reported as normal on the cas_mon of the CVK where the VM is located. Then, the CVM casserver service and management network are checked.
4. If the file /tmp/mon_pdc.xml does not exist, check whether the cas_mon log file include Failed to send performance data to cvm. If not, check whether the cas_mon process is running, collect Err-level log information in the cas_mon log file, and then contact H3C Support for help. If yes, check whether the CVM IP configured in the current CVK is correct by executing the cat /etc/cvk/cvm_info.conf | grep address command. If the CVM IP is correct, troubleshoot the management network. If the CVM IP is incorrect, there might be multiple CVMs managing the CVK, and troubleshoot the network setup.
Remarks:
· After completing the operation, restore the log level to info by using cha set-loglevel info –m command.
· To view the specific performance data reported, view the /tmp/mon_pdc.xml file by using the cat /tmp/mon_pdc.xml | xmllint –format - command.
· Complete cas_mon operations on the CVK host where VM is located.
· To obtain the host performance data, use the cha get-perf-data host –m command.
· To obtain the VM performance data, use the cha get-perf-data vm –m command.
Common backend reasons:
· Some operations caused the /etc/crontab service to malfunction, and cas_mon wasn't initiated.
· The CVK configuration file /etc/cvk/cvm_info.conf records an incorrect CVM IP address.
· The host_id value recorded in the /etc/cvk/cvm_info.conf file does not match the database. The front end failed to match the host ID in the database, so the performance data of the CVK was not displayed.
· CVK changed the host name, but the performance data list recorded the old name. The query failed when using the new host name.
· The libvirt encountered an anomaly, and the cas_mon process failed to obtain some performance data.
· The system experiences issues like insufficient memory and read-only file system on the CVK host.
Common frontend reasons:
· The cvm casserver service or TCP listening port 9120 of casserver performance data is abnormal.
· The CVM performance data cannot be displayed correctly due to casserver's memory overflow. View the log at /var/lib/casserver/logs/casserver.log using the keyword outOfMemory.
The host automatically enters maintenance mode
Symptom: The host enters maintenance mode and triggers an alarm. This prevents CVM from modifying host configurations.
Reason: When the cvm_ha process and the cvk_ha process synchronize data, the corresponding CVK automatically enters maintenance mode. It exits maintenance mode after synchronization, whether successful or failed.
Fast location:
1. If the host enters maintenance mode automatically and the the back end is synchronizing VM data message is prompted when it exits maintenance mode through CVM, consider checking for faults in the CVK storage. The cvk_ha process invokes a libvirt interface for data synchronization. If a fault occurs and some libvirt interfaces are blocked, causing incomplete data synchronization and preventing the host from exiting the maintenance mode. You can also use the virsh command to query storage-related information, check if it is blocked, and validate the storage state.
2. The following scenarios might trigger data synchronization: restoring the management network after a disruption, reconnecting CVM to the host, failing to delete a VM in the migration process, and critical operating failures during data synchronization that trigger resynchronization. You can either search for operation logs or process logs by entering the keyword in the search field.
¡ cvm_ha log keywords:
The keyword for entering/exiting host maintenance mode is maintenance.
The keyword for synchronizing CVM and CVK data is synchronize.
The keyword for CVM and CVK management network disruption/restore is disconnected/connected.
¡ cvk_ha log keywords:
The keyword for CVM and CVK management network disruption/restore is disconnected/re-connected.
The keyword for synchronizing CVK and CVM data is synchronize.
Example:
Symptom: At a site, some CVKs frequently enter and exit maintenance mode repeatedly.
Reason: The cvm_ha log records frequent CVK network interruptions and restorations and data synchronization. This indicates that the issued is caused by network connectivity disruption.
The case of CNOOC: In E0526H05, the system repeatedly reported that the host entered maintenance mode when the host never exited maintenance mode. The normal process is as follows: During the last step of data synchronization, the cvk_ha process deletes VM remnants and notifies the cvm_ha process, which causes the host to exit maintenance mode. The following records were found in the cvm_ha log:
2019-10-19 17:12:41.134 Err [cvm_netdetect.c:1095][4825]: CVM_SendMsgToCvk: cannot find host entry for id 75
2019-10-19 17:12:41.134 Err [cvm_netdetect.c:1268][4825]: cvm_ProcFinishDelVmPacket error!
Tomcat has recorded multiple restarts during this period.
2019/10/19 17:10:44##root pts/4 (10.64.3.32)##/root## service tomcat restart
2019/10/19 17:10:47##root pts/4 (10.64.3.32)##/root## service tomcat restart
2019/10/19 17:10:59##root pts/4 (10.64.3.32)##/root## service tomcat8 restart
Conclusion: Restarting Tomcat triggers CVM_HA to rebuild data. The back end encountered consistency issues with the data after multiple tomcat restarts. To synchronize the data, the backend had to restart tomcat again. The cvm_ProcFinishDelVmPacket function exits maintenance mode. However, due to Tomcat restart, the data is rebuilt at the back end. During this process, the host lookup fails, causing maintenance mode to not exit.
VM reboot upon fault
Symptom: The CVM prompts that the VM restarts successfully upon a fault or fails to restart upon a fault.
Analysis: The cvk_ha process detected a VM that was originally online but is now offline, and attempted to restore the VM.
Possible reasons:
The virsh destroy vm command was executed on the VM at the back end. Check the log file located at /var/log/operation/xx-xx-xx.log for any related operation.
The VM crashed. Check the log file /var/log/libvirt/qemu/<vm>.log for crash records.
VM migration in freeze mode
Possible reasons:
In the VM summary, the blue screen policy is set to Failover. When the VM encounters a blue screen fault, it will be migrated.
The VM disk does not support freezing. Currently, high-speed and high-speed SCSI hard disks support freezing, while IDE and other disks do not.
The VM failed to restart after a fault and triggered a migration.
Identify whether the no_fence_start identifier is set. Migration occurs if the identifier is not set.
VMs are not migrated when a host is restarted
Possible reasons:
CVM_HA has detected a CVK management network disruption and a storage pool fault, which will take approximately 3 host heartbeat intervals plus 4 storage pool detection intervals. If the heartbeat interval and storage pool detection interval of the host are set too long, the host might recover before the HA detection period expires.
Alarms
Symptom: The CVM or server alarm does not have relevant alarms.
Fast location:
1. Check whether the CVM alarm items are enabled. Make sure the alarm time interval and severity match the expected settings.
2. If the alarm item is enabled, check the log file to determine whether an alarm is sent. See below for instructions on viewing the alarm log file.
3. If the alarm log file has relevant alarm records, check whether the reported IP address is correct, whether the CVM (or alarm server) listening port (UDP port 162) and network connectivity are normal.
4. If the alarm log file does not have relevant alarm records, analyze the relevant alarm criteria.
View the alarm log file:
The alarm log file is located at /var/log/cas_ha/alarm_script.log.
The alarm is reported to the host's IP address and UDP port 162, with the corresponding trap ID. Check the log file to determine whether an alarm has been reported. For the correlation between trap IDs and alarm items, contact H3C Support.
root@cvknode:~# tailf /var/log/cas_ha/alarm_script.log
2020-02-25 06:26:36 sys_alarm_sender.py/78L: INFO:hostip 10.125.33.145, port 162, protoType 1, trapId 1.3.6.1.4.1.25506.4.2.26.2.0.140
See the real-time alarm details for the cause of the alarm.
Restrictions and guidelines
Contact H3C Support to confirm potential risks before performing any stop or restart operations on the service process.
Backup module
CVM backup
Implementation
The module includes functions of CVM backup, restore, upload, download, and import. The backup file contains CVM and CVK configuration info, SSH file info, and version number, and MD5 value.
Figure 12 CVK backup
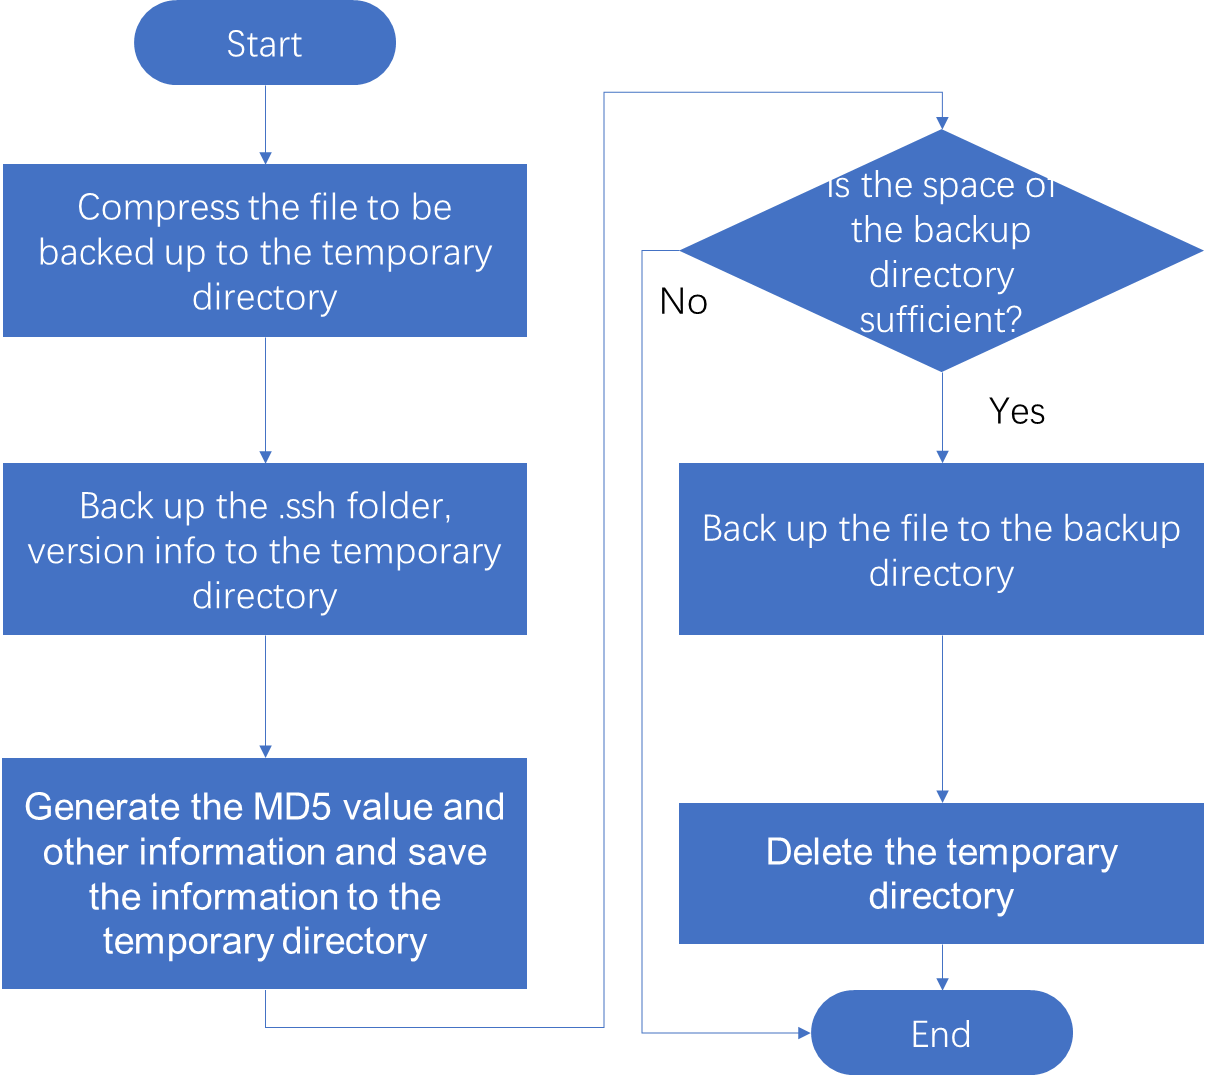
Figure 13 CVM backup

CVM backup process and service management information
Included processes are backup and restore processes related to cvm_br_mng.pyc, cvm_br_mng_backup.sh, and cvm_br_mng_restore.sh.
Common commands
None.
Problem location
The log file is located at /var/log/br_shell_xxx.log, where xxx represents the date and time, consisting of the year and month. The most common reasons for failing to back up or restore a CVM are incorrect usernames or passwords for remote servers, or network connectivity issues. Log analysis can help identify the specific cause of the error. You can see the troubleshooting process for VM backups to troubleshoot this issue.
Restrictions and guidelines
None.
Virtual machine backup
Implementation
The VM backup module includes functions such as VM backup, VM restore, VM import, VM backup deletion, and VM backup import. The VM backup files include the XML file, disk backup file, disk file profile, storage profile, and version information. The related processes are shown as follows:
Figure 14 VM backup
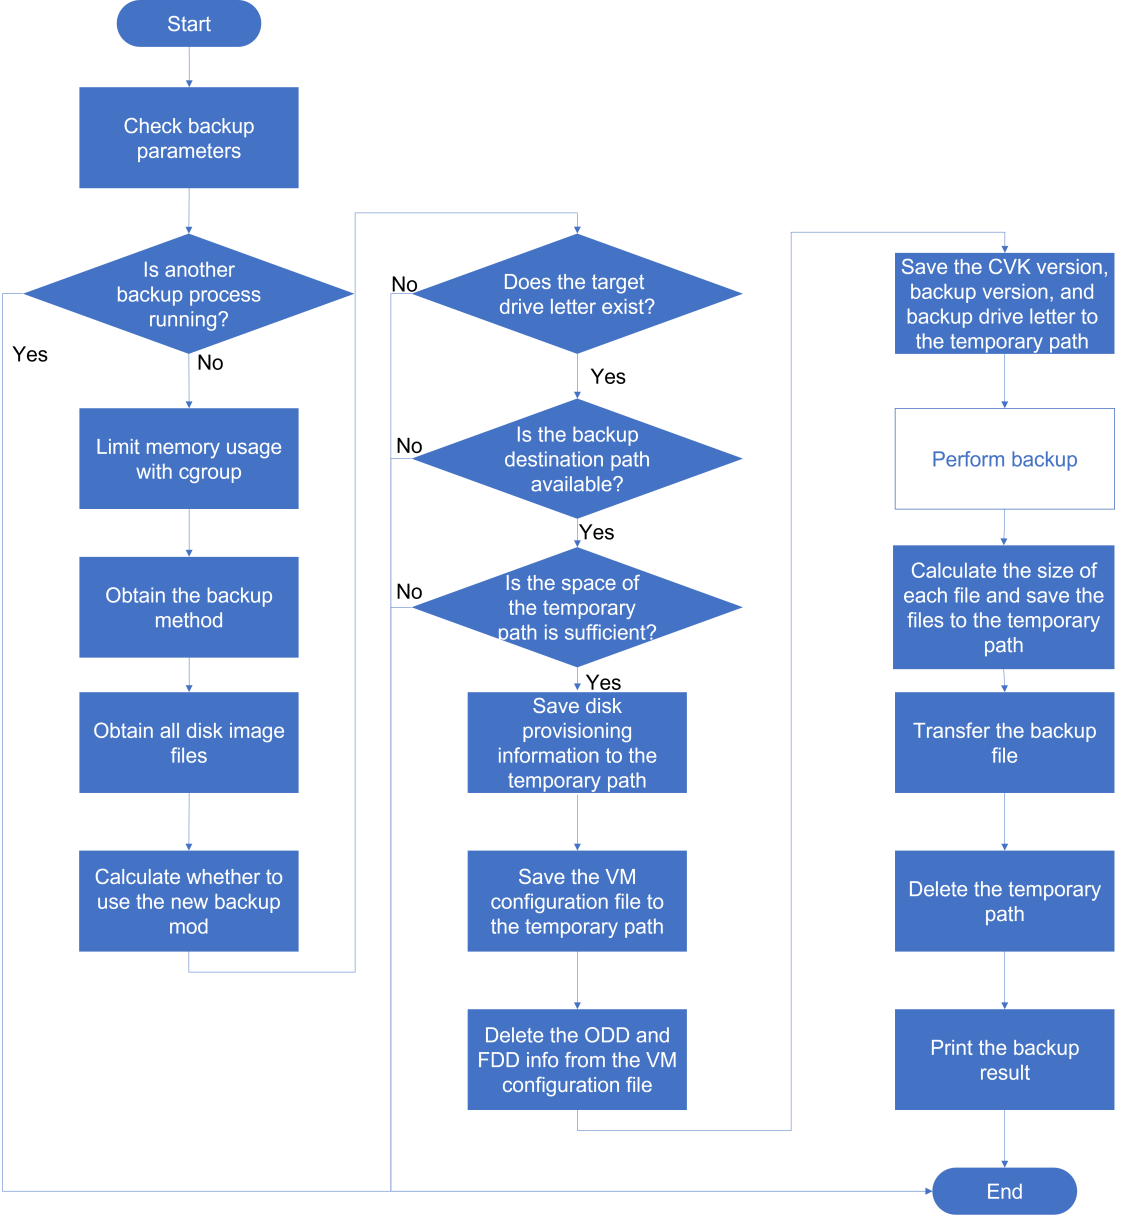
Figure 15 VM backup process with raw/luks/LVM/block devices
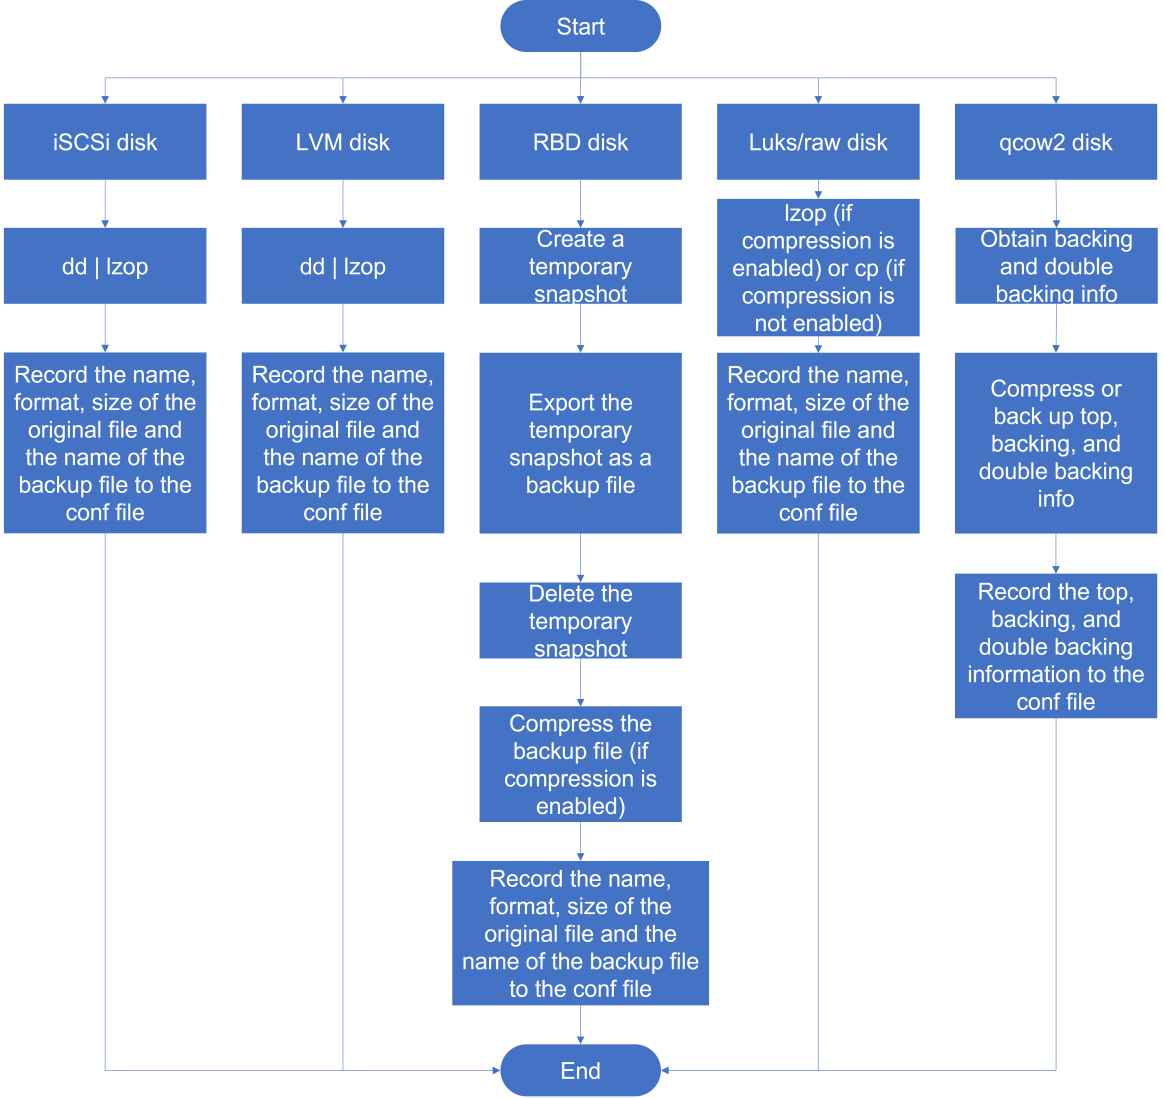
Figure 16 VM backup process with raw/luks/LVM/block devices
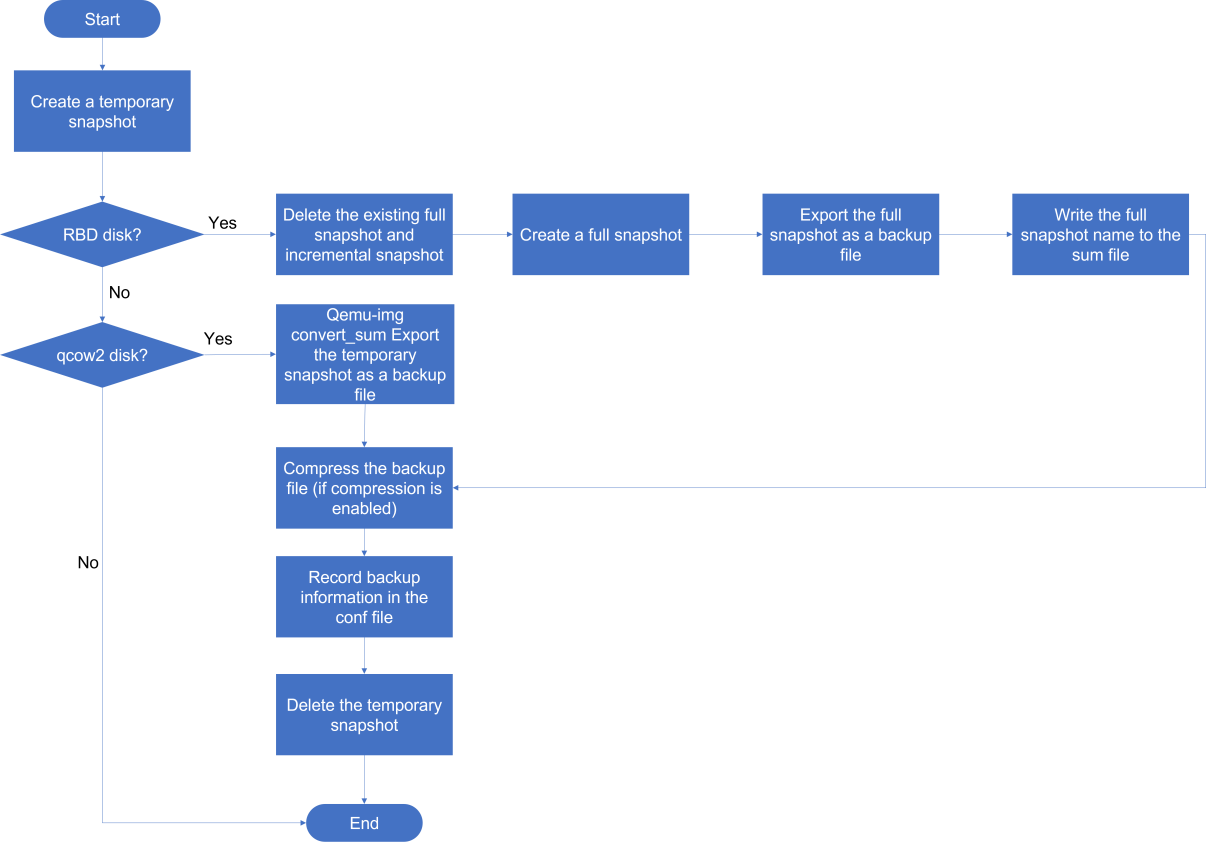
Figure 17 Incremental/differential backup
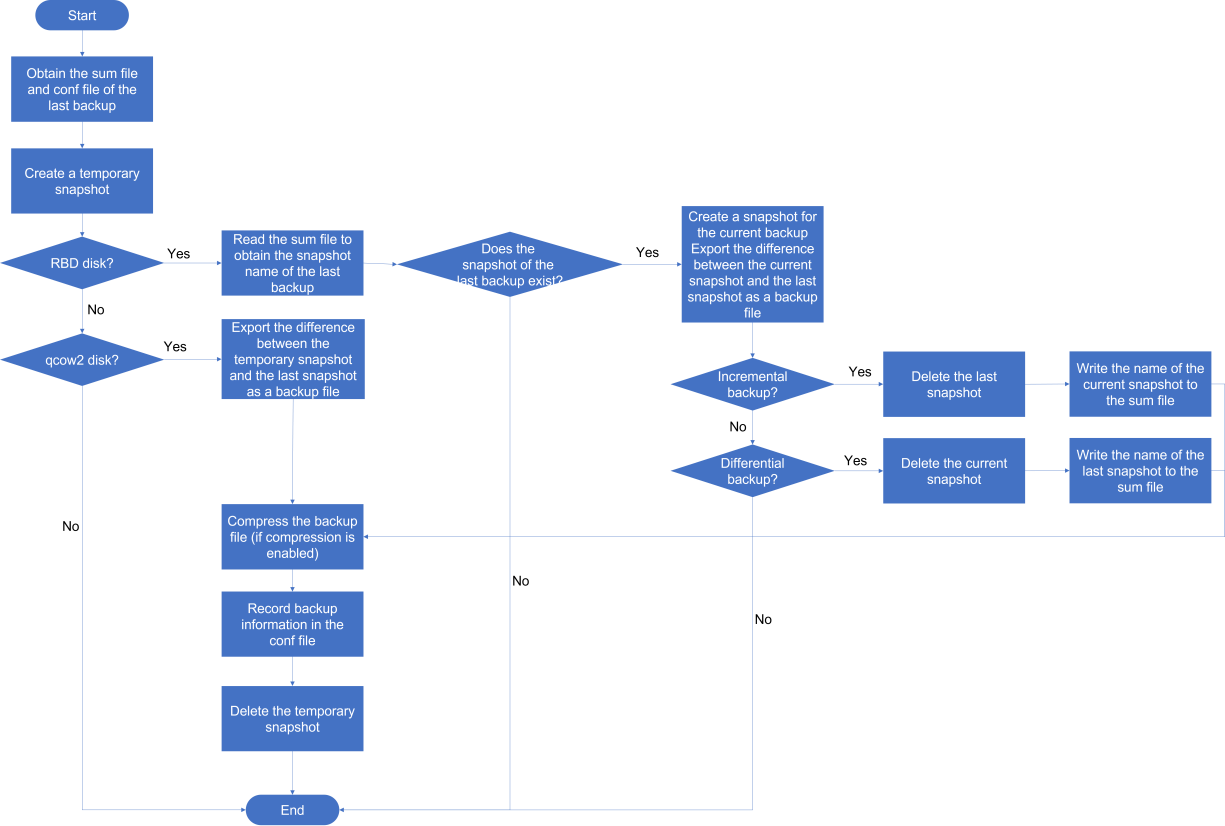
Figure 18 Restoration process
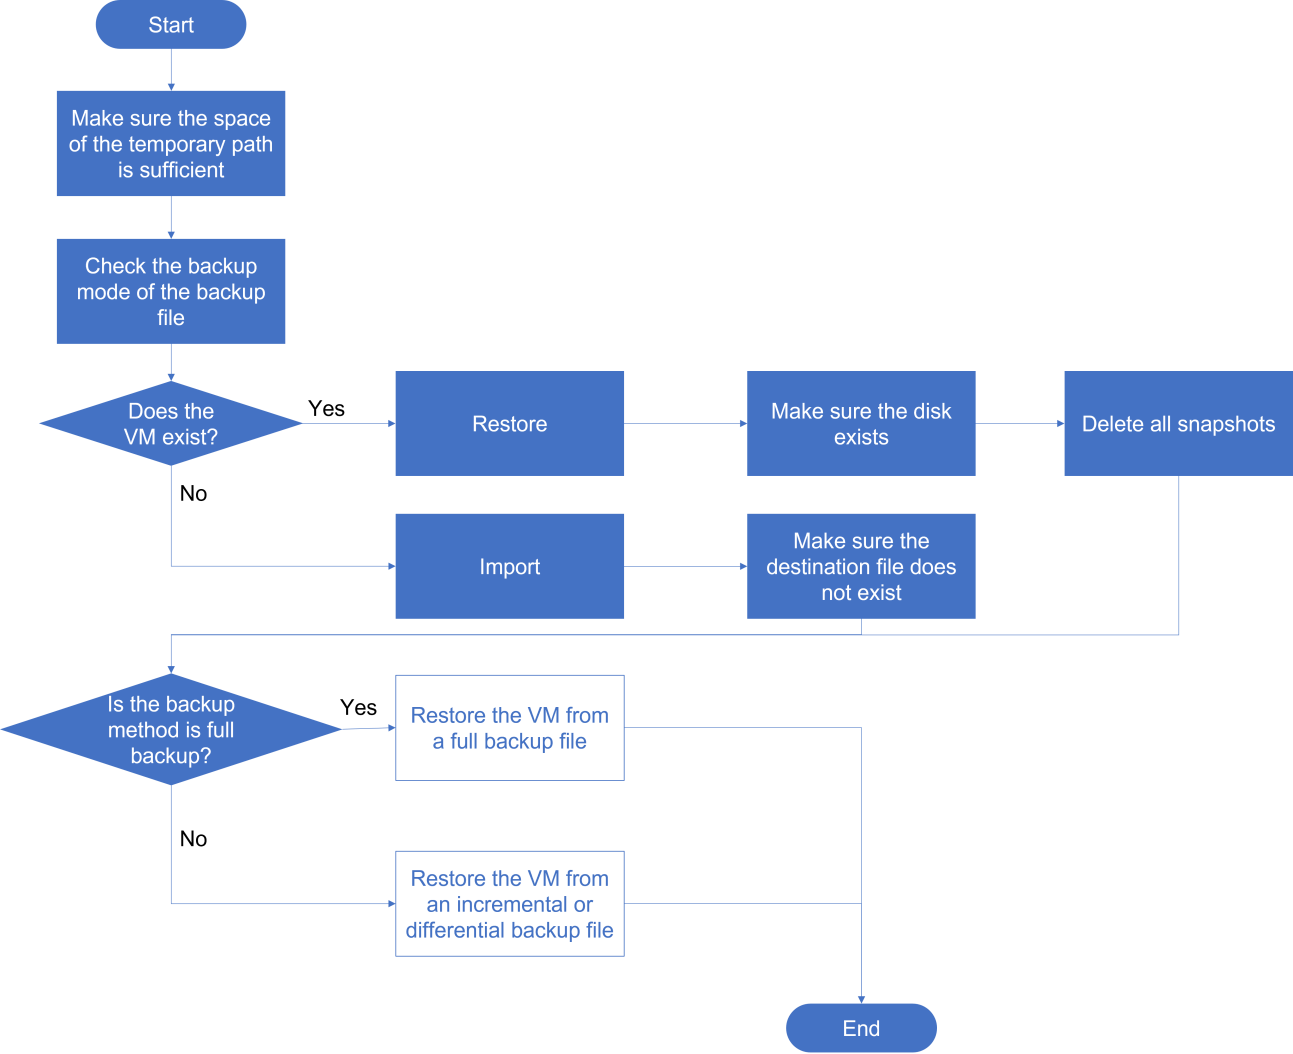
Figure 19 Full backup and restoration process
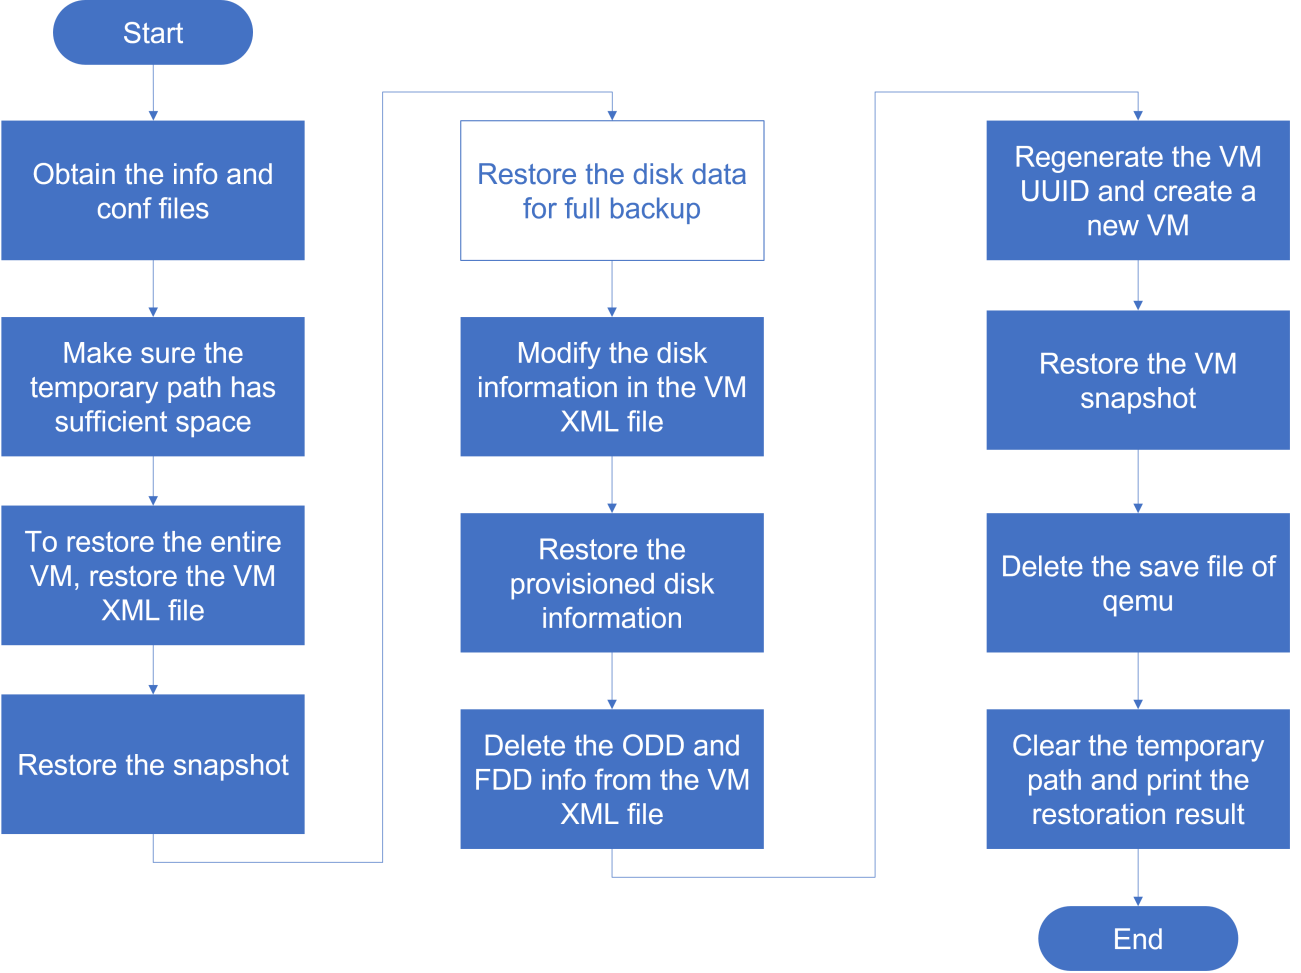
Figure 20 Restoration from a full backup
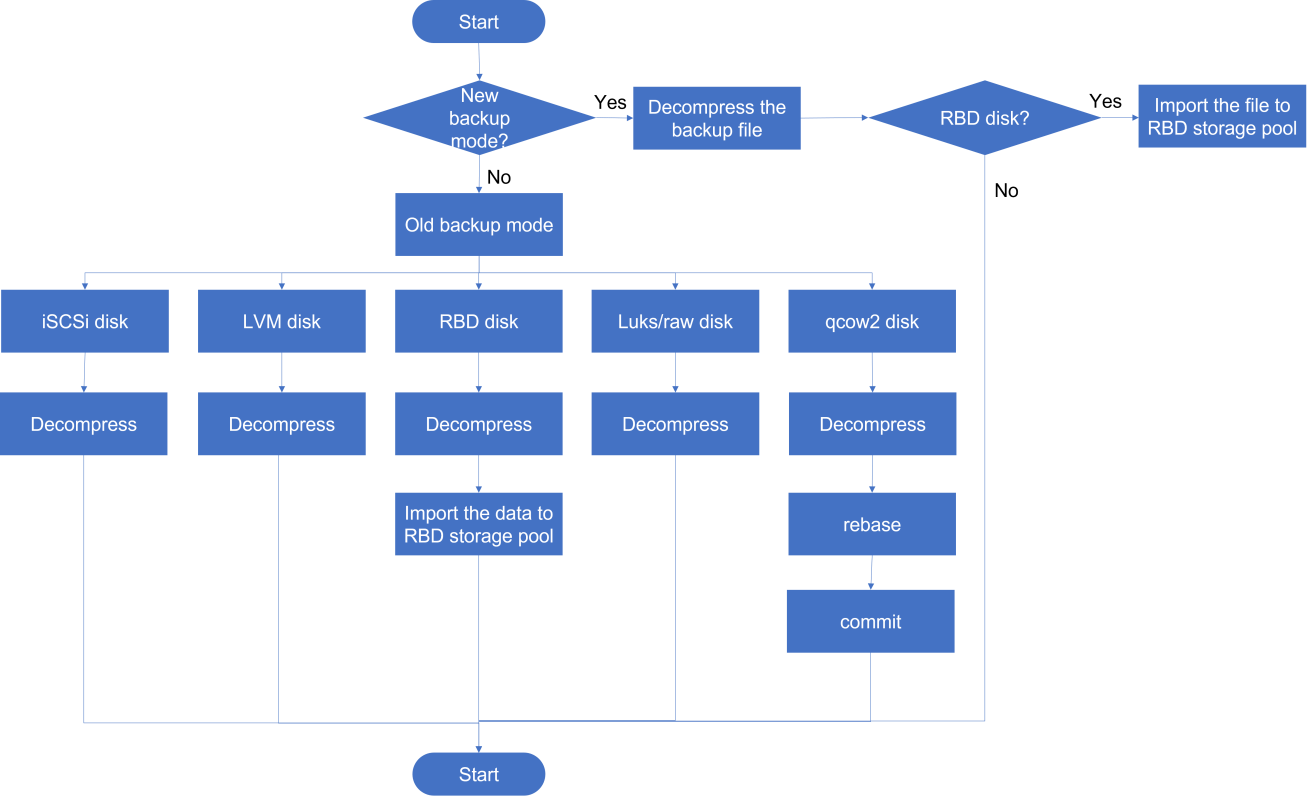
Figure 21 Restoration from an incremental/differential backup
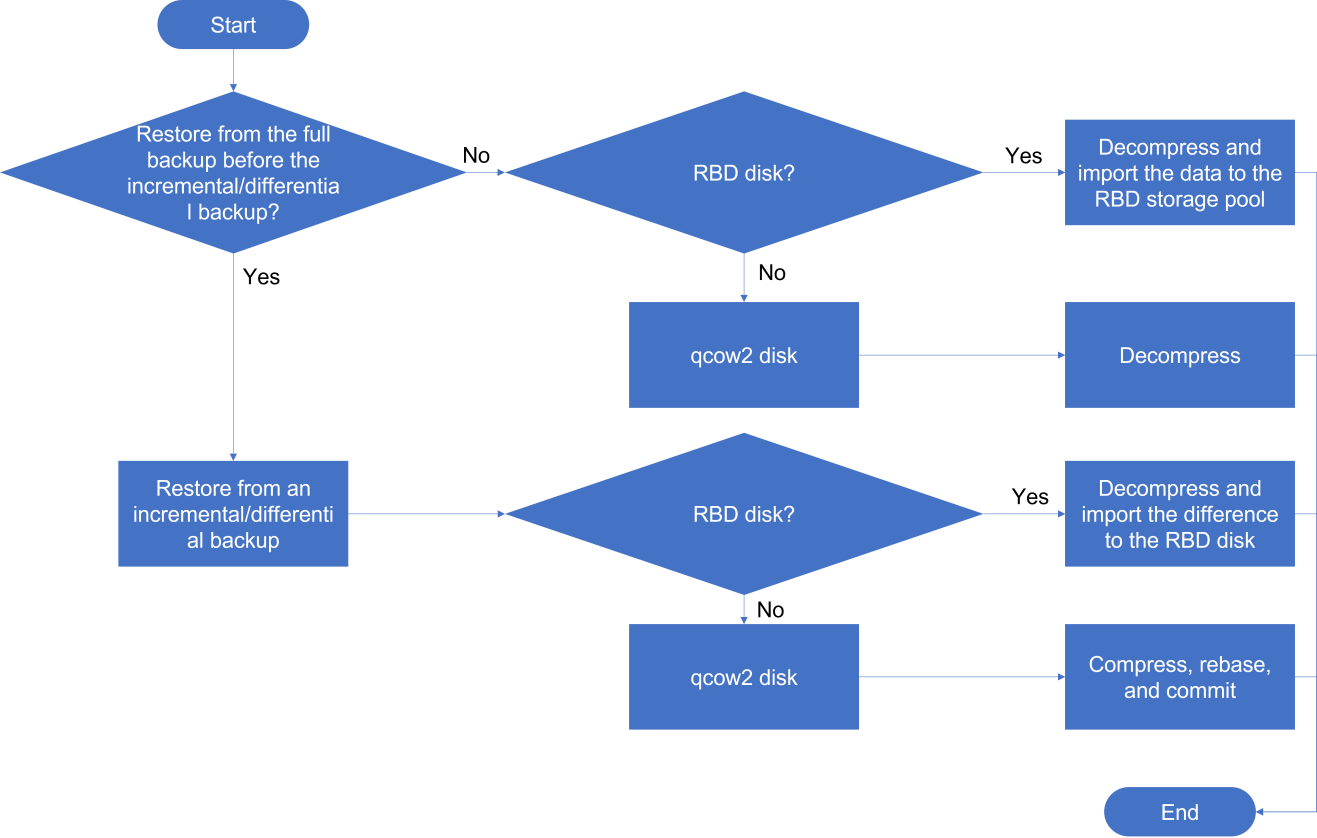
CVM backup process and service management information
The main process for virtual backup is vm_backup.sh. The main process for VM restoration is vm_restore.sh. The main process for VM import is also vm_restore.sh. A process is automatically started when the relevant task is executed.
Common commands
None.
Problem location
The log file is located at /var/log/br_shell_xxx.log, where xxx represents the date and time, consisting of the year and month. To find the initial error causing a failure, check front end error feedback, and then analyze the specific error using information from the log file. The main reasons for VM backup and restoration failure are transmission failure, backup failure, and restoration failure. You can troubleshoot transmission failures by checking network connectivity and parameter settings. For backup failures, check VM status and disk file integrity. To address restore failures, verify backup file validity and ensure proper restore environment setup.
Problem 1: The transmission to the remote end has failed.
Troubleshooting method: Use the FTP/SCP command to connect to the port at the back end and pass files through the put/get or SCP command to check for remote transmission availability.
Problem 2: The task is stuck at 99%.
You can solve the issue by checking whether the VM's disk is too large or whether the backup task is stuck at a process. To confirm, compare the backup time with other normal VMs.
Problem 3: The VM backup task is terminated.
Processing method: Filter the vm_backup.sh task using the ps -ef command to get the process ID. Then, use the pstree command to find its child processes, kill the last one, and wait for 1 minute. Check whether the vm_backup.sh process is still running. If it is, end it. If the frontend task is still running, restart Tomcat to clear it. Be cautious not to disrupt other tasks, as restarting Tomcat clears all existing frontend tasks.
Problem 3: The VM restore task is terminated.
The processing method is the same as that for problem 3, but with the process to be filtered is vm_restore.sh.
Restrictions and guidelines
None.
Storage management
OCFS2
OCFS2 operating mechanism
OCFS2 is a cluster file system based on shared disks, equivalent to file systems like ext4. It is commonly used for sharing storage resources among cluster nodes, allowing concurrent access to different files on the same storage resource. In virtualized environments, OCFS2 provides storage services for online migration and virtual machine migration. It also provides excellent file access services for other similar scenarios.
Since OCFS2 is a cluster file system, it is essential to use a cross-node lock to ensure coordination among multiple nodes. In the current CAS environment, two types of cluster locks are supported: the open-source DLM lock and the H3C-proprietary disk lock.
The DLM lock is a distributed lock that exchanges lock information through a TCP network established between cluster nodes. When a management network error occurs, the cluster lock is usually blocked. After the management network is restored or a node leaves the cluster domain, the blockage is resolved.
The disk lock is an H3C-proprietary cluster lock based on storage network, with lock information saved on the disk. It relies on the management network for acceleration while ensuring the lock function is not affected by network errors. In this way, the disk lock prevents management network issues from blocking the cluster.
OCFS2 process and service management information
The involved processes and services are as follows:
1. User mode services: o2cb and fsm_core.
The o2cb service is the cluster service structure for OCFS2. OCFS2 can provide cluster services only when o2cb is running properly. You can query information about the module mounting, heartbeat timeout threshold, network timeout duration, fencing mode, etc. For example:
root@cvknode02:~# service o2cb status
Driver for "configfs": Loaded
Filesystem "configfs": Mounted
Stack glue driver: Loaded
Stack plugin "o2cb": Loaded
Driver for "ocfs2_dlmfs": Loaded
Filesystem "ocfs2_dlmfs": Mounted
Checking O2CB cluster "pool": Online
Heartbeat dead threshold: 61
Network idle timeout: 90000
Network keepalive delay: 10000
Network reconnect delay: 2000
Fence Method: umount
HBIO Type: nonbio
HBIO Retries: 2
HBIO Timeout: 30
Heartbeat mode: Local
Checking O2CB heartbeat: Active
Additionally, the cluster configuration file is: /etc/ocfs2/cluster.conf. The file records the configuration of cluster nodes. In a cluster, the file must be consistent across all nodes. If not, errors such as storage launch failures might occur.
The FSM service is a newly developed user-mode storage pool management service for managing the start and pause of storage pools and recovery of shared file systems after anomaly fencings. This service runs at startup, and the log is saved in the /var/log/fsm directory.
root@cvknode02:~# service fsm_core status
* fsm_core is running.
2. Kernel-mode process
Use the blkid command to obtain the UUID of device dm-0.
# blkid /dev/dm-0
/dev/dm-0:LABEL="o20190904150114" UUID="02652d92-a2d6-4bc3-828d-4cf980db57e6" TYPE="ocfs2"
After the device starts, the following OCFS2-related kernel processes are involved:
root 2952 2 0 Feb06 ? 00:00:00 [o2net]
root 6703 2 0 Feb21 ? 00:00:15 [o2hb-02652D92A2]
root 7721 2 0 Feb21 ? 00:00:00 [ocfs2_wq-02652D]
root 7722 2 0 Feb21 ? 00:00:00 [ocfs2dc-02652D9]
root 7723 2 0 Feb21 ? 00:00:02 [dlm_thrd-02652D]
root 7724 2 0 Feb21 ? 00:00:01 [dlm_reco-02652D]
root 7725 2 0 Feb21 ? 00:00:00 [dlm_wq-02652D92]
root 7733 2 0 Feb21 ? 00:00:00 [ocfs2cmt-02652D]
root 2796 2 0 Feb06 ? 00:00:00 [user_dlm]
The device UUID starts with 02652D.
In these processes:
The o2net process manages the cluster network kernel.
The user_dlm process is used for processing DLM lock requests of the user-mode space and starts when the dlmfs module is mounted.
The o2hb process is the heartbeat process. It starts first when the storage pool is mounting and exits after unmounting.
After the heartbeat check passes, the dlm- and ocfs2-related processes providing services will start.
Commonly used commands for troubleshooting
Commonly used commands and scripts for troubleshooting are as follows:
1. service o2cb offline/unload/online
Use the command to stop, uninstall, or load the OCFS2 driver. To use the command, make sure the current CVK does not have any active shared file systems.
To activate the shared storage pool, make sure the o2cb service is online.
2. debugfs.ocfs2
debugfs.ocfs2 --help
debugfs.ocfs2 1.8.4
usage: debugfs.ocfs2 -l [<logentry> ... [allow|off|deny]] ...
usage: debugfs.ocfs2 -d, --decode <lockres>
usage: debugfs.ocfs2 -e, --encode <lock type> <block num> <generation|parent>
usage: debugfs.ocfs2 [-f cmdfile] [-R request] [-i] [-s backup#] [-V] [-w] [-n] [-?] [device]
-f, --file <cmdfile> Execute commands in cmdfile
-R, --request <command> Execute a single command
-s, --superblock <backup#> Open the device using a backup superblock
-i, --image Open an o2image file
-w, --write Open in read-write mode instead of the default of read-only
-V, --version Show version
-n, --noprompt Hide prompt
-?, --help Show this help
Use the command to check the state and running status of the currently active shared file system.
Check heartbeat status:
debugfs.ocfs2 -R "hb" /dev/dm-0
Identify whether the active storage pool has any lock blockages:
debugfs.ocfs2 -R "fs_locks -B" /dev/dm-0
Execute the command on the owner node to view the status information of the lock:
debugfs.ocfs2 -R "dlm_locks M0000000000000008dc010400000000" /dev/ dm-0
View the status information of inode:
debugfs.ocfs2 -R "stat filename" /dev/ dm-0
View the usage guide and parameters of commands:
debugfs.ocfs2 -R "help" /dev/ dm-0
Identify whether the DEBUG log level of the current OCFS2 kernel module is enabled:
debugfs.ocfs2 -l
Enable the DEBUG log level for the DLM module of the OCFS2 kernel module.
debugfs.ocfs2 -l DLM allow
Disable the DEBUG log level for the DLM module of the OCFS2 kernel module.
debugfs.ocfs2 -l DLM off
3. fsck.ocfs2
Usage: fsck.ocfs2 {-y|-n|-p} [ -fGnuvVy ] [ -b superblock block ]
[ -B block size ] [-r num] device
Critical flags for emergency repair:
-n Check but don't change the file system
-y Answer 'yes' to all repair questions
-p Automatic repair (no questions, only safe repairs)
-f Force checking even if file system is clean
-F Ignore cluster locking (dangerous!)
-r restore backup superblock(dangerous!)
Less critical flags:
-b superblock Treat given block as the super block
-B blocksize Force the given block size
-G Ask to fix mismatched inode generations
-P Show progress
-t Show I/O statistics
-tt Show I/O statistics per pass
-u Access the device with buffering
-V Output fsck.ocfs2's version
-v Provide verbose debugging output
-S Only output filesystem super information
Use the command to check and repair the file system.
4. Script: ocfs2_kernel_stat_collect.sh
The script runs without requiring parameters. It can be used to collect information about process blocking stacks on hosts, network message blocking, and file system DLM lock blocking. After running the script, a file collecting status information will be generated in the /var/log directory. For example, if the host name is cvknode02, running the script will generate the file:
/var/log/cvknode02_ocfs2_kernel_state_202002251742.log
202002251742 is the time when the script was executed.
5. Script: ocfs2_debug_cluster_runtime_state_collect.sh
root@cvknode02:~# ocfs2_debug_cluster_runtime_state_collect.sh --help
SHELL NAME: ocfs2_debug_cluster_runtime_state_collect.sh
Description: Collect ocfs2 cluster runtime state and persist them into files,
including ocfs2/o2hb/o2dlm/o2net and uninterruptable processes state
Parameter:
-h: Show help message
--all: Collect ocfs2/o2hb/o2dlm/o2net and uninterruptable process state.
Output: /var/log/ocfs2_cluster_runtime_state-<cluster_name>_<time_stamp>.diag.tar.bz2
--process: Only collect uninterruptable processes state, however, those processes may have no relation with ocfs2.
Output: /var/log/<host_name>_ocfs2_debug_hungup_process_<time_stamp>
-p: Same as --process
-s: Directly print to standard output, only valid with –process
Use the script to collect blocked process information for a single host (using parameter: -p) and to collect cluster status information (using parameter: --all).
Log analysis: identify and locate common issues
1. Corresponding log location and log file name.
/etc/cvk/util_cvk_log.conf: Configuration file for log levels of modules.
/var/log/ocfs2_shell_*.log: Logs generated after executing the OCFS2 script.
/var/log/syslog、kern.log: System logs. When a file system error occurs, you can view kernel-related logs in this file.
/Var/log/fsm/fsm_core.log: Storage pool management logs after using the FSM service to manage the storage pools.
2. Common issues
Issue 1: Host is stuck, cluster is blocked, and foreground virtual machines are in abnormal states.
First execute the script ocfs2_kernel_stat_collect.sh to collect the status information of the host. Identify whether any process blockages or lock blockages occur.
If a lock is blocked, follow the lock blockage troubleshooting process.
If a process is blocked, view the blocked process stack to identify whether an I/O blockage occurs. If yes, check the link or storage service.
This script collects the process state at the time of executing the command. If the issue is caused by slow I/O or slow management network, the blockage is only temporary. To avoid this impact, execute the script again after a while. If a temporary process issue reduces the cluster performance, check the storage service and link.
Issue 2: Storage startup fails.
Foreground storage startup fails. Solve the issue according to the provided reason. If the reason cannot be processed, locate the issue as follows:
Ensure storage availability by checking the storage and link. View /var/log/ocfs2_shell*.log or /var/log/fsm/fsm_core.log to identify whether any error occurs. When starting storage, use the foreground command to execute ocfs2 storage-related script. View the script log to find the reason.
Issue 3: Shared file system fencing occurs unexpectedly and triggers migration of upper-level virtual machines.
Identify the reason for the file system fencing. View /var/log/syslog and search for key log o2quo_insert_fault_type. In the search results, identify the cause for the fencing according to logs aroung the time of the key log. Currently, three types of fencing methods are supported: TCP fencing for management network issues, DISK fencing for storage access timeout, and DISK IO fencing for file system issues. For example:
root@cvknode02:~# grep -in "o2quo_insert_fault_type" /var/log/syslog*
/var/log/syslog.22:273:Jan 11 10:13:41 cvknode02 kernel: [167072.677628] (kworker/1:1,72,1):o2quo_insert_fault_type:202 File system(C7A4A699F63544CFAEB03A487050E04C) is suffering fault(1:DISK fault leading to being fenced)
By examining the context of the fault log, it can be confirmed that the fence reason is storage I/O timeout. Check the storage link or storage.
Issue 4: Shared file system is read-only.
A host going down, restarting, or storage access issues during the file system operation can cause the file system to become read-only. To protect the data from further corruption, a read-only mechanism is triggered, which is a common feature in file systems like ext4. After the file system becomes read-only, you can repair it by pausing the access node and using the fsck.ocfs2 command. For more information, see the file system repair manual.
Restrictions and guidelines
Before using fsck.ocfs2 command to repair a storage pool, make sure the storage service is paused on all nodes.
FSM
Operating mechanism
FSM optimizes CAS management of storage pools by transferring some management functions from Libvirt to FSM, such as the auto-start function for abnormal storage pools.
It improves the maintainability, scalability, and ease of use of the storage subsystems, and decouples related services from subsystems. FSM decouples the following services from Libvirt: Self-startup of storage pools upon power-on, fault detection, continuous restart, examine before storage pool startup. It also refreshes interfaces for storage pools.
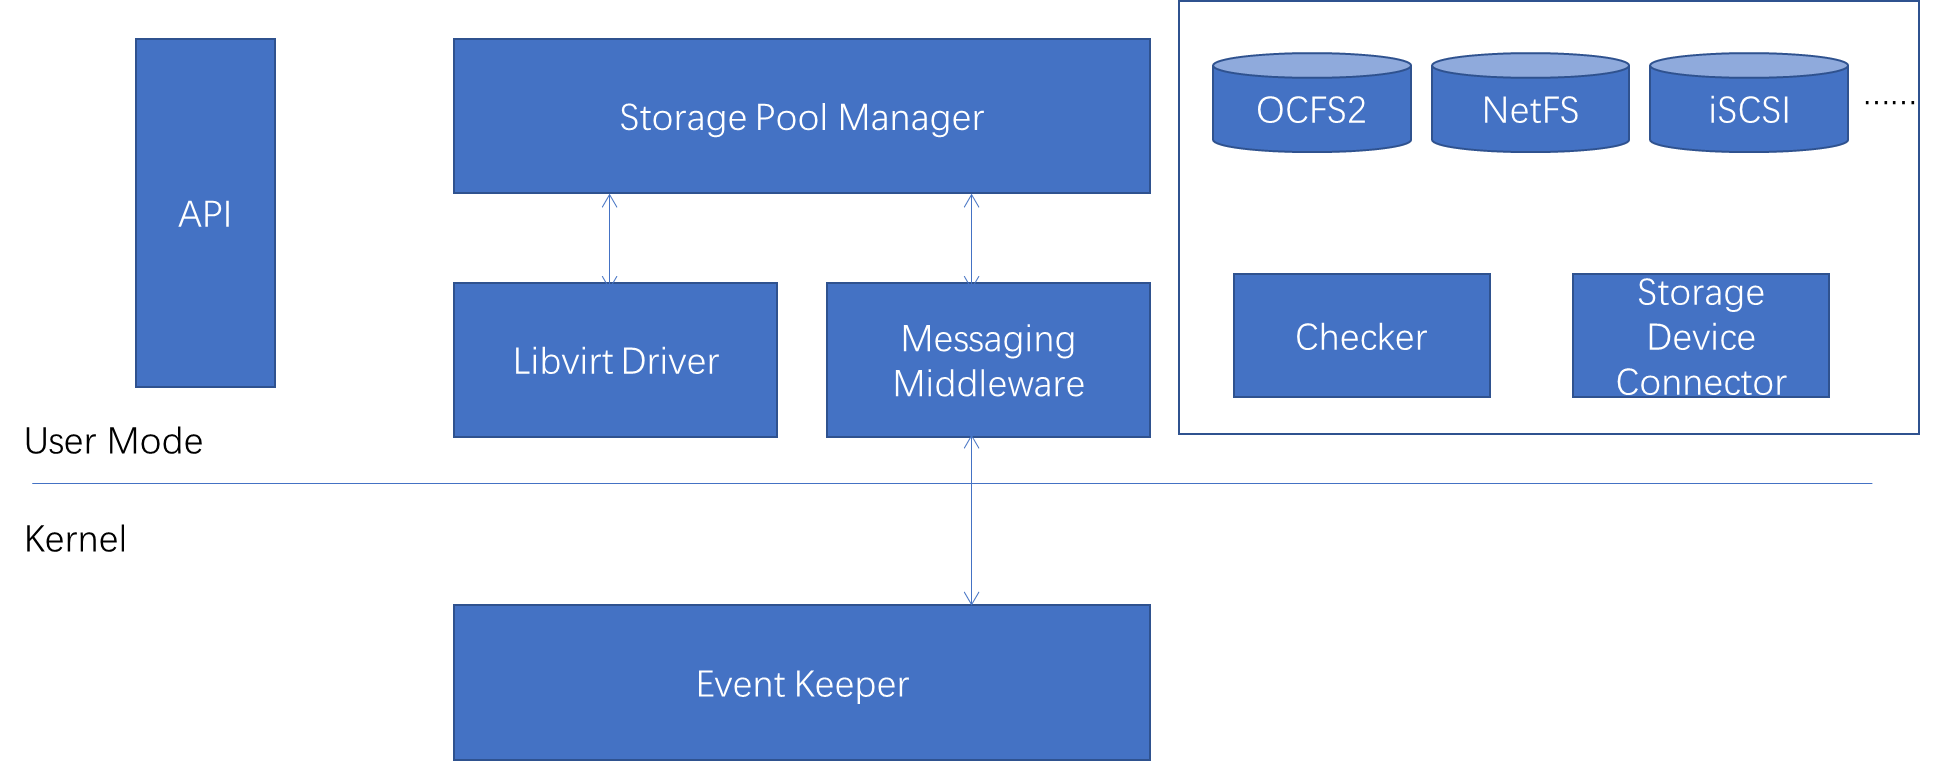
Commonly used commands of FSM
FSM storage pool service is provided through a REST-style API for external use. CLI commands are encapsulated in the back-end based on the API.

Troubleshooting
An example of failure to automatically restart after storage pool recovery.
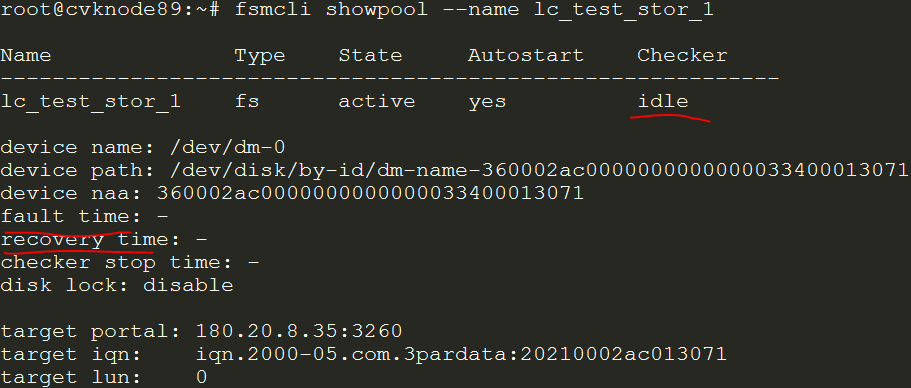
Analyze the log to determine the cause of the failure:
pool="lc_test_stor_1";grep -E "$pool received a event fence_umount|Pool $pool was started|$pool received a event recovery|Activate pool $pool failed|is accessing /vms/$pool|Restore pool $pool|Pool $pool is trying to recovery|Update state of $pool" /var/log/fsm/fsm_core.log
Managing LVM
LVM operating mechanism
LVM combines multiple physical disks, and then divides them into logical volumes for use.
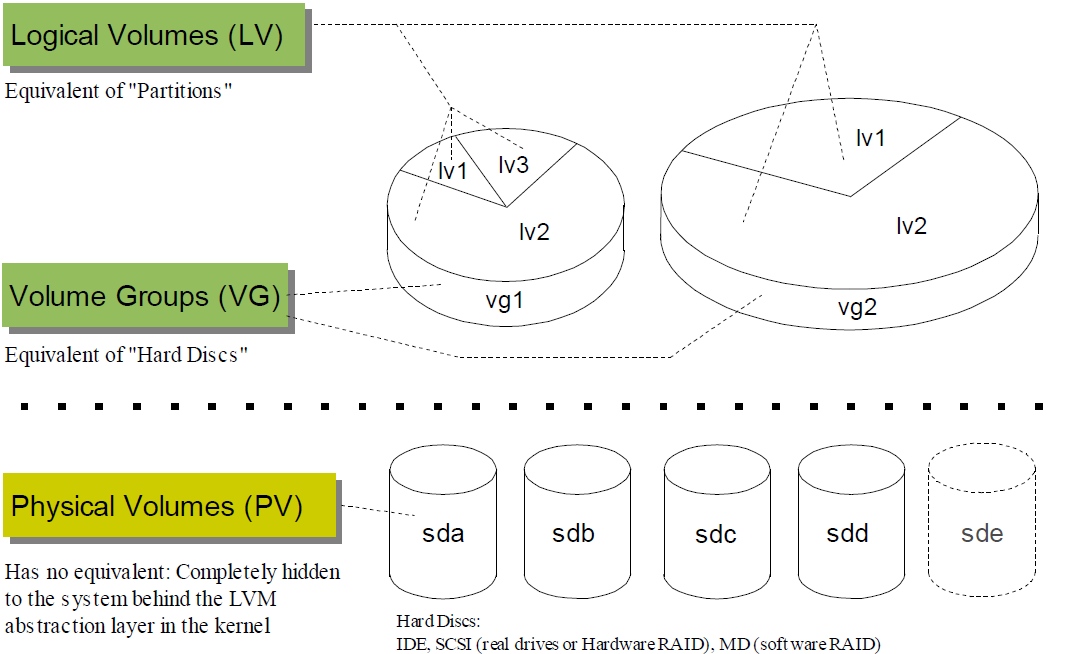
You can configure CAS to use LVM logical volumes in one of the following methods:
· Install the system in the form of LVM during the installation of the CAS system disk.
· Configure CVK to use external storage by first allocating LUN to CVK, and then creating LVM logical volumes on CVK. LVM logical volumes provide storage services for virtual machines.
· Configure virtual machines to use raw blocks and to internally divide the disk raw blocks into LVM logical volumes for internal use. From the outside of the CVK, it appears as in the LVM form.
As a best practice, first set up multipath for raw blocks, and then create LVM logical volumes for virtual machines to use.
Processes and commands
The commonly used commands for LVM are as follows. You can use the man command, or search for the specific command usage online.
The red-colored commands are commonly used commands and their description.
pvchange Change attributes of a physical volume.
pvck Change physical volume metadata.
pvcreate Initialize a disk or partition for use by LVM.
pvdisplay Display attributes of a physical volume.
pvmove Move physical extents.
pvremove Remove a physical volume.
pvresize Resize a disk or partition in use by LVM2.
pvs Report information about physical volumes.
pvscan Scan all disks for physical volumes.
vgcfgbackup Backup volume group descriptor area.
vgcfgrestore Restore volume group descriptor area.
vgchange Change attributes of a volume group.
vgck Check volume group metadata.
vgconvert Convert volume group metadata format.
vgcreate Create a volume group.
vgdisplay Display attributes of volume groups.
vgexport Make volume groups unknown to the system.
vgextend Add physical volumes to a volume group.
vgimport Make exported volume groups known to the system.
vgimportclone Import and rename duplicated volume group (e.g. a hardware snapshot).
vgmerge Merge two volume groups.
vgmknodes Recreate volume group directory and logical volume special files
vgreduce Reduce a volume group by removing one or more physical volumes.
vgremove Remove a volume group.
vgrename Rename a volume group.
vgs Report information about volume groups.
vgscan Scan all disks for volume groups and rebuild caches.
vgsplit Split a volume group into two, moving any logical volumes from one volume group to another by moving entire physical volumes.
lvchange Change attributes of a logical volume.
lvconvert Convert a logical volume from linear to mirror or snapshot.
lvcreate Create a logical volume in an existing volume group.
lvdisplay Display attributes of a logical volume.
lvextend Extend the size of a logical volume.
lvmchange Change attributes of the logical volume manager.
lvmdiskscan Scan for all devices visible to LVM2.
lvmdump Create lvm2 information dumps for diagnostic purposes.
lvreduce Reduce the size of a logical volume.
lvremove Remove a logical volume.
lvrename Rename a logical volume.
lvresize Resize a logical volume.
lvs Report information about logical volumes.
lvscan Scan (all disks) for logical volumes.
In the CentOS version of the CAS system, LVM has a back-end process called lvmetad. This process caches LVM's metadata to prevent LVM commands from scanning the disk again. It directly obtains metadata from the cache, improving performance.
LVM configuration and log analysis
The configuration directory for LVM is /etc/lvm. The configuration file lvm.conf describes the parameters, including the log location, filtering rules.
Restrictions and guidelines
To configure LVM storage pools, first perform back-end operations, then set up the LVM logical volumes on the user interface, and finally make them available for virtual machines to use. If the disk to use is from centralized storage, to avoid disk damage, prevent multiple virtual machines from sharing the same LUN.
When allocating LVM volumes for virtual machines, plan for disaster recovery and backup to prevent the negative impact of disk damage. You can back up data from the service layer within the virtual machine.
Configuring iSCSI
iSCSI operating mechanism
iSCSI uses the IP layer to carry SCSI commands and adopts a Server-Client mode. The CVK server, acting as a client, connects to the storage system through the standard 3260 port on the storage server. The storage system must be configured with relevant data access permissions for the client initiator.
Figure 22 A small-scale IP-SAN storage access model
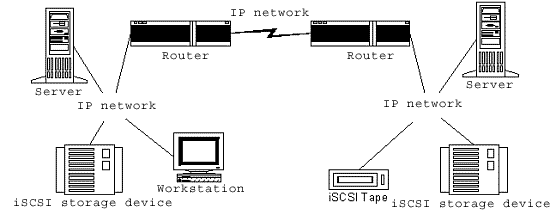
Figure 23 iSCSI protocol model
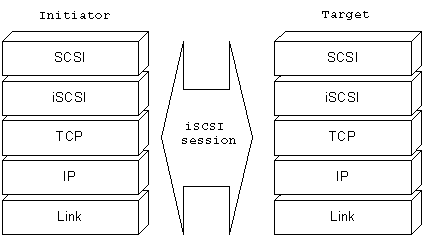
Considering the redundancy of multiple links, a typical network is as follows:
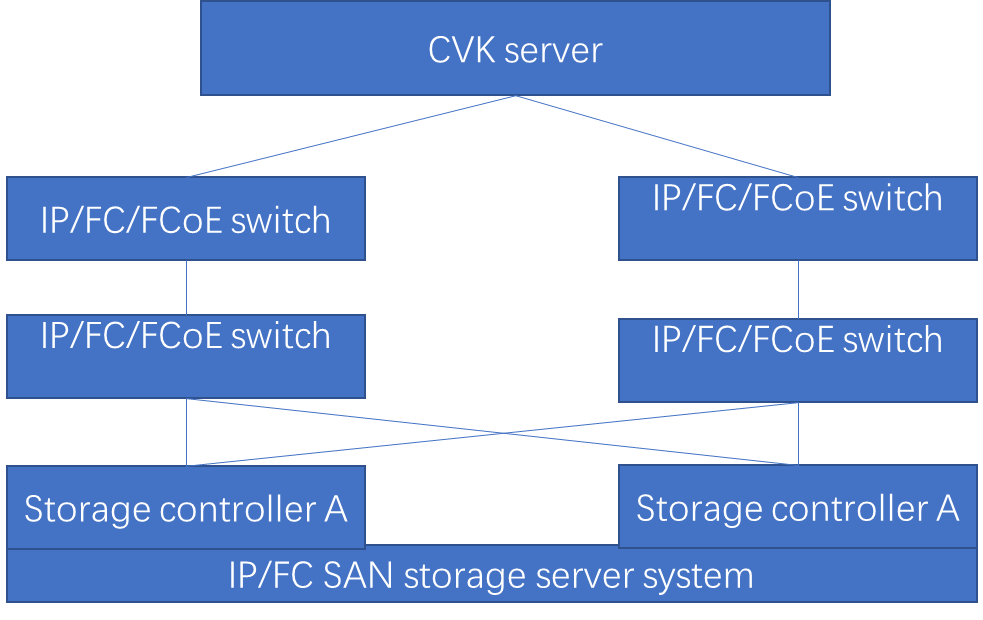
1. Partition LUN in the storage system.
2. Set the initiator name for the CVK server, and associate it with the access permissions to LUN.
3. Configure the related storage pools on the CAS configuration interface.
On CAS, you can configure storage pools of OCFS2 shared file system and iSCSI network storage (raw block) based on iSCSI.
iSCSI processes and configuration files
On Ubuntu, the service is open-iscsi, while on CentOS, it is the systemctl status iscsid service.
root 7038 2 0 Mar03 ? 00:00:00 [iscsi_eh]
root 7047 1 0 Mar03 ? 00:00:01 /usr/sbin/iscsid
root 7048 1 0 Mar03 ? 00:00:05 /usr/sbin/iscsid
The /etc/iscsi/iscsid.conf file is used to configure the parameters for iscsid. For more information, see the comment section.
The /etc/iscsi/initiatorname.iscsi is used to configure the initiator name on the client-side of the CVK server. Configure this name in the storage host and associate it with the access permissions to LUN.
You can manage the CVK server's InitiatorName on the CAS configuration platform and modify its open-iscsi configuration identifier. If you modify it on the back-end, restart the open-iscsi service.
Each LUN on the storage array needs to be associated with a specific client CVK for the CVK server to access the corresponding LUN.
Commonly used commands
For CAS to access IP SAN/iSCSI storage,
make sure the following conditions exist:
The CAS server have a reachable route to the storage server.
The storage server is configured with appropriate access permissions, allowing
the CVK server to read and write the corresponding LUN.
Commonly used commands include discovery, login, logout, and session. You can try other iscsiadm commands.
1. Discovery the target.
~# iscsiadm -m discovery -t st -p 192.168.0.42
192.168.0.42:3260,1 iqn.2003-10.com.lefthandnetworks:group-4330-2:16908:cas-001
192.168.0.42:3260,1 iqn.2003-10.com.lefthandnetworks:group-4330-2:16486:cas-002
192.168.0.42 is the IP address of the storage device.
2. Log in to the target.
~# iscsiadm -m node -T iqn.2003-10.com.lefthandnetworks:group-4330-2:16486:cas-002 -p 192.168.0.42 -l
Logging in to [iface: default, target: iqn.2003-10.com.lefthandnetworks:group-4330-2: 16486:cas-002, portal: 192.168.0.42,3260] (multiple)
Login to [iface: default, target: iqn.2003-10.com.lefthandnetworks:group-4330-2: 16486:cas-002, portal: 192.168.0.42,3260] successful.
Iqn.2003-10.com.lefthandnetworks:group-4330-2:16486:cas-002 --- Discover the target name by using the discovery command.
192.168.0.42 --- IP address of the storage device.
3. View the session and its corresponding disk.
~# iscsiadm -m session
tcp: [2] 192.168.0.42:3260,1 iqn.2003-10.com.lefthandnetworks:group-4330-2:16486: cas-002
After logging in to the target, the device name generated in the /dev/disk/by-path directory is in the ip-ip_address:port- target_name-lun-# format.
~# ls -al /dev/disk/by-path/*cas-002*
lrwxrwxrwx 1 root root 9 Nov 6 15:56 /dev/disk/by-path/ip-192.168.0.42:3260- iscsi-iqn.2003-10.com.lefthandnetworks:group-4330-2:16486:cas-002-lun-0 -> ../../sdb
~# fdisk -l /dev/sdb
Disk /dev/sdb: 10.7 GB, 10737418240 bytes
64 heads, 32 sectors/track, 10240 cylinders, total 20971520 sectors
Units = sectors of 1 * 512 = 512 bytes
Sector size (logical/physical): 512 bytes / 512 bytes
I/O size (minimum/optimal): 512 bytes / 512 bytes
Disk identifier: 0x02020202
Disk /dev/sdb doesn't contain a valid partition table
/dev/sdb: Device name after logging in to the target. Multiple device names might exist.
4. Set and modify the startup attribute.
The purpose of setting the node.startup attribute of the target to automatic is to enable automatic login when the device starts up.
~# iscsiadm -m node -T iqn.2003-10.com.lefthandnetworks:group-4330-2:16486:cas-002 -p 192.168.0.42 --op update -n node.startup -v automatic
To cancel the configuration, set it to manual.
~# iscsiadm -m node -T iqn.2003-10.com.lefthandnetworks:group-4330-2:16486:cas-002 -p 192.168.0.42 --op update -n node.startup -v manual
iqn.2003-10.com.lefthandnetworks:group-4330-2:16486:cas-002: Name of the target that has been logged in.
192.168.0.42: IP address of the storage device.
5. Refresh the session.
If you add or delete LUNs under the target on the storage end, you need to manually refresh on the CAS to discover the changes in the device.
~# iscsiadm -m session -R
Rescanning session [sid: 2, target: iqn.2003-10.com.lefthandnetworks:group-4330-2: 16486:cas-002, portal: 192.168.0.42,3260]
6. Log out from the target.
~# iscsiadm -m node -T iqn.2003-10.com.lefthandnetworks:group-4330-2:16486:fence-opt-002 -p 192.168.0.42 -u
Logging out of session [sid: 2, target: iqn.2003-10.com.lefthandnetworks: group-4330-2:16486:cas-002, portal: 192.168.0.42,3260]
Logout of [sid: 2, target: iqn.2003-10.com.lefthandnetworks:group-4330-2:16486:cas-002, portal: 192.168.0.42,3260] successful.
Iqn.2003-10.com.lefthandnetworks:group-4330-2:16486:cas-002: Name of the target that has been logged in.
192.168.0.42 is the IP address of the storage device.
Log analysis and common issues
The iSCSI log is stored directly in the syslog. You can analyze the connection status through the syslog.
Common issues are as follows:
1. Corresponding LUN cannot be found.
Identify whether the initial name of the associated client is the same on the LUN and the CVK server.
Identify whether the connection between the CVK server and iSCSI storage is available by using the ping command.
Identify whether the iSCSI 3260 port is open for access.
2. IP SAN shared file system cannot start.
If the storage system is configured as read-only, startup failure will occur.
3. Poor performance during the access.
Performance is determined by the performance of the storage server, the bandwidth of the link in the intermediate network, and the stability of the link between the CVK server and the storage system. As a best practice to ensure the bandwidth, use a 10 Gigabit or Gigabit network and 2 NICs. To identify whether packet loss occurs, capture packets on the switch, or use the ifconfig command on the CVK server to check the corresponding NIC.
Before the implementation of services, use performance testing tools to identify settings that can be optimized. Replace links or modify settings of switches and storage servers.
4. When mounting the shared file system, an error occurs stating that the storage system cannot be accessed.
After CVK server fencing or a sudden power-off, errors might occur when you reactivate the storage pool or mount storage services to the host.
For release 3.0 and before, you can use commands to identify whether access is available, and force a scan of the storage adapters on the front-end interface. You can also delete the corresponding iSCSI IP-related file and re-activate the storage pool or re-mount storage services to the CVK server on the front-end interface.
Release 5.0 has been optimized, and theoretically, the probability of this issue is extremely low.
Restrictions and guidelines
iSCSI requires high network stability. When changing the network configuration, consider the impact on iSCSI.
Configuring FC
Typical topology of FC storage access
Typically, the CVK server is connected with FC switches through multiple HBA fibers and the FC switches are connected with the storage controllers through cross-connections.
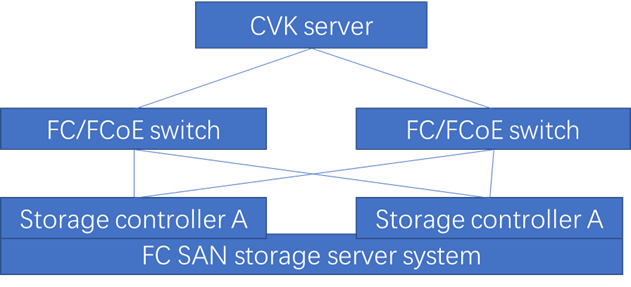
FC storage access redundantly provides storage access paths and enhances high availability, thus reducing service disruptions caused by link issues.
In the CAS management interface, you can view the status of the HBA card, whether it is online, its speed, and other information.
Commonly used commands for checking FC
1. View connection status between HBAs and storage controllers on the CVK server.
You can also view the status of HBAs on the storage adapter tab in the CVK interface. To query the status of HBAs on the back-end, use the following command:
fc_san_get_wwn_info.sh
root@cvknode73:~# fc_san_get_wwn_info.sh
<list><HbaInfo><localNodeName>2000b4b52f54efc1</localNodeName><localPortName>1000b4b52f54efc1</localPortName><status>Online</status><capacity>10 Gbit</capacity><remoteNodeName>10005cdd70d94290 500b342001303700 500b34200121a000 2000fc15b40c36d9 2000fc15b40b7d21 1000a81122334455 2000b4b52f54cf29 20008c7cff65943f 2000b4b52f54afa9 2000fc15b40b1bd1 20009cb654854409 5001438011397750 5001438021e2c74d 5001438021e2cf65</remoteNodeName><remotePortName>20d4aa112233445c 500b342001303706 500b34200121a005 1000fc15b40c36d9 1000fc15b40b7d21 2ffca81122334455 1000b4b52f54cf29 10008c7cff65943f 1000b4b52f54afa9 1000fc15b40b1bd1 10009cb654854409 5001438011397758 5001438021e2c74c 5001438021e2cf64</remotePortName></HbaInfo><HbaInfo><localNodeName>2000b4b52f54efc5</localNodeName><localPortName>1000b4b52f54efc5</localPortName><status>Online</status><capacity>10 Gbit</capacity><remoteNodeName>100000e0dc001200 5001438021e2c74f 500b3420014aad00 500b3420014aab00 2000fc15b40c36dd 2000fc15b40b7d25 100000e0dc001200 2000b4b52f54cf2d 2000b4b52f54afad 20008c7cff6594b7 2000fc15b40b1bd5 20009cb65485440d 20000090fa1a5d14 20008c7cff655c4f 5001438011397750</remoteNodeName><remotePortName>20d400e0dc001207 5001438021e2c74e 500b3420014aad05 500b3420014aab05 1000fc15b40c36dd 1000fc15b40b7d25 2ffc00e0dc001200 1000b4b52f54cf2d 1000b4b52f54afad 10008c7cff6594b7 1000fc15b40b1bd5 10009cb65485440d 10000090fa1a5d14 10008c7cff655c4f 500143801139775d</remotePortName></HbaInfo></list>
Use this command to obtain information about the local HBA card and the connected remote storage HBA card.
The command output above shows that 2 HBAs are found, both in connected status.
By querying the directory, you can view the WWID information of the remote FC controller's HBA card.
root@cvknode73:~# ls -a /dev/disk/by-path/*fc*
/dev/disk/by-path/pci-0000:02:00.2-fc-0x5001438011397758-lun-1 /dev/disk/by-path/pci-0000:02:00.3-fc-0x500143801139775d-lun-1
/dev/disk/by-path/pci-0000:02:00.2-fc-0x5001438011397758-lun-2 /dev/disk/by-path/pci-0000:02:00.3-fc-0x500143801139775d-lun-2
/dev/disk/by-path/pci-0000:02:00.2-fc-0x5001438011397758-lun-3 /dev/disk/by-path/pci-0000:02:00.3-fc-0x500143801139775d-lun-3
The output shows that cvknode73 is connected to the storage controller's HBA with WWN numbers: 5001438011397758 and 500143801139775d.
To view information about the corresponding local HBA card:
root@cvknode73:/sys/class/fc_host# ls -al
total 0
drwxr-xr-x 2 root root 0 Nov 6 14:29 .
drwxr-xr-x 61 root root 0 Nov 6 14:29 ..
lrwxrwxrwx 1 root root 0 Nov 6 14:29 host1 -> ../../devices/pci0000:00/0000:00:03.0/0000:02:00.2/host1/fc_host/host1
lrwxrwxrwx 1 root root 0 Nov 6 14:29 host2 -> ../../devices/pci0000:00/0000:00:03.0/0000:02:00.3/host2/fc_host/host2
root@cvknode73:/sys/class/fc_host# cd host1/
root@cvknode73:/sys/class/fc_host/host1# ls
active_fc4s fabric_name max_npiv_vports port_id port_type statistics supported_fc4s tgtid_bind_type vport_delete
device issue_lip node_name port_name power subsystem supported_speeds uevent
dev_loss_tmo maxframe_size npiv_vports_inuse port_state speed supported_classes symbolic_name vport_create
root@cvknode73:/sys/class/fc_host/host1# cat port_name
0x1000b4b52f54efc1
The analysis above shows that HBA card 0x1000b4b52f54efc1 is connected to the storage HBA card 5001438011397758. The other HBA card establishes an FC channel with another HBA, without any cross-connection. Two paths exist.
2. View the NAA information of LUNs accessible by the CVK server.
Use the fc_san_get_naa_wwid.sh command to view the LUN information list on the storage system that the local CVK node can access and query.
root@cvknode73:/sys/class/fc_host/host1# fc_san_get_naa_wwid.sh
<source><lun_info><naa>36001438009b051b90000a000017a0000</naa><capacity>24696061952</capacity><vendor>HP</vendor><model>HSV340</model></lun_info><lun_info><naa>36001438009b051b90000600000970000</naa><capacity>354334801920</capacity><vendor>HP</vendor><model>HSV340</model></lun_info><lun_info><naa>36001438009b051b90000600002780000</naa><capacity>322122547200</capacity><vendor>HP</vendor><model>HSV340</model></lun_info></source>
Use the command to obtain the NAA list of LUNs accessible by the CVK server, the capacity of LUNs, the storage model, and the supplier name.
3. Refresh the local HBA.
You can also manually scan HBA information on the user interface. To refresh HBA information on the back-end, use the following command:
fc_san_hba_scan.sh -h
NAME
/opt/bin/fc_san_hba_scan.sh.x - Cause the HBA rescan
SYNOPSIS
/opt/bin/fc_san_hba_scan.sh.x [ -h ] [0|1] [hba_name]
DESCRIPTION
-h Help
refresh_type: Optional. 0 --- normal refresh, 1 --- forcely_refresh, default 0.
hba_name: Optional. The WWPN of the HBA, if not specified, refresh all.
Use the command to rescan the LUN information in the storage system after changing the association between LUNs and hosts. Support for the command varies by storage model. Some older storage models might not support it.
When a LUN cannot be added to a shared storage pool on the user interface, check the storage configuration and perform a scan again to discover the added LUN.
4. View the connection status with the remote controller.
root@cvknode73:~# ls -al /dev/disk/by-path/*fc*
lrwxrwxrwx 1 root root 9 Oct 27 10:55 /dev/disk/by-path/pci-0000:02:00.2-fc-0x5001438011397758-lun-1 -> ../../sdb
lrwxrwxrwx 1 root root 9 Oct 27 10:55 /dev/disk/by-path/pci-0000:02:00.2-fc-0x5001438011397758-lun-2 -> ../../sdc
lrwxrwxrwx 1 root root 9 Oct 27 10:55 /dev/disk/by-path/pci-0000:02:00.2-fc-0x5001438011397758-lun-3 -> ../../sdd
lrwxrwxrwx 1 root root 9 Oct 27 10:55 /dev/disk/by-path/pci-0000:02:00.3-fc-0x500143801139775d-lun-1 -> ../../sde
lrwxrwxrwx 1 root root 9 Oct 27 10:55 /dev/disk/by-path/pci-0000:02:00.3-fc-0x500143801139775d-lun-2 -> ../../sdf
lrwxrwxrwx 1 root root 9 Oct 27 10:55 /dev/disk/by-path/pci-0000:02:00.3-fc-0x500143801139775d-lun-3 -> ../../sdg
By querying the directory under /dev/disk/by-path/*fc* and the PCI information of HBA in /sys/class/fc_host, you can identify which HBA card on the storage side is connected to the current CVK server.
5. Collect the current FC configuration log information and send it to R&D for analysis.
Execute the fc_san_info_collector.sh command to collect configuration and communication information of the current FC. The system automatically generates an FC information collection file fc_san_info.tar.gz.
Restrictions and guidelines for FC
1. Make sure the switch has a one-to-one port zone between the server and the control HBA.
Configure a separate zone on the FC switch for the HBA card of the CVK server and the wwn of the controller's HBA. This reduces the impact between different HBAs and controllers.
You can also configure a port zone. The switch configuration varies by vendor. Please refer to the specific switch configuration of the relevant vendor.
Configure a small zone for the one-to-one wwn. It cannot be placed in a larger default zone.
2. Cross-connected FC fiber optics.
As a best practice to redundantly provide storage access paths, establish cross-connections between the CVK server and the switch, and the switch connects and the controller. In this way, when multipath is enabled, if one path goes down, the server can still access storage. This ensures the stable operation of the client's services.
3. CAS HA clusters cannot access multiple groups of LUNs.
On CAS, each HA cluster can access only one group of LUNs. This minimizes risks by avoiding mutual interference.
4. Enable multipath when using FC storage.
By default, multipath is enabled for the system. Multipath can redundantly provide paths, which enhances the system's ability to cope with link faults, ensuring the stability of services.
5. Errors might occur if you modify the storage configuration or change the intermediate FC link during service operations.
Before making changes, contact relevant maintenance and development personnel to assess the impact and risks.
Troubleshooting for FC
1. Link errors.
Link errors are usually exceptions reported by the HBA driver in the /var/log/syslog of the CVK server. The firmware and driver of the HBA must match, the firmware and driver must support the current hardware system. If the current hardware system is not supported, some HBAs might not be activated.
To solve the issue, check the configuration of the FC switch and the link state on the FC switch. Replace the HBA card and fiber optic, or change the intermediate fiber optic switch.
Inappropriate storage configuration might also cause link errors, such as storage bugs, which lead to unstable links.
2. FC multipath cannot be established.
A node consistently fails to enable multipath multiple times. The link connecting one controlled storage controller is normal, while the link connecting another controller keeps failing. After changing the fiber optic between the switch and the storage controller, the connection can be established successfully. Link errors prevent the successful establishment of multipath connections.
3. Configured LUNs cannot be discovered on the CVK server.
The CVK HBA is not correctly associated the with the controller's HBA. You must manually refresh and scan LUNs. In the current versions, the system automatically performs the refresh and scan operations. For some older-version storage models from specific vendors, you must restart the server after associating the LUN at the storage end to discover the newly configured LUN.
Check syslog/message and /var/log/fc_san_shell_202003.log. Analyze the logs at different levels to locate the cause.
Errors related to the HBA card or FC driver will be recorded in the syslog.
The CAS running scripts of FC-related configuration are usually recorded in /var/log/fc_san_shell_202003.log.
Check and analyze the link quality through the switch. The troubleshooting methods for FC switches vary by vendor. For more information, contact the specific vendor.
As a best practice, replace the hardware (optical port, fiber optics, etc.) when the optical power of the port is less than -4dBm. If it is less than -7dBm, the hardware must be replaced. Generally, issues can be resolved after replacing the hardware including fiber optic cables and HBA cards, upgrading firmware drivers, switch versions, and storage firmware.
Multipath
Multipath operating mechanism
The multipath feature manages all paths in the system belonging to the same LUN and creates a multipath object. The multipath object information of the corresponding storage pool can be queried by multipath -ll NAA. Multipath can implement I/O load balancing and migration upon fault for I/O links through I/O path selection and scheduling. It improves the system's stability and overall performance.
Figure 24 Multipath structure
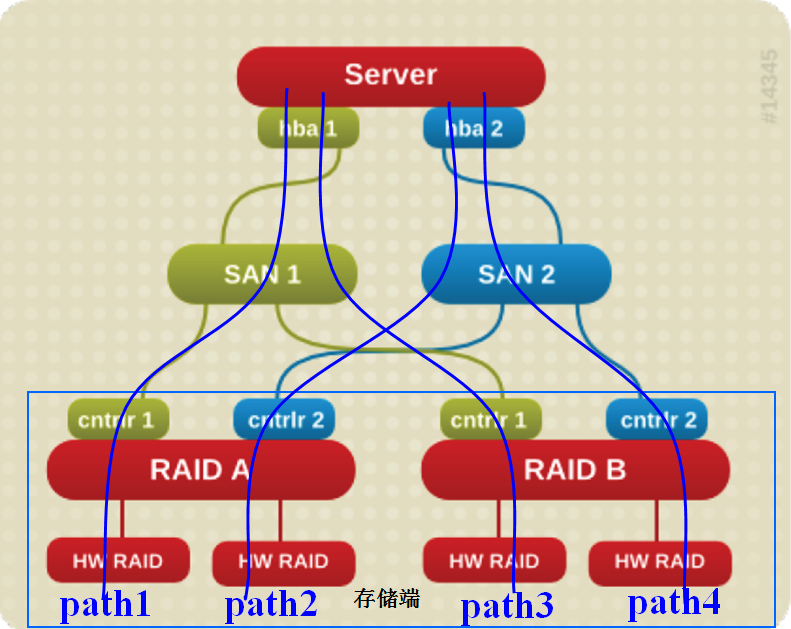
Multipath has the following advantages:
· High performance: It improves link efficiency through I/O link load balancing.
· High availability: It ensures reliable switchover and restoration upon link faults.
CAS uses the Linux standard multipath software as the management software for multipath.
The version used by CAS is multipath-tools 0.4.9/0.5.0. This open-source multipath software is widely used, supports a large number of storage options, and is constantly evolving in development. It offers powerful functions.
Currently, the multipath software used by CAS can basically adapt to the storage models produced by existing storage vendors. Some storage models require a separate, special configuration file. Please contact the storage vendor for specific instructions and guidance. For example, when using MacroSAN, you need to manually configure the LUN usage policy and various parameters in the multipath.conf file.
Process and service of multipath
The name of the multipath daemon is /sbin/multipathd.
The name of the multipath service is multipath-tools.
Commonly used commands for troubleshooting
Configuration file for multipath: /etc/multipath.conf:
root@cvknode73:~# cat /etc/multipath.conf
blacklist {
wwid "*"
}
blacklist_exceptions {
wwid "36001438009b051b90000600000970000"
wwid "36000eb34fe49de760000000000004064"
wwid "36000eb34fe49de76000000000000420c"
}
multipaths {
}
The WWID (NAA) of each LUN is displayed in the .conf file and written in the blacklist_exceptions section.
To configure policies individually, modify the policy settings in the multipaths section or add support for device models to the devices section.
For third-party storage devices, the multipath software automatically carries a default configuration policy. You can use the multipathd show config command to view the default configuration policy, multipath settings, and parameter values for different vendors.
You can use the multipath -ll command to view the current multipath configuration Additionally, you can use the dmsetup command to check the configuration.
Query mutlipath information
To view the multipath state information of a specific LUN, use the multipath -ll command.
You can also view the state of only one LUN by adding its WWID (NAA) information in the command.
The following output shows that two paths exist between the CVK server and the storage system:
root@cvknode213:~# multipath -ll 36001438009b051b90000700000110000
36001438009b051b90000700000110000 dm-0 HP,HSV340
size=40G features='0' hwhandler='0' wp=rw
|-+- policy='round-robin 0' prio=1 status=active
| `- 2:0:0:8 sdp 8:240 active ready running
`-+- policy='round-robin 0' prio=1 status=enabled
`- 1:0:0:8 sdg 8:96 active ready running
Focus mainly on whether a path has failed. If a path fails, examine whether the storage link is functioning properly.
Other commonly used commands
· /lib/udev/scsi_id --whitelist /dev/sdb: Returns the corresponding NAA under normal circumstances.
· ls –l /dev/disk/by-path: Queries all devices recognized by the system.
· ls –l /dev/disk/by-id: Queries all recognized devices in the system, including successfully created multipath devices.
· dmsetup table: Queries multipath information in the kernel.
· iscsiadm –m session: Queries session information.
· fdisk –l /dev/sd*: Queries whether the sd* of the device is accessible.
· sg_turs /dev/sd*: The iSCSI command queries whether the sd* of the device is accessible.
Log analysis: identify and locate common issues
Multipath log: /var/log/syslog
Identify and locate common issues
1. View the log to identify the general cause.
Analyze the following four logs, focusing on the multipath-related fault logs, and identify the causes.
/var/log/syslog àMultipath creation process log
/var/log/ocfs2_shell*.log àScript log
/var/log/sa_shell*.log àStorage adapter log
/var/log/fc_san_shell*.log àFC storage log
Identify the issue category:
Configuration issue
Identify whether /etc/multipath.conf is correctly configured. Make sure the configuration is correct.
Link issue
Identify whether the session exists, and the disk is accessible. Make sure no link faults exist.
Multipath issue
Identify whether the multipath creation failed. If yes, proceed to step 2.
2. Investigate multipath creation failure
Turn on the log.
vi /etc/cvk/util_cvk_log.conf
Change the Logging_Level_modeName of the module you need to focus on to DEBUG.
Manually configure multipath:
multipathd -k
>add elist naa
>discover newpath
>add map naa
Trigger a new configuration attempt, observe the output in /var/log/syslog, and review the specific fault log to narrow down the scope. Analyze the log and code together to locate the real cause of the issue.
3. Investigate multipath creation failure in the kernel
If the specific cause is not identified in step 2, residual multipath configuration might exist in the kernel. Use the dmsetup table command to identify whether any multipath objects with errors or in abnormal states exist in the kernel. If yes, use the dmsetup remove –f NAA command to delete the residue, or use the multipathd reconfig command to clear the residue.
After clearing the residue, execute the udevadm trigger command, and then try creating a storage pool.
Examples
· Incorrect configuration file causes multipath startup to fail.
If the configuration file is not set up correctly, the policy and parameters might not be compatible with some storage models. This might cause the multipath startup to fail. In this case, contact the specific vendor for the configuration policy, manually configure the settings, and then execute the service multipath-tools restart command to restart the multipath software. Use the multipath -ll command to verify that the multipath software starts correctly.
· Link faults prevent establishment of paths through multipath.
When the link is unstable, paths cannot be created through multipath. In this case, analyze syslog to identify whether any faults exist. Replace the HBA card and change the fiber optics. And then, verify that the path is normal.
Identify whether the usage configuration of the intermediate FC switch complies with the FC configuration.
· Use of the no_path_retry parameter.
This parameter represents the number of attempts made after a fault occurs in the path. After a fault occurs, the attempt of path switchover will be made every 5 seconds. Under normal link conditions, the attempt will be made every 20 seconds.
A larger value for this parameter will result in a longer time of path switchover. If a shared file system is configured, it might also cause the CVK fencing to restart. In an actual production environment, if a multipath testing is performed and path switchover cannot be completed within the fencing time, modify this parameter. The defaults field is suitable for most situations. You can also follow the multipath field or the devices field.
Restrictions and guidelines
In the multipath configuration file, you do not need to configure getuid_callout "/lib/udev/scsi_id --whitelisted --device=/dev/%n". In the previous 3par active-active configuration document, this configuration existed. Currently, it has been abandoned by the upstream of the open-source community. If necessary, delete it. Otherwise, issues might occur when configuring the 3par active-active feature in the latest CAS version.
Storage adapters
Viewing storage adapter information
On the Storage Adapters page, you can view IQN information and HBA information.
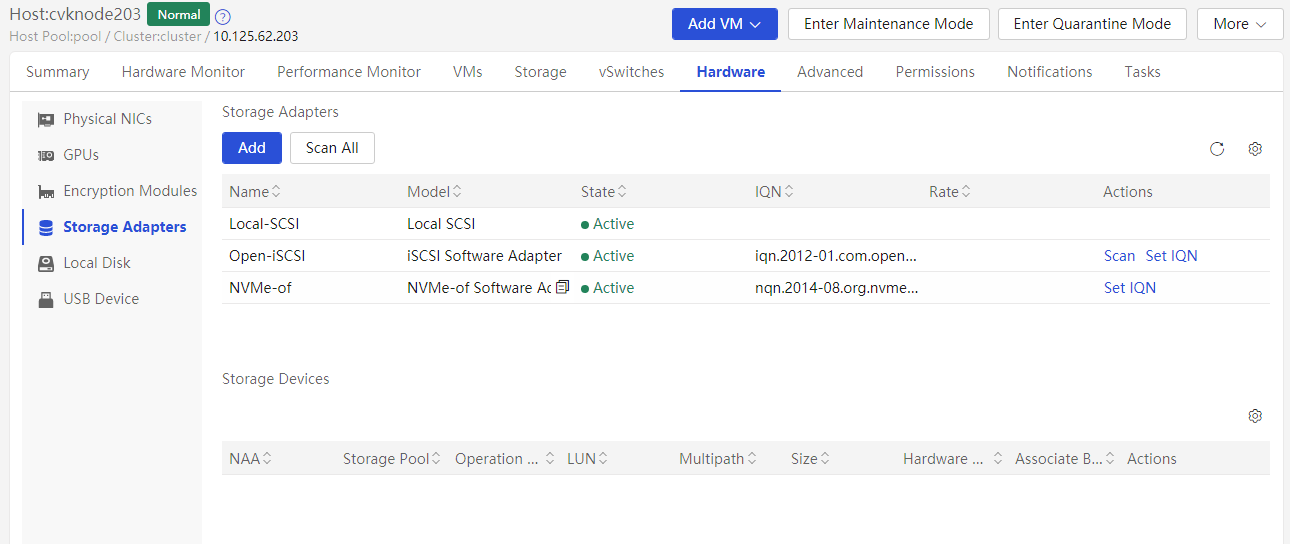
Execute the sa_info.sh command on the desired CVK host to obtain information.
If you use an iSCSI adapter for connection to the storage array, make sure the IQN information of that iSCSI adapter is the same as that of the storage array.
If you use an FC or FCoE storage adapter for connection to the storage array, pay attention to HBA firmware and driver version information.

Different manufacturers' HBA cards require different drivers on the host side.
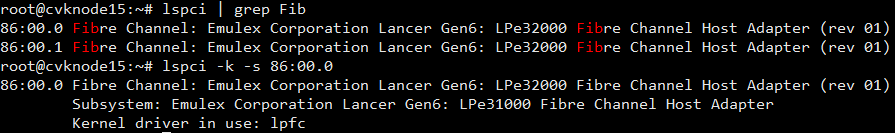
Identify whether the host has a path to access the storage array.
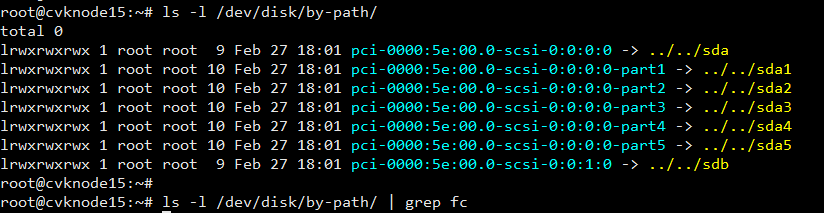
Scanning the storage adapter
To perform a normal scan, you can perform the task on the Web interface (Method 1), or execute the sa_scan.sh 0 command on the desired CVK host (Method 2).
To perform a forcible scan, you can perform the task on the Web interface (Method 1), or execute the sa_scan.sh 1 command on the desired CVK host (Method 2).
For iSCSI storage adapters, the process of normal scan is the same as that of forcible scan.
For FC/FCOE storage adapters, performing a forcible scan will reset the link, blocking I/O access (this issue is usually cleared within 5 seconds).
During the process of adding or scanning storage pools, the host performs normal storage adapter scans.
To discover the LUNs allocated from the storage array to a host without restarting the host, perform a storage adapter scan on the host.
When the storage array reclaims a LUN from a host, perform a storage adapter scan on the host.
The procedure is as follows:
1. On the host, delete the storage pool to which the LUN belongs. You can record the LUN WWID or LUN number.
2. On the storage array, reclaim the LUN from the host.
3. Perform normal storage adapter scans on all hosts to verify that the recorded LUN WWID or LUN number does not exist on the storage adapter.
4. If the recorded LUN WWID or LUN number still exists on the storage adapter, perform a forcible storage adapter scan as a best practice.
If you do not scan the storage adapter, unnecessary path information will remain on the host.
Why is scheduled storage adapter scan unfavorable? Multiple hosts might access the storage array simultaneously. Scanning the storage adapter on multiple hosts might cause frequent scan operations on the storage array, potentially degrading storage performance.
Configuring the multipathing policy
As a best practice, do not use this method to edit the multipathing policy.
In most cases, using the default multipathing settings, which includes the storage configurations provided by major manufacturers.
You can edit the /etc/multipath.conf configuration file for the desired host and add different Devices properties for storage purposes.
Troubleshooting common issues
The HBA firmware version is upgraded to
8.08.* on the new UIS-Cell server with the following QLA storage adapter model:
Fibre Channel: QLogic Corp. ISP2722-based 16/32Gb Fibre Channel to PCIe Adapter
(rev 01)
Host anomalies occur after the HBA firmware upgrade. The qla2xxx driver version provided by CAS is 10.00.00.7-k. This issue occurs because the driver version does not match the firmware version. The firmware version is higher than FW:v8.03.04, such as FW:v8.08.03 or FW:v8.08.05. You need to upgrade the qla2xxx driver version to 10.00.00.12-k. If the previous driver version (10.00.00.7-k) is still in use, the host might frequently restart or malfunction. To resolve this issue, upgrade the qla2xxx driver or upgrade the CAS version to E0526H11 or any version later then E0530H07. If possible, ensure that multiple HBAs on the same host use the same firmware version when you upgrade the firmware version of an HBA.
Configuring fencing
Introduction
1. What is fencing?
Fencing is a resource protection mechanism against anomalies for the shared file system. It is a risk avoidance policy that ensures cluster resource access integrity by minimizing potential damage to resources. When the shared file system malfunctions (due to management network failure or storage failure), the fencing mechanism is triggered.
2. How to classify fencing services?
In terms of fencing trigger, the fencing services supported by the shared file system can be divided into three types: TCP fencing, disk fencing, and disk I/O fencing. Those types are corresponding to the two major fencing triggers, management network failure and storage failure, respectively.
3. How to implement fencing?
According to the current design, you can implement fencing with one of the following methods:
Restart the current host for fault clearance.
Unmount the failed file system from the current host to achieve fault isolation. This method does not interrupt other normal file systems running on the host. As a best practice, use this method to implement fencing.
4. How to configure the fencing method?
You can configure the fence method on CAS, and the configuration path is System > Parameters > System Parameters > Basic System Parameters.
As shown in the following figure, you can select a fencing method on the right of the Shared Storage Fault Action parameter. In this example, the selected fencing method is Do Not Restart Host.
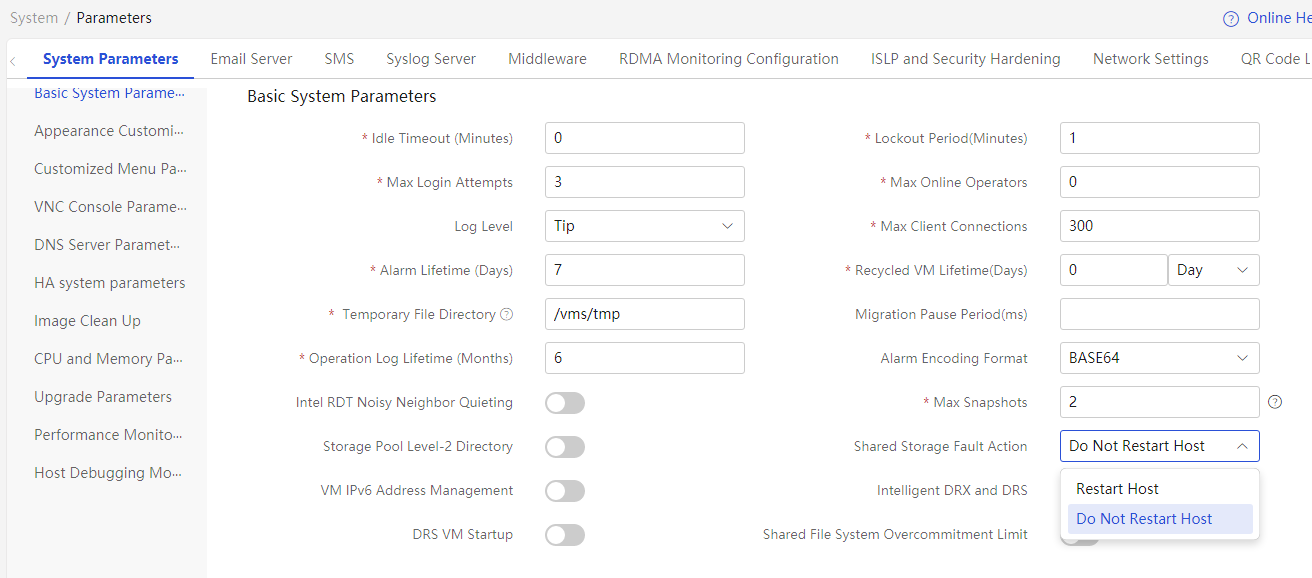
5. When is a fencing service triggered?
Fencing triggers can be divided into two categories: TCP issues and disk issues. The following explains how a fencing service is triggered.
¡Disk fencing
After the OCFS2 shared file system starts, it writes timestamp information to disks every 2 seconds. If a storage failure occurs and the system fails to write timestamp information to disks before the timeout time elapses, disk fencing will be triggered on the host. You can adjust the timeout time if needed.
¡Disk I/O fencing
When the OCFS2 shared file system is running correctly, it monitors disk I/O (such as metadata and log data). If an I/O error or failure occurs, disk I/O fencing is triggered.
¡TCP fencing
After the OCFS2 shared file system starts, it establishes a TCP connection with each node in the cluster and monitors the status of the established TCP connections. When a network failure occurs, a TCP disconnection is detected. If the network connection does not restore to normal before the timeout timer expires, TCP fencing will be triggered.
Process and service management information corresponding to fencing
After the shared file system starts, it generates a heartbeat process. The process is named in o2hb-<uuid> format. For example, process o2hb-09217E828E is the heartbeat process.
![]()
Commands for troubleshooting
The fencing feature logs the reason for triggering it. By analyzing the corresponding log message, you can determine the fencing trigger, and then conduct further troubleshooting.
Log analysis: Common fencing triggers
1. To find out the cause of fencing, the following log file is required:
/var/log/syslog
2. The shared file system triggers fencing upon storage or network issues.
If disk fencing or disk I/O fencing is triggered, possible reasons include:
¡The storage links flap between the CVK server and the disk array. Those links include the connection between the CVK and the switch, and the connection between the switch and the storage array.
¡The storage adapter of the CVK server has a hardware failure.
¡A fault exists, such as disk array failure or switch failure.
¡The configuration on the disk array side is manually modified, resulting in incorrect configuration. For example, modify the disk array configuration or update the LUN permissions. Modifying the disk array configuration will result in a LUN ID change.
If fencing is triggered, the /var/log/syslog log file usually generates records of link disconnection events before fencing, such as network port or FC down events, iSCSI or FC link disconnection events, or disk I/O anomalies.
If TCP fencing is triggered, possible reasons include:
¡The management network is in abnormal condition: The management links between CVKs flaps, including the connections between CVKs and the switch.
Workflow of locating and clearing fencing triggers
If fencing is triggered in the shared file system, follow these steps for troubleshooting:
1. Determine the fencing trigger.
Open the /var/log/syslog log file and search for log messages that contain the o2quo_insert_fault_type keyword.
As shown in the following figure, the log message in red contains the DISK fault keyword (in blue). This indicates that disk fencing is triggered. If TCP fencing is triggered, the log message should contain the TCP fault keyword.
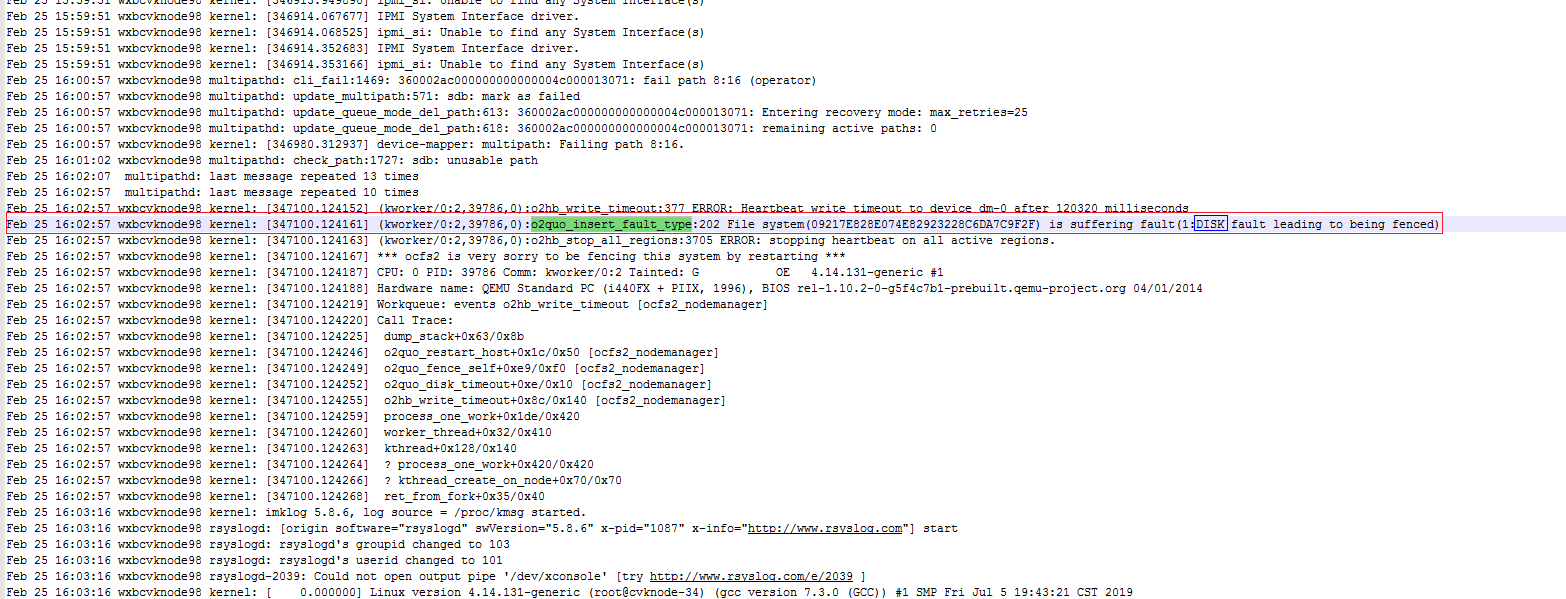
Table 1 Keywords in log messages of different fencing types
|
Fencing type |
Keyword |
|
DISK fence |
DISK fault leading to being fenced |
|
DISK IO fence |
DISK IO fault leading to being fenced |
|
TCP fence |
TCP fault leading to being fenced |
2. Based on possible fencing triggers, identify whether the corresponding hardware and links are running correctly.
You can check the following items:
a. Whether the BIOS/firmware version of the server and the blade server chassis require upgrade.
b. Whether the IML hardware log on the server records a hardware failure.
c. Whether the /var/log/mcelog log file of the server records a hardware fault.
d. Whether the configuration of the blade server chassis is suitable.
e. Whether the FC optical fibre connected to the FC switch is normal condition. You can view the optical power and the CRC error ratio of the corresponding interface on the FC switch. Note that commands for Brocade switches and H3C switches are different.
f. Whether one-to-one port zones are configured on the FC switch for HBA isolation. If two FC switches form an IRF fabric and multipathing is configured for LUNs on CVK servers, undo the fabric as a best practice.
g. Whether the FC switch version is H3C 58. If yes, upgrade the switch version to a version later than R2422P01 as a best practice. For more information about the target switch version, contact Technical Support.
h. In the IP SAN scenario, whether packet loss occurs on the corresponding physical network ports of CVK, and whether anomaly log messages are generated for the intermediate network cable and the switch.
i. Whether log messages about storage faults exist or incorrect operations were performed on the storage side.
Restrictions and guidelines
When the shared file system is running, do not perform storage-related operations including:
1. Change the hardware configurations for hosts, such as network cable replacement or NIC replacement.
2. Operations that affect the running of storage-related switches, for example, change their configurations of storage-related switches, or plug in or out switch cables.
3. Operations that affect the running of the shared file system, for example, edit storage configuration, delete mappings, modify LUN Ids, or export LUNs to hosts in other clusters.
Configuring the heartbeat network for the shared file system
OCFS2 provides file resource access for nodes in the CAS cluster. By default, OCFS2 communicates with those nodes over the management network. If the management network is disconnected and does not recover before a specific timer expires, the disconnection will trigger fencing.
In iSCSI storage access mode, you can use one of the following methods to prevent management network disconnection from triggering fencing:
· Method 1: Configure a network as both the management network and the network used for iSCSI storage access.
· Method 2: Set up the storage heartbeat network on spare NICs.
The heartbeat network is mainly used for communication between hosts that access the shared file system. The default heartbeat network for the host pool is the host management network.
Users can select different networks as the heartbeat network for the shared file system based on the storage type, NIC usage, and bandwidth pressure on the management network and the storage network.
· The hosts use FC SAN storage:
¡ If the management network has high bandwidth pressure and the hosts have available NICs, configure a dedicated network as the heartbeat network for the shared file system.
¡ If the management network has low bandwidth pressure, you can configure the management network as the heartbeat network for the shared file system.
· The hosts use IP SAN storage:
¡ If the management network has high bandwidth pressure and the storage network has low bandwidth pressure, you can configure the storage network as the heartbeat network for the shared file system.
¡ If the management network has low bandwidth pressure and the storage network has high bandwidth pressure, you can configure the management network as the heartbeat network for the shared file system.
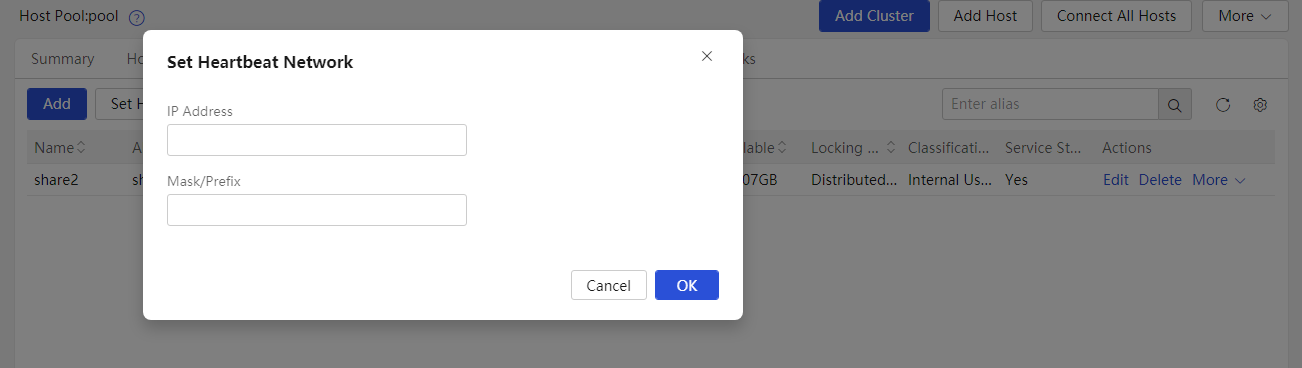
After the storage heartbeat network is configured, CVK nodes will use IP addresses in the storage heartbeat network for communication.
root@cvknode213:~# cat /etc/ocfs2/cluster.conf
cluster:
node_count = 1
name = pool
node:
number = 1
cluster = pool
ip_port = 7100
ip_address = 192.168.6.213
name = cvknode213
Restrictions and guidelines
· If shared storage is already configured, you cannot configure the storage heartbeat network.
· To minimize network risks, determine the network to be configured as the storage heartbeat network deployment in advance.
Configuring and using RBD
Introduction
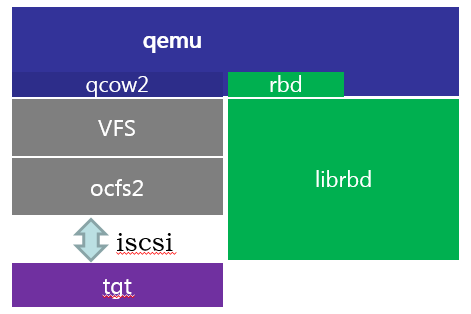
For VMs, rbd, qcow2, and raw are at the same level and all of them used by the qemu process, as shown in the figure above.
rbd, qcow2, and raw all negotiate a group of read and write interfaces with the qemu process. These interfaces allow the qemu process to obtain and store data. However, qcow2 and raw are file system-based and rbd is network-based. Thus, for network-based RBD disks on CVK, there will no longer be corresponding files or block devices. RBD volumes, as virtual machine disks, cannot be viewed through file system commands. All information queries for RBD volumes must be done using the RBD command.
Configuration file
RBD storage adopts the client-server architecture to provide resource access. Each storage user acts as a client. To access RBD volumes on the server side, a cluster configuration file is required. Each cluster is associated with one configuration file. The cluster configuration file contains basic cluster information. By default, when clients access volume information with the rbd command, they search for configuration files in directories such as /etc/ceph and /etc/onestor_client.
Commands for troubleshooting
The libvirt/qemu process accesses RBD volumes through the interface provided by the underlying librbd library, which is the same as the interface that the ceph or rbd tool uses for volume access. Troubleshooting should start from the bottom. First, use the ceph or rbd tool to identify whether the storage system is functioning correctly. If it is functioning normally, use the libvirt/qemu tool for further inspection.
· Ceph or rbd
¡Get basic information about the cluster associated with the CAS storage pool:
Use the virsh pool-dumpxml poolname command to extract the content of the file attribute in the config tag, which contains the path to the configuration file. In this example, the configuration file is placed at /path/to/ceph.conf.
Extract the content of the name attribute in the host tag, which contains the mon IP of the cluster. In this example, the mon IP is mon_ip.
Extract the content of the metadatapool tag, which contains information about the ceph storage pool associated with the CAS storage pool. In this example, ceph storage pool poolname is associated with the CAS storage pool. If the storage pool is inactive, list all storage pools by using the virsh pool-list --all command, and then dump their XMLs.
¡Identify whether the network connection between the client and the server is normal:
ping mon_ip
¡View the health status of the cluster:
ceph –s –c /path/to/ceph.conf
¡View all storage pools in the cluster:
ceph osd pool ls –c /path/to/ceph.conf
¡Identify whether the volumes in the ceph storage pool associated with the CAS storage pool are accessible:
rbd ls poolname –c /path/to/ceph.conf
¡View information about the storage volumes used by VMs.
rbd info volname -p poolname -c /path/to/ceph.conf
· Libvirt/qemu
If you can correctly access the storage pool and the storage volumes used by VMs through the ceph or rbd tool, the underlying layer can correctly access RBD storage. You can use the virsh command to identify whether the storage system can be accessed.
¡List all CAS storage pools:
virsh pool-list --all
¡View storage pool information:
virsh pool-info caspoolname
¡Refresh storage pools:
virsh pool-refresh caspoolname
¡List all volumes in a CAS storage pool:
virsh vol-list caspoolname
¡List volume information:
virsh vol-info volname caspoolname
Troubleshooting common issues
A common issue about RBD storage pools is that the virsh pool-start poolname command fails to start the specified storage pool. You can search the libvirt log /var/log/libvirt/libvirtd.log file for the cause of this issue by using the storage pool name as the keyword. This usually helps identify the reason for the failure to start. Common causes of this issue recorded in the log file include:
· Network disconnection.
The storage pool is suspended on the Web page and cannot be started. The ceph command cannot query cluster information in the background. The monitor node within the same cluster as the storage pool is unreachable.
· The configuration file is missing.
The configuration file is missing or not in the specified location and the storage pool is suspended on the Web page. When the storage pool is started, the system prompts that the configuration file does not exist.
· Failure to search for volume information under the storage pool.
This issue occurs if the librbd library provided by the storage side malfunctions. You can contact ONEStor for assistance in troubleshooting.
Restrictions and guidelines
The configuration file of RBD storage is crucial for client access to storage pools. Therefore, the existence and the location of the configuration file affect RBD storage access. When you perform RBD storage operations in the background, make sure the configuration file is correct.
vNetwork management
Open vSwitch
Overall architecture of OVS
An Open vSwitch (OVS) is a virtual switch (vSwitch) that runs on virtualization platforms (such as KVM and Xen). On a virtualization platform, an OVS can provide the Layer 2 switching function for dynamically changing ports, and control access policies, network isolation, and traffic monitoring in vNetworks.
A vSwitch transmits traffic between virtual machines (VMs) and enables communication between VMs and external networks, as shown in the following figure.
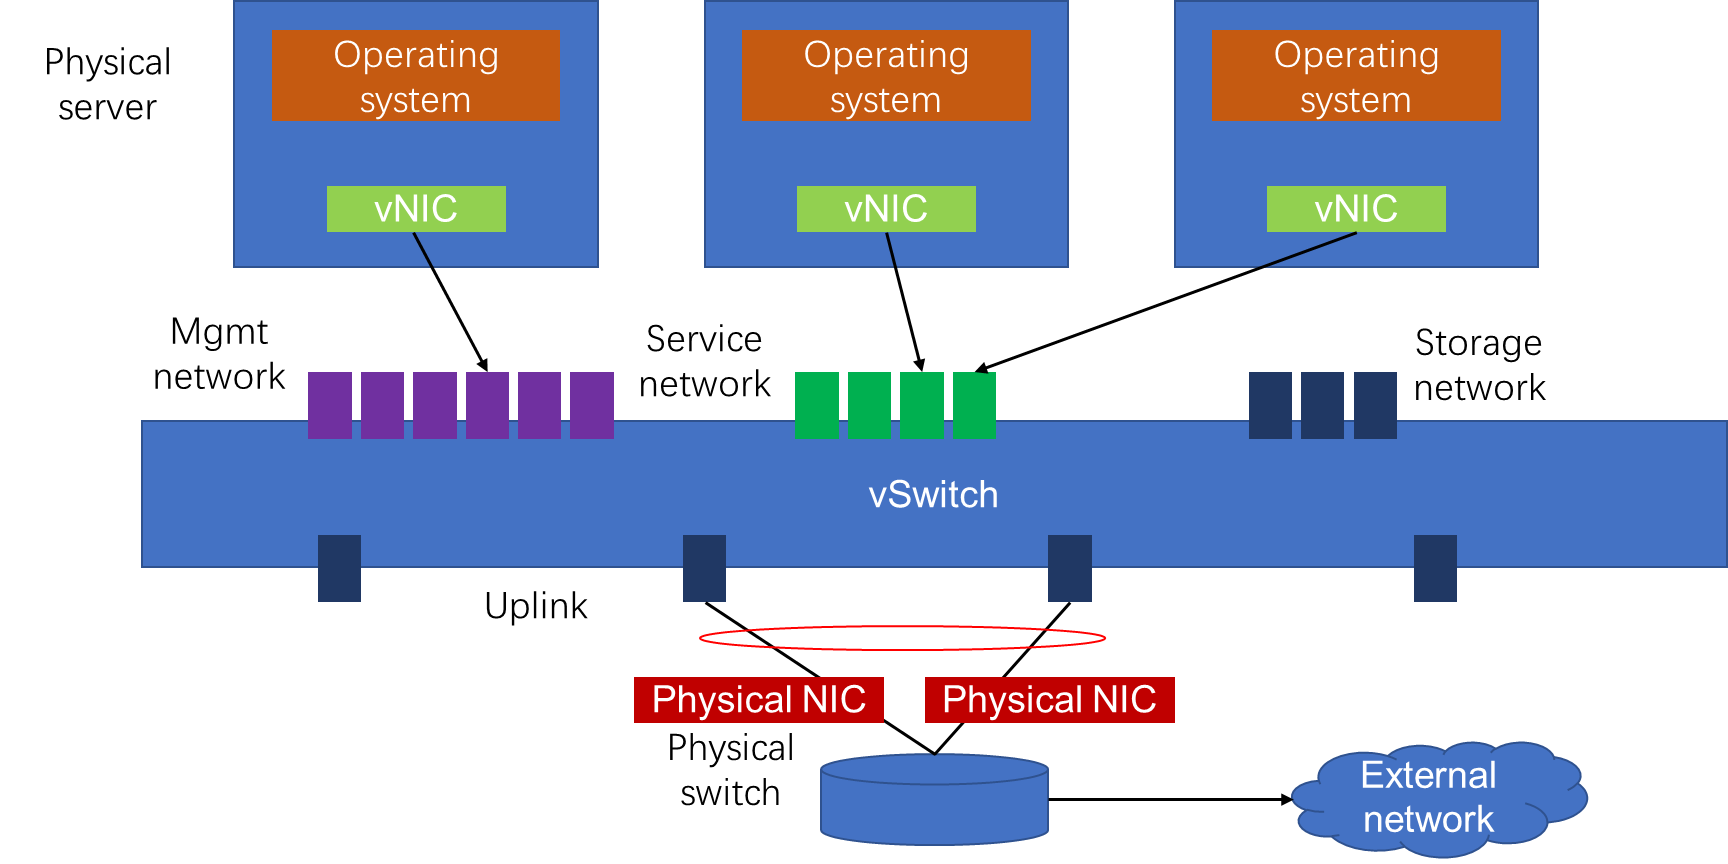
The overall architecture of an OVS is as shown in the following figure:
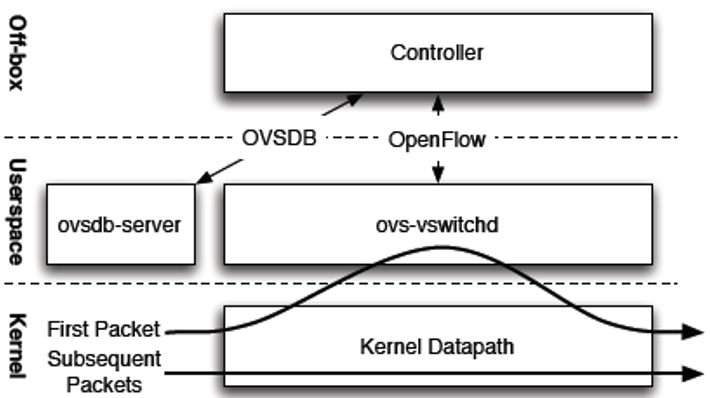
· ovs-vswitchd—A user-mode daemon program. It processes OpenFlow messages, the first packet of a packet flow, and packets of other control protocols such as Link Layer Discovery Protocol (LLDP) and Link Aggregation Control Protocol (LACP) to implement flow-based switching.
· ovsdb-server—A lightweight database service that primarily stores the entire OVS configuration information, including interfaces, VLANs, and aggregation modes. The ovs-vswitchd program operates according to the configuration information in the open vSwitch database (OVSDB).
· kernel datapath—Kernel forwarding module of an OVS. It sends the first packet of a packet flow to the user mode and forwards the subsequent packets of the packet flow.
· Controller—OpenFlow controller deploys vSwitch configuration, and configures and manages vSwitch flow tables. NOTE: No controller exists in the CAS environment. In the current software version, advanced features such as security groups are implemented through multiple levels of flow tables. Flow tables on CAS are managed through the net-agent.
An OVS forwards traffic based on flow tables. The basic process is as shown in the following figure:

After a port receives a data packet, it sends the packet to the kernel datapath module for processing. If the packet matches a kernel-mode flow entry, it is processed accordingly. If not, the packet is sent to the ovs-vswitchd process in user mode to search for a user-mode flow entry. After the packet is processed in user mode, it is output to the correct port, and a new kernel-mode flow entry is created for fast forwarding the subsequent packets.
Basic OVS concepts
Bridge
A bridge represents an Ethernet vSwitch. Multiple bridges can be created on a single host. For example, vswitch0 is a bridge. According to the forwarding mode, bridges include virtual Ethernet bridges (VEBs) and Software-Defined Networking (SDN) Virtual Extensible LAN (VXLAN) bridges (supported only on S1020V). According to the datapath type, bridges include system bridges (kernel forwarding) and netdev bridges (data plane development kit (DPDK) forwarding).
Port
A port is a unit for sending and receiving data packets. In an OVS, each port belongs to a specific bridge. Ports include the following types:
· Tap port—A Layer 2 virtual port for processing Ethernet packets. It sends and receives VM packets, and is also known as vnet.
· Physical port—A physical port that connects to an external network.
· Local port—A port with the same name as the bridge, for example, vswitch0. It sends and receives packets on the host.
· Internal port—A port used to send or receive packets on the host. It can be a subnet created on the advanced configuration page of the vSwitch.
· Tun port—A logical Layer 3 virtual port for processing IP packets, such as GRE or VXLAN port. This type of port is not involved in the CAS environment.
· Patch port—Connects two OVS bridges in a machine with multiple bridges. Patch ports always appear in pairs, connecting to two bridges separately to exchange data between the two bridges.
Interface
An interface is a network interface device connected to a port. Typically, a port and an interface have a one-to-one relationship. They have a one-to-many relationship only when aggregation is configured.
Flow table
A flow table is a forwarding table of a bridge. It contains many flow entries.
Flow entry
A flow entry is the minimum unit of a flow table. Its data structure includes the following fields: match, priority, counter, instruction, timeout, and cookie.
· Match—This field includes information in a packet, such as source MAC, destination MAC, and VLAN, as well as fields related to a packet, such as the port through which the packet enters the bridge and the input attributes from the previous flow table.
· Instruction—The instruction set specifies the actions taken after a packet matches the flow entry. OpenFlow provides many types of instructions, such as modifying/deleting/adding VLAN tags, dropping packets, forwarding packets to the specified port, and sending packets to the specified flow table for further matching.
· Priority—Priority of a flow entry. When a packet is matched with the flow table, only the highest priority flow entry that matches the packet is selected. Flow entries with the same priority have no priority order.
· Counter—An administrator uses the counter to monitor network load. The counter is an essential tool in management. Each flow entry must maintain a counter to show the number of packets belonging to that flow.
· timeout—Timeout time (aging time) of a flow entry. Timeout time includes hard timeout and idle timeout. The flow entry is removed when the hard timeout time is exceeded, regardless of whether or not it has matched packets. The flow entry is removed if it has matched no packets within the idle timeout time.
· Cookie—This field will not be used for forwarding packets. This field is used to label the class of a flow entry for easier flow table management.
About the OVS command line tool
ovs-vsctl
Use this command to connect to an OVSDB server, and obtain and update the configurations (such as bridge, port, interface, QoS, and mirror) saved by ovs-vswitchd in the OVSDB.
Use ovs-vsctl add-br/del-br vswitch_name to add or delete a vSwitch.
Use ovs-vsctl add-port/del-port/list-ports vswitch_name to add, delete, or view ports for a vSwitch.
ovs-appctl
Use this command to obtain and manage operational data in the ovs-vswitchd process.
Use the ovs-appctl bond/show command to view the configuration and operational status of aggregation.
Use the ovs-appctl fdb/show vswitch_name command to view the MAC address table of a vSwitch.
Use the ovs-appctl dpctl/dump-flows vswitch_name command to check the kernel-mode flow entry match status of a vSwitch.
ovs-ofctl
Use this command to obtain and monitor OpenFlow vSwitches in the ovs-vswitchd process, including OpenFlow flow tables and OpenFlow ports.
Use the ovs-ofctl add-flow/del-flows/dump-flows vswitch_name command to add, delete, or view flow entries of a vSwitch.
ovsdb-client
This command is a client tool for the OVSDB server. It connects to the OVSDB server through unix:/var/run/openvswitch/db.sock and allows operations on the OVSDB, such as displaying, operating, and monitoring tables in the database.
ovsdb-tool
Use this command to operate the OVSDB, such as create, query, and modify the database.
ovs-dpctl
Use this command to monitor and configure the OVS datapath information, including create/delete a DP, and create/modify/delete flow tables, DP ports, and flow table statistics of a DP.
Other commands: OVS provides abundant interface tools. For more information, see the open source documents online.
About net-agent
Background
Cloud security plays a fundamental and crucial role in cloud computing. A stateful firewall is one specific implementation of cloud security that can meet the secure isolation requirements of network data flows. In the current software version, the CAS system uses features such as ingress/egress ACLs and IP bindings to control traffic. However, the level of control does not meet the requirements of users and cloud computing development. Therefore, it is necessary to introduce the stateful firewall feature in the CAS system to enhance the competitiveness and user satisfaction of CAS.
In the current software version, the ACLs of CAS are not stateful, resulting in shortcomings in security and functionality. For example, CAS is unable to defend against forged FIN, RST, and other packet attacks. CAS cannot block external attacks attempting to establish connections to VMs by distinguishing the connection direction. In summary, the lack of stateful protection poses a threat to cloud security. Therefore, the existing ACLs of CAS must be stateful to enhance security of CAS in the cloud environment.
Net-agent framework
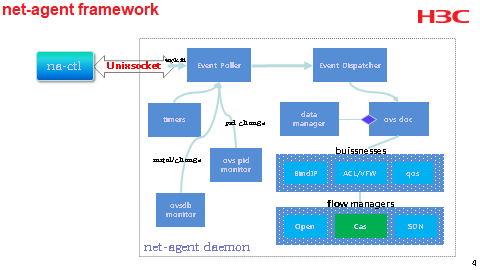
The net-agent framework contains several sub-modules, including event poller, ovsdb monitor, ovs pidmonitor, data manager, ovs doc, business, and flow manager. The function of each sub-module is as follows:
· Event poller—Collects information output from the na-ctl command.
· ovsdb monitor—Monitors the OVSDB. If the OVSDB configuration changes, the ovsdb monitor compares the OVSDB configuration with the data structure maintained in net-agent's memory for differences. If differences exist, the ovsdb monitor updates net-agent's data structure.
· ovs pidmonitor—Monitors changes in the process IDs (PIDs) of the ovsdb-server and ovs-vswitchd processes. If a PID changes, the ovsdb-server or ovs-vswitchd process might restart or become abnormal. In this case, the flow table must be deployed again based on the data structure of the net-agent to restore the original flow table of the OVS.
· data manager—Maintains all data structures of the net-agent.
· ovs doc—A class that the core uses to process port, stateful firewall, and ACL rule changes. It offers APIs for the upper layer to update internal core data upon OVSDB configuration changes, OVS restarts, and na-ctl command invocations.
· Business—Processes businesses, such as ACLs and QoS.
· flow manager—Manages the business flow tables, including deploying and deleting flow tables.
NOTE: A na-ctl is a client of the net-agent. It communicates with the net-agent through the Unix socket by using the private protocol of the net-agent. It passes commands to the net-agent, and the net-agent responds accordingly. Example commands:
· na-ctl netprofile define --content
· na-ctl nwfilter delete filtername
· na-ctl nwfilter update filtername
The general implementation of the net-agent is as follows.
Th events monitored by the net-agent have the following three sources:
· The Unix socket messages received by using the private protocol of the net-agent.
· The PID file changes monitored by using the ovs pidmonitor.
· The OVSDB configuration changes monitored by the ovsdb monitor.
The net-agent process uses file polling to monitor events in other processes. Events that can be processed in this design, such as OVSDB port configuration changes, na-ctl user interface invocations, and unexpected OVS process restarts must be associated with file descriptors. The file descriptors are registered with the EPOLL object of the net-agent process for monitoring. Design the response to each file write event in the net-agent for processing. Then the net-agent process performs polling. The net-agent waits for file events registered by other processes to occur and processes them accordingly.
Libvirt monitors NIC configuration changes and assembles an OVSDB update interface command to update the configuration in the OVSDB by calling the OVSDB interface. If the monitored XML file changes, libvirt notifies the net-agent that the configuration has been updated. The net-agent monitors configuration changes in the OVSDB or receives update commands from libvirt. Based on the configuration changes, the net-agent deploys flow table update commands to the ovs-vswitchd process.
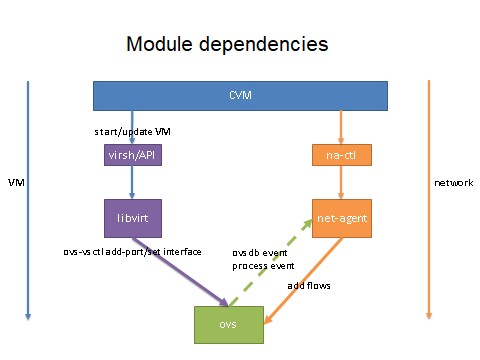
The interactions between the net-agent module and other modules (CVM, libvirt, and OVS) can be processed in the following ways.
· This way has two scenarios.
¡ In the first scenario, NICs (either virtual or physical) are added or deleted, and vSwitches are added or deleted. The CVM interface calls the virsh command or the API functions of libvirt to operate libvirt. Then, libvirt uses the ovs-vsctl command to operate the OVS and update the related port configuration in the OVSDB. The net-agent monitors changes in the OVSDB and updates the data structure it maintains for consistency with that in the OVSDB. In this case, no flow tables are deployed.
¡ In the second scenario, when the NIC changes from unconfigured to configured with IP binding, ACL, or stateful firewall, or vice versa, or when the reference relationships among IP binding, ACL, and stateful firewall change (for example, ACL1 becomes ACL2), libvirt operates the OVS through the ovs-vsctl command to update the port configuration in the OVSDB. When the net-agent monitors port configuration changes in the OVSDB, it updates the data structure maintained by the net-agent and uses the ovs-ofctl command to operate the OVS, delete the existing flow tables for that port, and deploy the new flow tables for the port to the OVS.
· The CVM controls and queries the net-agent by invoking the na-ctl command of the net-agent.
Modify the vFirewall or ACL contents bound to a virtual NIC on the CVM interface. Libvirt detects changes in the interface XML file of the nwfilter module, and uses na-ctl command to notify the net-agent of ACL or stateful firewall content changes in the NIC configuration. The net-agent updates data of the interface maintained in the memory and then uses the ovs-ofctl command to delete all flow tables for that port and deploy new flow tables based on the updated XML file content of the nwfilter.
NOTE: Use the na-ctl nwfilter update/delete nwfilter_name command to update (or delete) the nwfilter rules of the port. The nwfilter_name argument is the name of the rule for the firewall or ACL to be updated.
Process and service information of submodule a
This section describes the process names and services used.
root@cvknode221:~# ps -ef | grep net-agent
root 5476 1 0 Feb17 ? 00:00:00 /usr/bin/python /usr/sbin/net-agentd
Commands commonly used for troubleshooting
This section describes common commands and scripts for troubleshooting.
· You can use the na-ctl log-level error/warn/info/debug command to define the log level as needed, which is debug by default.
· Use the na-ctl dump command to display the current port configuration to facilitate troubleshooting and system maintenance. The object data maintained in the net-agent's memory corresponds precisely to the information in the OVSDB.
· The following are some quick query commands for flow rate limiting:
na-ctl netprofile dump //Print the XML contents of netprofiles
na-ctl netprofile dump <name> //Print the XML file of the netprofile with the specified name
na-ctl netprofile list //List the names of all netprofiles
na-ctl portprofile dump //Print the XML contents of portprofiles
na-ctl portprofile dump <name> //Print the XML file corresponding to a port profile with the specified name
na-ctl portprofile list //List the names of all portprofiles
Process for analyzing and locating common issues through log analysis
This section describes the log location and file name of each log file, and the issue analysis process.
The net-agent has the following two log files:
· The /var/log/caslog/cas_na_ctl.log file records the execution status of all na-ctl commands.
· The /var/log/caslog/cas_net_agentd.log files records all log information regarding the running of the net-agentd process.
Issue analysis process: Typically, if security group rules are deployed from the big cloud, first identify whether the security group rules are deployed to the front end of CVM. If the rules are deployed to CVM, identify whether the flow tables corresponding to the rules for the port are successfully deployed in the back end. If the rules are not found in CVM after the big cloud deploys the rules, contact the plug-in department to identify whether the plug-in has received the configuration and deployed the configuration properly. If CVM has received the configuration but the configuration does not take effect, contact the back end network department to identify whether the configuration file is generated and the flow table is deployed normally.
From the perspective of the back end, the analysis process is as follows:
1. Identify whether the port configuration file exists.
To check the bind-ip configuration, follow these steps:
a. Check the VM XML file to identify whether it has been bound.
<interface type='bridge'>
…
<ip address='172.20.23.5' family='ipv4'/>
<ip address='1:2:3:4:5:6:7:8' family='ipv6'/>
…
</interface>
b. Use the ovs_dbg_listports command to check the port name corresponding to the virtual NIC. Suppose it is vnet4. Execute the ovs-vsctl list Interface vnet4 command in the back end to view the corresponding port name.
other_config : {bind-ip="172.20.23.5", tos="0"}
For ACL or stateful firewall configuration, follow these steps:
a. Use the ovs_dbg_listports command to identify whether the Filter field corresponding to the virtual port has a value.
b. Identify whether the ACL or firewall is configured on the port in the VM XML file.
<interface type='bridge'>
…
<filterref filter=' FW_firewall'/>
…
</interface>
Rule files:
/etc/libvirt/nwfilter/acl.xml
/etc/libvirt/nwfilter/FW_firewall.xml
For the flow rate limiting configuration, follow these steps:
a. Use the ovs_dbg_listports command to obtain the port name, and then use the ovs-vsctl list Interface vnetx command to view the configuration.
external_ids : { port-profile="f6340b8c-6628-4f9c-acb3-f442dfcce36e_0", vm-id="f6340b8c-6628-4f9c-acb3-f442dfcce36e"}
b. According to the data obtained through the port-profile, view the configuration in the f6340b8c-6628-4f9c-acb3-f442dfcce36e_0.xml file.
<netprofile name="Qos_limit-test" type="qos" />
c. View the flow rate limiting policy rules in the /etc/net-agent/netprofile/qos/ Qos_limit-test.xml file.
2. Identify whether the flow tables of the port have been properly deployed.
¡To identify whether the bind-ip flow table has been deployed, follow these steps:
- Use the ovs_dbg_listports command to view the port number corresponding to the virtual NIC.
- If the vSwitch is vswitch0 and the port number is 5, use the ovs-ofctl –O OpenFlow13 dump-flows vswitch0 | grep 200.. | grep ”in_port=5” command to identify whether the user-mode flow table of the port exists.
¡To identify whether the ACL or stateful firewall flow table has been deployed, follow these steps:
- Use the ovs_dbg_listports command to view the port number corresponding to the virtual NIC.
- If the vSwitch is vswitch0 and the port number is 5, use the ovs-ofctl –O OpenFlow13 dump-flows vswitch0 | grep 300.. | grep ”in_port=5\| reg1= 0x5” command to identify whether the user-mode flow table of the port exists.
¡To identify whether the flow table for flow rate limiting has been deployed, follow these steps:
- Use the ovs_dbg_listports command to view the port number corresponding to the virtual NIC.
- If the vSwitch is vswitch0 and the port number is 5, use the ovs-ofctl –O OpenFlow13 dump-flows vswitch0 | grep 600.. | grep ”in_port=5” command to identify whether the user-mode flow table of the port exists.
- Use the ovs-ofctl -O OpenFlow13 dump-meters vswitch0 command to display the flow rate limiting policy corresponding to a meter.
Risks and precautions
This section describes the risks and precautions of the operations.
Risks
· If you manually delete the flow table of a port in the back end to cause inconsistent configuration in the front end, the configuration will fail.
· Manually edit the configuration file in the back end.
Precautions
· Precaution 1: The stateful firewall and ACL rules share a mechanism. The only difference is the statematch field of the boolean type is added in the in XML file. The value of true indicates a stateful rule, and the value of false indicates a stateless rule. The direction field in a rule in the XML rule file applies to vSwitches.
<filter name='FW_wjblack' chain='mac_fw' priority='-800'>
<uuid>2331596e-4942-4c20-95d1-b5a665412e17</uuid>
<rule action='accept' direction='in' priority='4' statematch='true'>
<all/>
</rule>
<rule action='accept' direction='out' priority='4' statematch='true'>
<all/>
</rule>
<rule action='accept' direction='in' priority='4' statematch='true'>
<all-ipv6/>
</rule>
<rule action='accept' direction='out' priority='4' statematch='true'>
<all-ipv6/>
</rule>
</filter>
· Precaution 2: DPDK does not support stateful firewalls.
· Precaution 3: The net-agent supports third-party OVSs, such as S1020V, but does not support deploying stateful firewall policies.
· Precaution 4:
¡ The E0509 version and later supports vFirewalls.
¡ ACLs and vFirewalls are mutually exclusive. If a vFirewall is configured, ACLs will be invalidated.
¡ After you configure a firewall rule named xxx on the CVM page, the corresponding file named FW_xxx.xml is generated in the back end.
¡ On the CVM page, the ACL directions apply to OVSs, and the firewall directions apply to VM NICs. However, the direction fields in the XML file (/etc/libvirt/nwfilter/xxx.xml) generated in the back end apply to only OVSs.
¡ The vFirewall allows all DHCP connections by default. To filter DHCP messages for a VM, configure the corresponding ACL policy for the VM.
¡ The system supports two vFirewall types, including allowlist and denylist. The default type is allowlist.
- The allowlist firewall allows matching packets to pass and drops other packets based on the specified rules.
- The denylist firewall drops matching packets and allows other packets to pass based on the specified rules.
Two directions are available for applying vFirewall rules, including inbound and outbound.
- Inbound—Direction from the remote site to the VM.
- Outbound—Direction from the VM to a remote site.
CAS operation risks
This section describes only operations with risks, and does not describe operations without risks. For example, deleting an image, bringing down a physical NIC, suspending VMs, and editing port profiles.
· Manually kill the net-agent process in the back end, which will cause the flow table deployment to fail.
· Manually edit the content of the XML file for the port profile in the back end, which will cause inconsistent reference relationships.
· Manually edit the XML configuration file in the back end, which will cause configuration inconsistency between the front end and back end.
· Manually delete the flow tables of the ports in the back end, which will cause inconsistency between configured rules and deployed flow tables and thus invalidate the configuration.
vNetwork configuration procedures
You can configure various network information for virtual NICs through the CVM interface, including:
· Network: You can select the corresponding vSwitch.
· Port Profile: VLAN, ACL, rate-limiting (flow rate limiting or general rate limiting), and network priority.
· vFirewalls: If both ACLs and vFirewalls are configured, the vFirewall takes effect.
· MAC Assignment: MAC addresses can be automatically allocated by CVM or manually assigned.
· IP-MAC Binding: After the MAC address of a VM is bound to its IP address, the VM can communicate through only the bound IP. This function is implemented through an OVS flow table on the CVK host.
NOTE: Configuring an IP-MAC binding does not configure an IP address for the VM.
· Manual: Configure a static IP address for VM by using CAStools.
· DHCP: Configure an IP address for a VM by using CAStools in DHCP mode.
· NIC Type: Specify the type of the virtual NIC. Options include High-Speed NIC (10 Gbps), Common NIC (100 Mbps), and Intel e1000 NIC (1000 Mbps).
· Fast Forwarding: Enable this function to improve performance. Only high-speed NICs support this feature.
· Hot Swappable: Whether the device supports hot-plugging in a VM.
· MTU: Set the MTU of a virtual NIC.
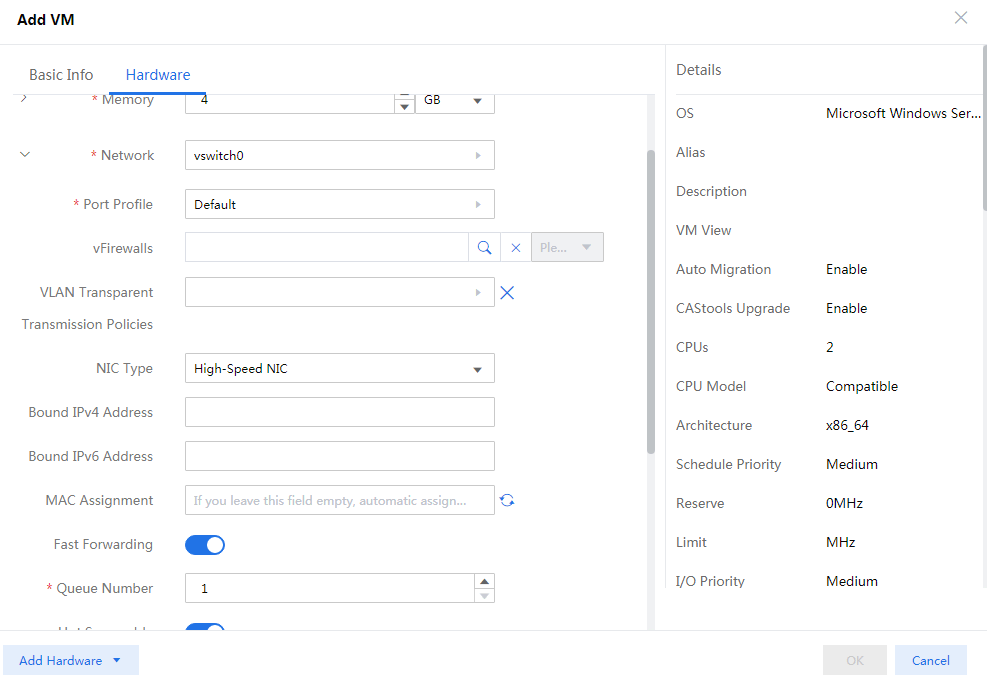
You can use the virsh dumpxml vm_name command to view the VM's XML file. The main information of the virtual NIC node for the above functions in the XML file of the VM is as shown in the following figure.
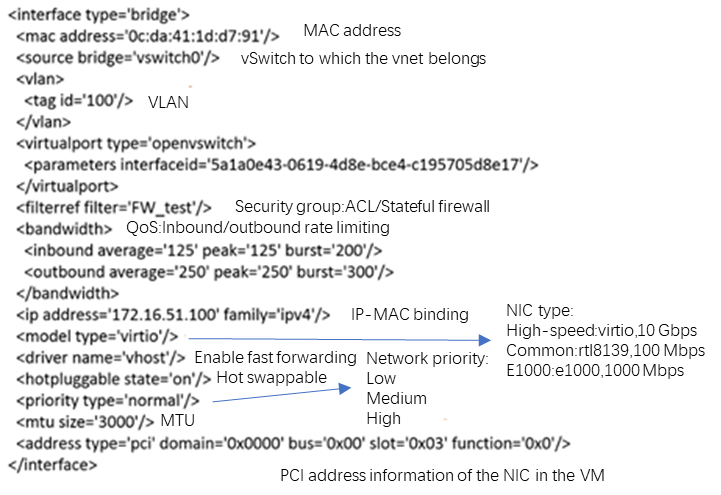
vSwitch
The interface for configuring vSwitches of CAS is shown in the following figure:
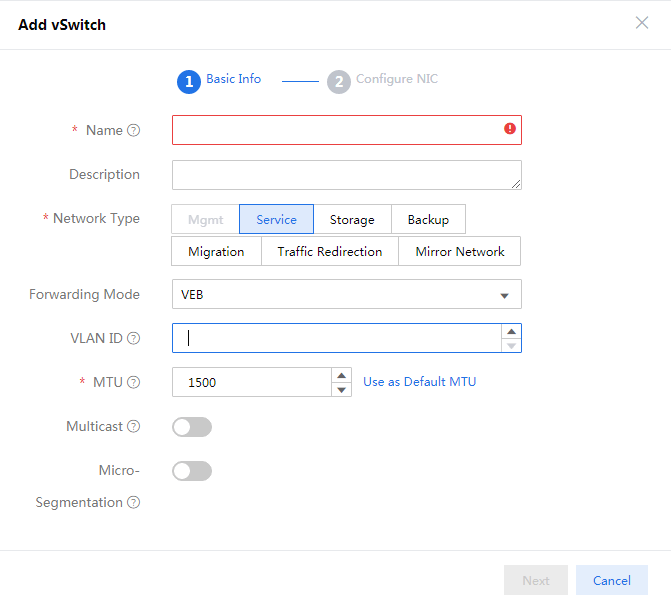
Parameters
· Name: Name of the vSwitch. NOTE: This field supports up to 15 characters.
· Network Type: Specify the functions of the vSwitch for easier management in the front end. Different types of vSwitches might have different restrictions.
¡You can add multiple network type labels to a vSwitch to indicate its various functions.
¡You must configure IP addresses for the vSwitches of storage, backup, and migration networks. You do not need to configure IP addresses for the vSwitches of the service network.
¡vSwitches of storage, backup, and migration networks are used by services on hosts, and they cannot have virtual NICs created. To create a virtual NIC for a vSwitch, add the service network label.
¡vSwitches of storage, backup, and migration networks must be configured with physical NICs.
¡The network types can be hot edited.
· Forwarding Mode: Options are VEB and VXLAN(SDN).
¡VEB: CAS uses the VEB mode by default.
¡VXLAN(SDN): S1020V (the host overlay scenario) is required to support the VXLAN (SDN) forwarding mode. CAS does not support this mode.
NOTE: vSwitches do not support switchover between VEB and VXLAN (SDN) modes.
· VLAN ID: Configure the VLAN ID for the local port of a vSwitch. For more information about the local port, see the preceding information. By default, the VLAN ID is empty, indicating the port is of the trunk type. After a VLAN ID is configured, the local port can only receive packets with the same VLAN.
NOTE: This VLAN only affects the transmission and reception of packets on the local port of the host, and does not affect the transmission and reception of packets on the VM.
· MTU: Modify the MTU of the local port on the vSwitch.
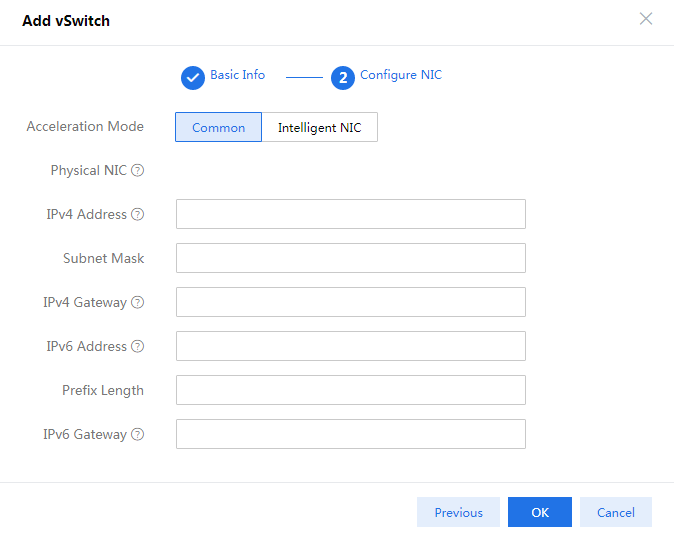
VLAN forwarding
The Virtual Local Area Network (VLAN) technology divides a physical LAN into multiple logical LANs. Hosts in the same VLAN can communicate directly, while hosts in different VLANs cannot. In this way, network isolation at Layer 2 is achieved. After VLANs are divided, broadcast packets are restricted to the same VLAN, making each VLAN a broadcast domain and effectively limiting the scope of broadcast domains. When the protocol field of a Layer 2 packet is 0x8100, it means that the packet has a 12-bit VLAN tag. Because VLAN IDs 0 and 4095 are reserved, the VLAN ID is in the range of 1 to 4094.
According to the VLAN forwarding behavior, ports include two types: access and trunk. On an OVS, if a port is configured with a VLAN tag, it is an access port. The OVS strips the VLAN tag of a packet and forwards the packet to the corresponding port with the same VLAN tag. If a port is not configured with a VLAN tag, it is a trunk port and can receive packets from all VLANs and transparently transmit the packets through VLANs.
Use the ovs-vsctl show command to view the VLAN ID of a port. For example, the VLAN ID of port vnet2 is 100 as shown in the following figure.
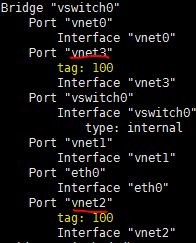
Related commands
Use the ovs-vsctl set port vnet2 tag=100 command to configure the VLAN ID of virtual port vnet2 as 100 .
Use the ovs-vsctl set port vnet2 tag=[] command to configure vnet2 as a trunk port.
Use the ovs-vsctl show command to view the VLAN information of all ports.
Use the ovs-vsctl --if-exists get port vnet0 tag command to obtain the VLAN ID of port vnet0.
Use the /opt/bin/ovs_dbg_listports command to display network configuration information.
Restrictions and guidelines
· Changing the VLAN ID of a port might result in network interruption.
· When the VM network is not reachable, first identify whether the VLAN ID is configured correctly by using the method mentioned above.
· You can configure a VLAN ID on a vSwitch. After that, the vSwitch can forward packets only in that VLAN.
Link aggregation
Link aggregation bundles multiple physical Ethernet links into a logical link to increase bandwidth. The bundled links redundantly back up each other to improve reliability.
CAS supports the OVS aggregation method, and the following types of aggregation are supported:
Depending on whether Link Aggregation Control Protocol (LACP) is enabled, link aggregation includes the following types:
· Static—LACP is disabled.
· Dynamic—LACP is enabled to synchronize port and link state between switch and host at the specified intervals. LACP messages are transmitted every 30 seconds.
According to the load sharing method, link aggregation includes the following types:
· Active/standby load sharing—The active link is used for communication. The standby link does not transmit packets and drops the received packets by default. After the active link goes down, the standby link will automatically become the active link.
In the active/standby aggregation scenario, CAS supports using two algorithms for active link election, as shown in the following figure.
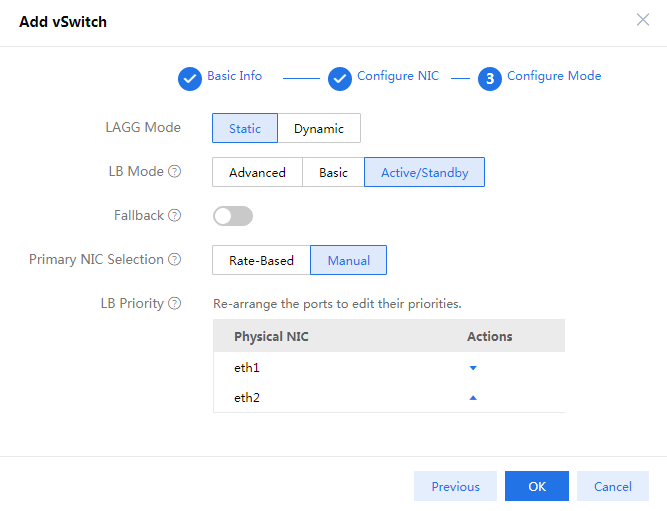
¡Rate-Based—The system selects the aggregation member link with the highest-speed physical NIC as the active link. If multiple NICs have the same speed, the system selects the NIC ranked first.
¡Manual—The system selects the aggregation member link with the highest-priority physical NIC as the active link. The NIC priority order is user-defined. You can change the NIC priority order.
If you select Yes for the Fallback field in the figure above, services will be switched back to the active link after the selected active link NIC goes down and then recovers. If you select No, services will not be switched back and the active link can only be used as a backup link after the active link NIC goes down and recovers.
· Basic load sharing—The forwarding interface for a packet is determined by hashing its source MAC and VLAN fields. As a best practice, do not use basic load balancing in an environment where the traffic is less diverse, because it only hashes based on source MAC and VLAN for load balancing.
· Advanced load sharing—Hashes the Ethernet type, source/destination MAC address, VLAN, IP packet protocol, source/destination IP/IPv6 address, and source/destination port fields to determine the forwarding interface for a packet.
You can use the ovs-appctl bond/show command to check the aggregation configuration and status of the host as follows:
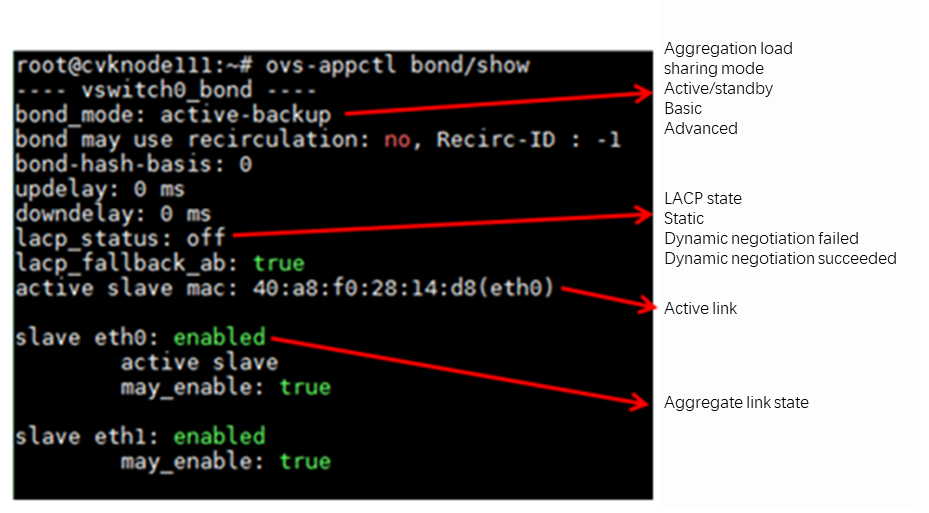
Restrictions and guidelines
· After aggregation is configured, the OVS will rebalance the link traffic every 10 seconds based on the algorithm to ensure traffic is evenly distributed across each link.
· When two ports in an aggregation are connected to different VCs that do not support stacking, CAS aggregation can only use the active/standby mode.
· When the aggregation mode is LACP on the CAS side, the peer device must also support LACP.
· When an S1020V switch is used in CAS, the aggregation used by the S1020V is the bond function of the Linux kernel.
· Except for the active/standby mode, other modes require the corresponding aggregation group configuration on the switch.
Typical aggregation issues
· When configuring the active/standby mode, disable LLDP on the physical NICs in the VC (switching module of the blade server) environment, because LLDP might cause MAC address moves and packet loss.
· When configuring the active/standby aggregation mode, if there is no IPv6-capable switch or gateway in the environment, the physical NIC will periodically send ICMP RS packets, causing MAC moves and packet loss.
You can use the echo 0 > /proc/sys/net/ipv6/conf/ethx/disable_ipv6 command to disable IPv6 for the NIC ethx.
This issue exists in versions earlier than CAS E0705 and has been fixed in versions E0705 and later.
· In the static aggregation scenario using a BCM5719 NIC, if you manually shut down the interface by using the ifdown or ifconfig down command in the back end, the link-down event will not be detected by the peer switch. Therefore, if the peer switch selects this down link to forward packets, network failures will occur.
For more information about this issue, see H3C Technical Announcement [2017] No. 026-Announcement on Static Link Aggregation Switchover Failures Caused by Suspending NICs in CAS Under Certain Conditions.
· In the dynamic aggregation scenario, after an aggregation group is configured on a switch, the configuration of aggregation member ports cannot be edited without proper consideration. Modifying the configuration of a port might cause it to become unselected, leading to network disruption.
In this case, you must reconfigure the aggregation group on the switch to make the aggregation work again.
Multi-network integration
Multi-network integration refers to carrying traffic from multiple networks (such as management network, service network, and storage network) on a single virtual switch. In environments where NIC resources are limited, it is important to plan the network properly to effectively ensure the bandwidth allocation for each network.
On the CVM virtual switch tab, click Add to configure the multi-network integration.
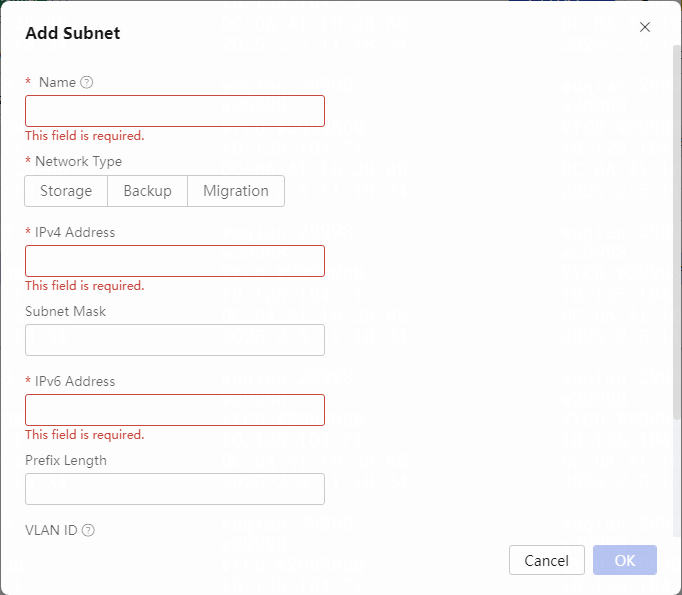
The bandwidth ratio indicates the proportion of the total bandwidth of the physical NIC occupied by the subnet. The underlying rate limiting for multi-network integration is realized through Linux Traffic Control (TC).
Restrictions and guidelines
· To enable multi-network integration, you must fully estimate the bandwidth of each network. If the traffic in the network is too large, it might cause the traffic to exceed the bandwidth limit and cause packet drop.
· The subnets created through multi-network integration are intended for host communication and cannot be used by VMs.
VM security
Security group is a type of virtual firewall with state detection and packet filtering functions. It can define security zones in the cloud. You can configure security group rules to control the inbound and outbound traffic of one or more VMs in the security group.
CAS does not support security groups (CAS has no concept of groups). When the security group of the Cloud OS is mapped to CAS, it can be implemented as either an ACL or a virtual firewall.
ACL
An access control list (ACL) is a collection of one or more rules. Each rule includes match criteria such as source address, destination address, port number, and corresponding actions, such as drop and permit. Each rule can be divided into inbound and outbound rules.
The inbound and outbound mentioned here are relative to the vSwitch. The inbound direction indicates the direction of traffic entering the vSwitch, which is the outbound direction of the VM. The outbound indicates the direction of traffic leaving the vSwitch, which is the inbound direction of the VM.
ACLs by network layer
· Layer 2 ACLs: The source and destination MAC addresses, and link layer protocol type, such as ARP, RARP, IPv4, IPv6 and all protocol types.
· Layer 3 ACLs and Layer 4 ACLs: The source and destination IP addresses, source and destination port number, and protocol type, such as ICMP, TCP, UDP and all protocol types.
Layer2, Layer3, and Layer 4 ACLs all support the time range function, which means you can specify the effective time range of the ACLs.
Table 2 ACLs by matching packet layer
|
Level 1 |
Level 2 |
Remarks |
|
ACL |
Layer 2 ACLs |
You can configure the match criteria based on source and destination MAC addresses. |
|
Layer 3 ACLs |
You can configure the match criteria based on source and destination IP addresses. |
|
|
Layer 4 ACLs |
You can configure the match criteria based on source and destination IP addresses, and source and destination port number. |
|
|
ACLs based on time ranges |
You can set the ACLs to take effect within the specified time period. |
ACLs by traffic direction
· Inbound ACLs: The inbound indicates the direction of traffic entering the vSwitch, which is the outbound direction of the VM. The inbound direction ACLs are implemented through the user-space flow table.
· Outbound ACLs: The outbound indicates the direction of traffic leaving the vSwitch, which is the inbound direction of the VM. Outbound ACLs are implemented using xnormal.
Virtual firewall
As from E0705 version, multiple security groups are supported, but only by virtual firewalls.
CVM stateful failover
Mechanisms
A CVM stateful failover system relies on data replication through Distributed Replicated Block Device (DRBD) to synchronize data between the primary and backup CVM hosts in the system. When the primary CVM host has data changes, the backup CVM host synchronizes its data with the primary CVM host in real time to ensure management data consistency.
After optimizing the CVM stateful failover, the CVM master slave daemon (CMSD) program is able to use Corosync, Pacemaker, and Glue.
The major functions of CMSD include the following:
· Cluster communication by using Corosync, Pacemaker, and Glue.
· Management of the stateful failover service, such as enabling or disabling this service or performing primary/backup switchover.
· Automatic service failover upon network or host failure.
CMSD process and service management information of CVM stateful failover
Management and monitoring service of CMSD. The heartbeat detection mechanism between primary and backup servers is implemented by CMSD unicast. CMSD includes the basic functions of corosync and pacemaker. The CMSD on two CVMs will communicate with each other. If the primary server is detected as abnormal, a switch will be triggered.
The hot backup management and monitoring services include DRBD service, Filesystem synchronization partition, MySQL service, CVM service, and virtual IP address.
Common commands used for troubleshooting
You can use the management console to view relevant information about the stateful failover, or you can use the following commands:
· Use the ms_get_peer_ip.sh command to view the stateful failover peer port address.
· Use the crm status command to view the primary-backup quorum and service of stateful failover.
· Use the drbd-overview command to view the primary-backup relationship of the DRBD, and if a split-brain exits.
· Use the ms_info.sh peer online command in the front end to identify whether the backup host is online.
· Use the ms_info.sh controller online command in the front end to identify whether the advanced quorum is online.
Log analysis and common issue troubleshooting process
This section describes the log locations, log file names, and issue analysis process.
CVM deployment log: Log files of the two deployment hosts: /var/log/cvm_master_slave.log; /var/log/cvm_master.log
CVM runtime log, including the main program cmsd log and drbd log.
· Host cmsd log file: /var/log/cmsd/cmsd.log.
· Host drbd log file: /var/log/syslog. Problems with drbd will be recorded in syslog.
Restrictions and guidelines
Risks
You cannot split a stateful failover system into two independent CVM platforms.
Restrictions and guidelines
· When setting up the network, you must follow the requirements in the stateful failover deployment manual when installing hosts and deploying hosts. If you cannot do that, the installed host might not be set up and needs to be reinstalled.
· When only one CVM host is running, the faulty one needs to be restored to normal, so that the primary and backup can be synchronized. Do not directly switch to the failed host as the primary host when the primary and backup hosts are not synchronized.
libvirt/qemu
qemu/kvm
Mechanisms
· What is QEMU?
QEMU is a virtual machine monitor (VMM) on the host that simulates the CPU through dynamic binary translation and provides a range of hardware models. The guest OS is interacting with the simulated hardware created by QEMU, and QEMU then translates these instructions for the real hardware to execute. The guest OS can interact with hard disks, network cards, CPUs, CD-ROMs, audio devices, and USB devices on the host. However, because all instructions need to be translated by QEMU, the performance is relatively low.
· What is KVM?
KVM is a virtualization architecture provided by the Linux kernel, which can directly use the kernel as the hypervisor. KVM requires processor hardware that supports virtualization extensions, such as Intel VT and AMD AMD-V technology. As from 2.6.20 version, KVM has been merged into the trunk and released as a module to FreeBSD and illumos. In addition to supporting x86 processors, it also supports platforms such as S/390, PowerPC, IA-61, and ARM.
KVM includes a kernel module kvm.ko to implement core virtualization features, and a module closely related to the processor, such as kvm-intel.ko or kvm-amd.ko. KVM itself does not implement any simulation, but only exposes a /dev/kvm interface. The interface can be used by the host to create vCPUs, allocate virtual memory address space, read and write vCPU registers, and run vCPUs. With KVM, guest OS CPU instructions can be directly executed without going through QEMU translation, greatly improving the running speed. However, KVM's kvm.ko only provides CPU and memory virtualization, so it must be combined with QEMU to form a complete virtualization technology.
· What is QEMU-KVM?
As mentioned earlier, KVM is responsible for CPU virtualization and memory virtualization, realizing CPU and memory virtualization. However, KVM cannot simulate other devices, so it must have a tool running in user space. The developers of KVM chose the mature open source virtualization software QEMU as this tool. QEMU simulates IO devices (such as network cards, and disks), modifies them, and finally forms QEMU-KVM.
In QEMU-KVM, KVM runs in kernel space,
and QEMU runs in user space. QEMU simulates and creates various virtual
hardware. QEMU integrates KVM, and calls /ioctl to /dev/kvm, thus part of the
CPU instructions is handed over to the kernel module for processing. KVM
realizes the virtualization of CPU and memory, but KVM cannot virtualize other
hardware devices. QEMU can simulate IO devices, such as disks, network cards,
and graphics cards. QEMU-KVM is a complete server virtualization.
The two major functions of QEMU-KVM are as follows:
¡Provide virtualization for CPU, memory (by KVM), and IO devices (by QEMU).
¡Manage the creation and call of various virtual devices (by QEMU).
In this solution, QEMU simulates other hardware devices, such as network and disk, which also affects the performance of these devices. As a result, pass-through semi-virtualized devices virtio_blk and virtio_net were developed to improve device performance.
Figure 25 Qemu/kvm diagram
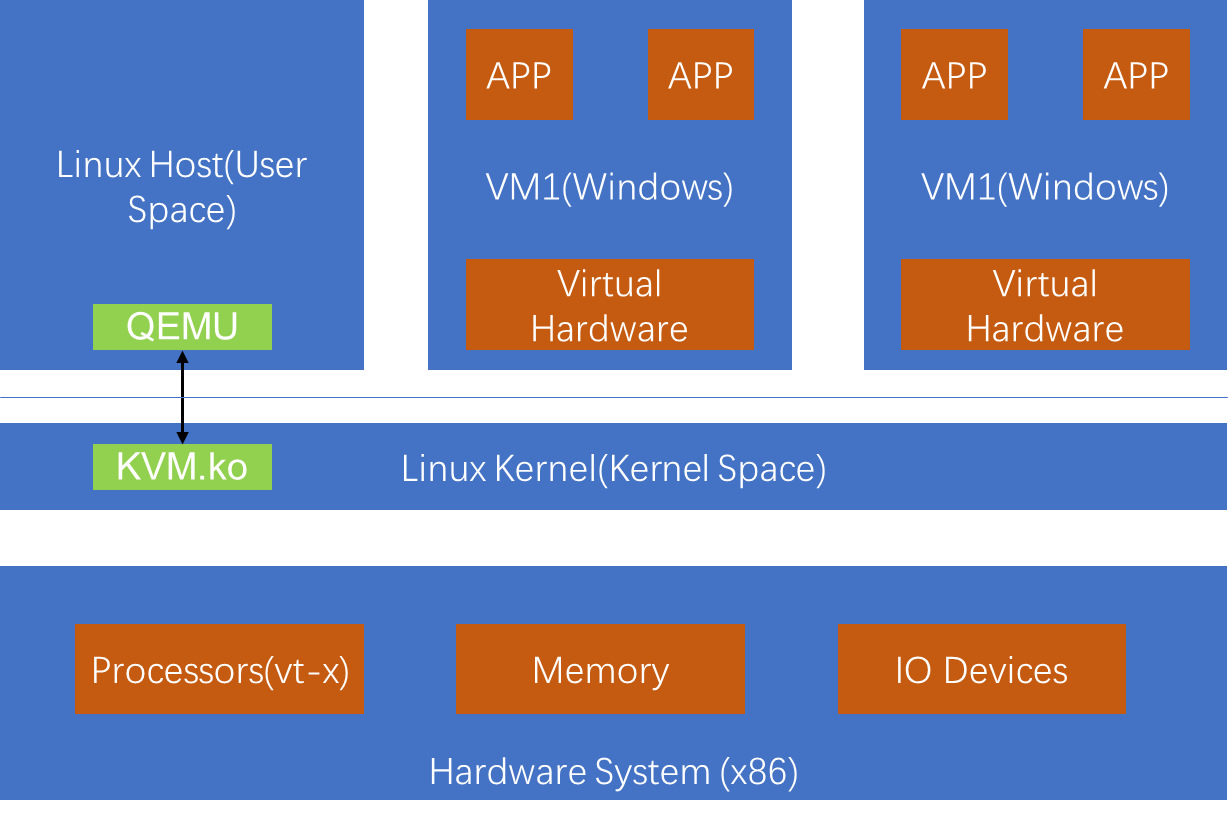
Qemu/kvm process and service management information
In CAS, each virtual machine corresponds to a user space process in Linux, which can be queried using the ps aux | grep virtual machine name.
Common commands used for troubleshooting
ps command, top command, iostat command, and so on.
Corresponding log analysis and common issue troubleshooting process
The logs of qemu are located in the path /var/log/libvirt/qemu/, with the filename being the name of the virtual machine + .log. When the log file is too large, it will be truncated and renamed to create a new log file. The file /var/log/libvirt/qemu/virtual machine name.log always retains the latest logs.
root@cvknode108:/var/log/libvirt/qemu# ll cvd-client-centos7.5.log*
-rw------- 1 root root 16900 Feb 3 09:13 cvd-client-centos7.5.log
-rw------- 1 root root 115 Dec 23 02:01 cvd-client-centos7.5.log.1
For analysis and troubleshooting process of common issues related to kvm/qemu, contact Technical Support.
Restrictions and guidelines
In CAS, each virtual machine corresponds to a user-level process in Linux. If you want to shut down a virtual machine, do that in the front end interface. If you must kill or restart the process, contact CAS R&D for confirmation.
Libvirt module
Mechanisms
Libvirt is a collection of software products that provide a convenient way to manage VMs and other virtualization functions such as storage and network interfaces. The software products include a stable C language API, a daemon (libvirtd), and a command-line tool (virsh). The main goal of Libvirt is to provide a unified approach for managing various virtualization solutions and virtual hosts, including KVM/QEMU, Xen, LXC,OpenVZ or VirtualBox hypervisors.
Figure 26 Libvirt context
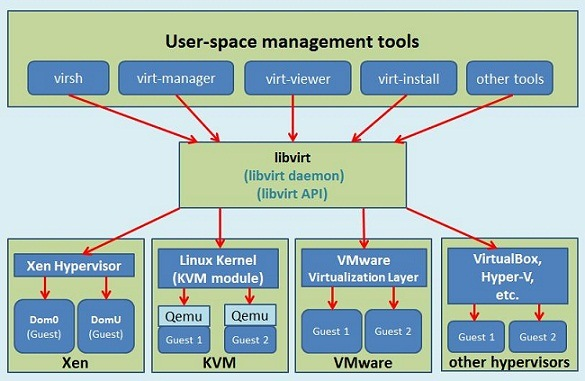
The main features of Libvirt are as follows:
· VM management—Operations for various virtual machine life cycles, such as start, stop, pause, save, restore, and migration. Hot swap operations for various types of devices including disks, network interfaces, memory, and CPU.
· Remote connection—All functions of libvirt can be executed on the machine running the libvirt daemon, including remote machines. With the simplest and without additional configuration SSH protocol, remote connections support multiple network connections.
· Storage management—Any host running the libvirt daemon can be used to manage multiple types of storage, create multiple types of file images (qcow2, vmdk, raw), mount NFS shares, enumerate existing LVM volume groups, create new LVM volume groups and logical volumes, partition raw disk devices, mount iSCSI shares, and more.
· Network interface management—Any host running the libvirt daemon can be used to manage physical and logical network interfaces, enumerate existing interfaces, and configure and create interfaces, bridge, VLAN, and port binding.
· Virtual NAT and routing-based networks—Any host running the libvirt daemon can manage and create virtual networks. Libvirt virtual networks use firewall rules to implement a router that provides transparent access for VMs to the host network.
The Libvirt architecture includes the following three layers:
· Interface layer—Includes the virsh command line tool and APIs provided to third-party software.
· Abstraction driver layer—Includes unified abstractions for various drivers, such as network drivers, storage drivers.
· Concrete driver layer—Specific driver implementations, with separate sets of implementations for each type of virtualization, such as qemu drivers and xen drivers.
Figure 27 Libvirt layered architecture
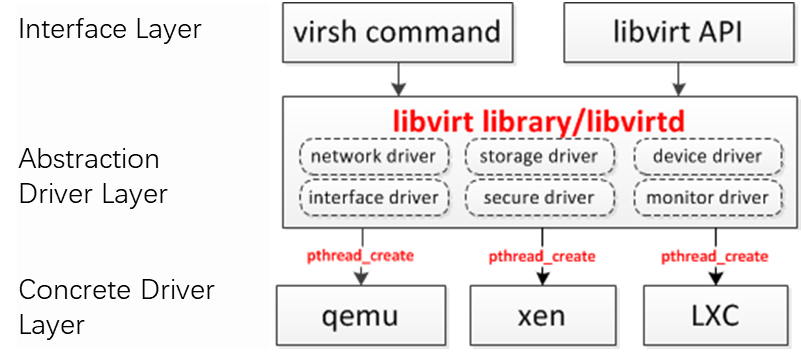
Lbvirt process and service management information
Libvirtd service process: The service name is libvirt-bin and you can identify whether the libvirtd service is running by using the ps aux | grep libvirtd command or the service libvirt-bin status command.
root@cvknode35101:~# ps aux | grep libvirtd
root 22556 0.6 0.0 1103268 24228 ? Sl Feb28 27:23 /usr/sbin/libvirtd -d
root 23956 0.0 0.0 8156 2012 pts/0 S+ 06:40 0:00 grep --color=auto libvirtd
root@cvknode35101:~# service libvirt-bin status
* Checking status of libvirt management daemon libvirtd * running 22556 [ OK ]
Virtagent service process: The service name is virtagent and you can identify whether the virtagent service is running by using the ps aux | grep virtagent command or the service virtagent status command.
root@cvknode35101:/var/log/libvirt# ps aux | grep virtagent
root 4604 0.0 0.0 658968 12888 ? Sl Feb20 3:43 /usr/sbin/virtagen -d
root 13028 0.0 0.0 8160 2104 pts/0 S+ 06:54 0:00 grep --color=auto virtagent
root@cvknode35101:/var/log/libvirt# service virtagent status
* Checking status of libvirt agent daemon virtagent [ OK ]
Common commands used for troubleshooting
· Use the ps aux | grep libvirtd command or the service libvirt-bin status command to identify whether the libvirtd process is running.
· Use the virsh version command to check the current qemu and libvirt versions.
Common commands related to VMs (vm-name represents the VM name).
|
virsh list --all |
List all VMs and their status on the current CVK. |
|
virsh dumpxml vm-name |
Retrieve the XML file for the current state of the VM configuration. |
|
virsh define vm.xml |
Create a VM through XML. |
|
virsh undefine vm-name |
Remove a VM from libvirt. |
|
virsh start vm-name |
Power on a VM. |
|
virsh suspend vm-name |
Suspend a VM. |
|
virsh resume vm-name |
Resume a suspended VM. |
|
virsh shutdown vm-name |
Normally shut down a VM. |
|
virsh destroy vm-name |
Power off. |
|
virsh domblklist vm-name |
Query VM storage devices. |
|
virsh domjobinfo vm-name |
Search VM current task status. |
|
virsh dominfo vm-name |
Query VM information. |
|
virsh vncdisplay vm-name |
List the VM vnc port numbers. |
Common commands related to storage pools (pool-name represents the storage pool name)
|
virsh pool-list |
List the storage pools of the current CVK. |
|
virsh pool-info pool-name |
Display the storage pool information. |
|
virsh pool-dumpxml pool-name |
Display the current configuration xml of the storage pool. |
Common commands for qemu-img (disk_path represents the disk path and disk name)
|
qemu-img info disk_path |
Display disk information. |
|
qemu-img check disk_path |
Check a disk. |
|
qemu-img convert |
Disk format conversion. |
|
qemu-img rebase |
Modify the backing-file relationship of multi-level disks. |
For example, convert the debian94 disk in qcow2 format to debian94.raw in raw format.
· qemu-img convert -O raw debian94 debian94.raw
· For example, change base2-->base1-->base0 to base2-->base0.
· qemu-img rebase my_base_2 -b my_base_0
Other query commands
|
virsh snapshot-list vm-name |
Obtain snapshot for a VM. |
|
qemu-img snapshot –l disk_path |
Query the snapshot on this disk. |
|
virsh domiflist vm-name |
Query VMs NIC. |
Log analysis and common issue troubleshooting process
The log of libvirtd is located in /var/log/libvirt/libvirtd.log. When the log file is large, it will be truncated, compressed, and renamed to generate a new log file. /var/log/libvirt/libvirtd.log always keeps the latest logs.
root@cvknode108:/var/log/libvirt# ls -al /var/log/libvirt/
total 287740
drwxr-xr-x 5 root root 4096 Mar 2 02:01 .
drwxr-xr-x 27 root root 12288 Mar 2 14:59 ..
-rw------- 1 root root 34495311 Mar 2 14:59 libvirtd.log
-rw------- 1 root root 181644412 Mar 1 06:36 libvirtd.log.1
-rw------- 1 root root 6082169 Feb 23 06:34 libvirtd.log.2.gz
-rw------- 1 root root 6142044 Feb 16 06:40 libvirtd.log.3.gz
Restrictions and guidelines
· Libvirtd is one of the core service processes in virtualization. As a best practice, make sure the process is running normally. To kill or restart the process, evaluate the risks beforehand. Especially for VMs with Chinese names (some versions), restarting the process might lead to a risk of virtual machine corruption. Contact relevant departments to confirm in advance.
· The virsh command can be used to manage VMs and storage pools. You can use the query command for virsh in most cases. If you want to modify the VM or storage pool, switch to the front end interface.
CAStools
qemu-ga module
Principle and implementation
The qemu-ga module, with the full name qemu-guest-agent, is a common application running in a VM. By default, the executable file name of this module is qemu-ga. This module can be used for implementing a host-VM interaction that does not rely on the network but on the virtio-serial interface (default preferred method) or isa-serial interface. QEMU emulates a serial device in the VM, creates a Unix socket file on the host, and provides data exchange channels.
In a VM system, the qemu-ga service provides qemu-ga functions.
Restrictions and guidelines
Before executing qemu-ga commands, verify that the VM is running and view the CAS interface to verify that CAStools is also running.
Commonly used troubleshooting methods
Commonly used methods for troubleshooting the qemu-ga module are as follows:
· Make sure CAStools has been successfully installed on the VM system.
· View the CAS interface to check whether CAStools is running properly.
· In the CVK backend, execute the virsh qemu-agent-command vm-name '{"execute":"guest-info"}' command to check whether an error is returned. If no error is returned, the qemu program is running properly. The value for the vm-name argument is the name of the VM in the current environment.
· In the VM, check the running status of the qemu-ga service in the following methods:
¡ In a Windows environment, check whether the qemu-ga service is running properly in the service dialog box.
¡ In a Linux environment, execute the service qemu-ga status command to check the program status.
· Analyze and troubleshoot issues based on logs.
The log storage directories vary by operation system:
¡ In a Windows system, qemu-ga logs are stored in directory C:\Program Files\CAS tools\qemu-ga.log.
¡ In a Linux system, qemu-ga logs are stored in directory /var/log/qemu-ga.log.
Check the logs to roughly obtain the causes for the issues. For example, logs related to the message open channel error typically indicate issues with opening a serial port device on a VM.
¡ In a Windows environment, you can troubleshoot whether the virtio driver for the serial port device is installed properly by viewing information about the serial port device in Device Manager. CAStools integrates the virtio drivers for Windows system. The virtio drivers are stored in directory C:\\Program Files\\CAS tools\\driver. If a driver is abnormal, you can manually select this directory to update or repair the driver in Device Manager.
¡ The Linux system has integrated the virtio driver system by default. Exceptions rarely occur as long as the system kernel is not too old.
libguestfs module
Principle and implementation
The main principle of the libguestfs module is to mount a VM's disk to a minimal system, allowing read and write access to the VM's disk without starting the VM. Castools calls this module to implement offline modification of VM information, such as offline modification of VM network addresses and writing of VM initialization information.
This module is called only in offline modification of VM information.
Restrictions and guidelines
This module can be called only when a VM is shut down.
Commonly used troubleshooting methods
Commonly used methods for troubleshooting the libguestfs module are as follows:
· Manually shut down the test VM, modify its network-related information, and check logs to troubleshoot issues.
· To check the functionality of the libguestfs module separately, execute the libguestfs-test-tool command in the backend.
· Analyze and troubleshoot issues based on logs.
Most of CAStools logs for the libguestfs module are stored in directory /var/log/castools.log on the CVK. For Windows system VMs, if full deployment is used, the logs are stored in directory /var/log/sysprep.log.
You can view logs to identify the causes. For example, if libguestfs related features cannot be used, verify that the VM is installed with an operating system that has no anomalies or damages, and that CAStools has been completely installed on the VM. If these conditions are not met, you can view related logs recording errors.
GPU
GPU virtualization
The mechanism of GPU virtualization is shown in Figure 26.
Figure 28 GPU virtualization mechanism

NVIDIA Virtual GPU Manager is the core component to implement vGPU functions. It virtualizes a physical GPU into multiple vGPUs. Each vGPU has exclusive use of its framebuffer, and uses the entire GPU Engines, including Graphics (3D), Video Encode, and Video Decode Engines in its fragmented time through the time-sharing multiplexing mechanism.
A vGPU operates as follows:
1. The physical GPU directly obtains and processes the instructions deployed by the graphics application to the NVIDIA Driver through DMA.
2. The physical GPU stores the rendered results in the video memory of the vGPU.
3. NVIDIA Driver directly grabs rendered data from the physical video memory.
Intelligent vGPU scheduling
Intelligent vGPU scheduling adds vGPU resources on different hosts in the same cluster to a service resource group, and adds VMs that provide the same service to a service VM group. Each VM will apply a service template. A service template defines the resource usage priorities for VMs and the maximum percentage of resources available for all the VMs that use that service template.
When a VM in a service VM group starts or restarts, H3C CAS CVM assigns resources depending on the availability of resources in the service resource group, the priority of the service template applied to the VM, and the percentage of resources available for the service template:
· If VMs in the same service VM group use the same service template with a specific priority, VMs that start earlier obtain vGPU resources first.
· If the number of available vGPUs in the service resource group is less than the number of VMs about to start in the service VM group, higher priority VMs will obtain vGPU resources first.
For example, as shown in Figure 27, 10 vGPU resources exist in the service resource group (resource pool) and 12 VMs exist in the service VM group. VMs VM1 through VM4 apply service template A (priority: low, allocation percentage: 20%), while VMs VM5 through VM12 apply service template B (priority: high, allocation percentage: 80%). If VMs VM1 through VM12 start simultaneously, higher-priority VMs VM5 through VM12 will obtain vGPU resources first. Among lower-priority VMs VM1 through VM4, only two VMs will obtain vGPU resources. VMs that start earlier obtain vGPU resources first.
Figure 29 vGPU resource allocation example (1)
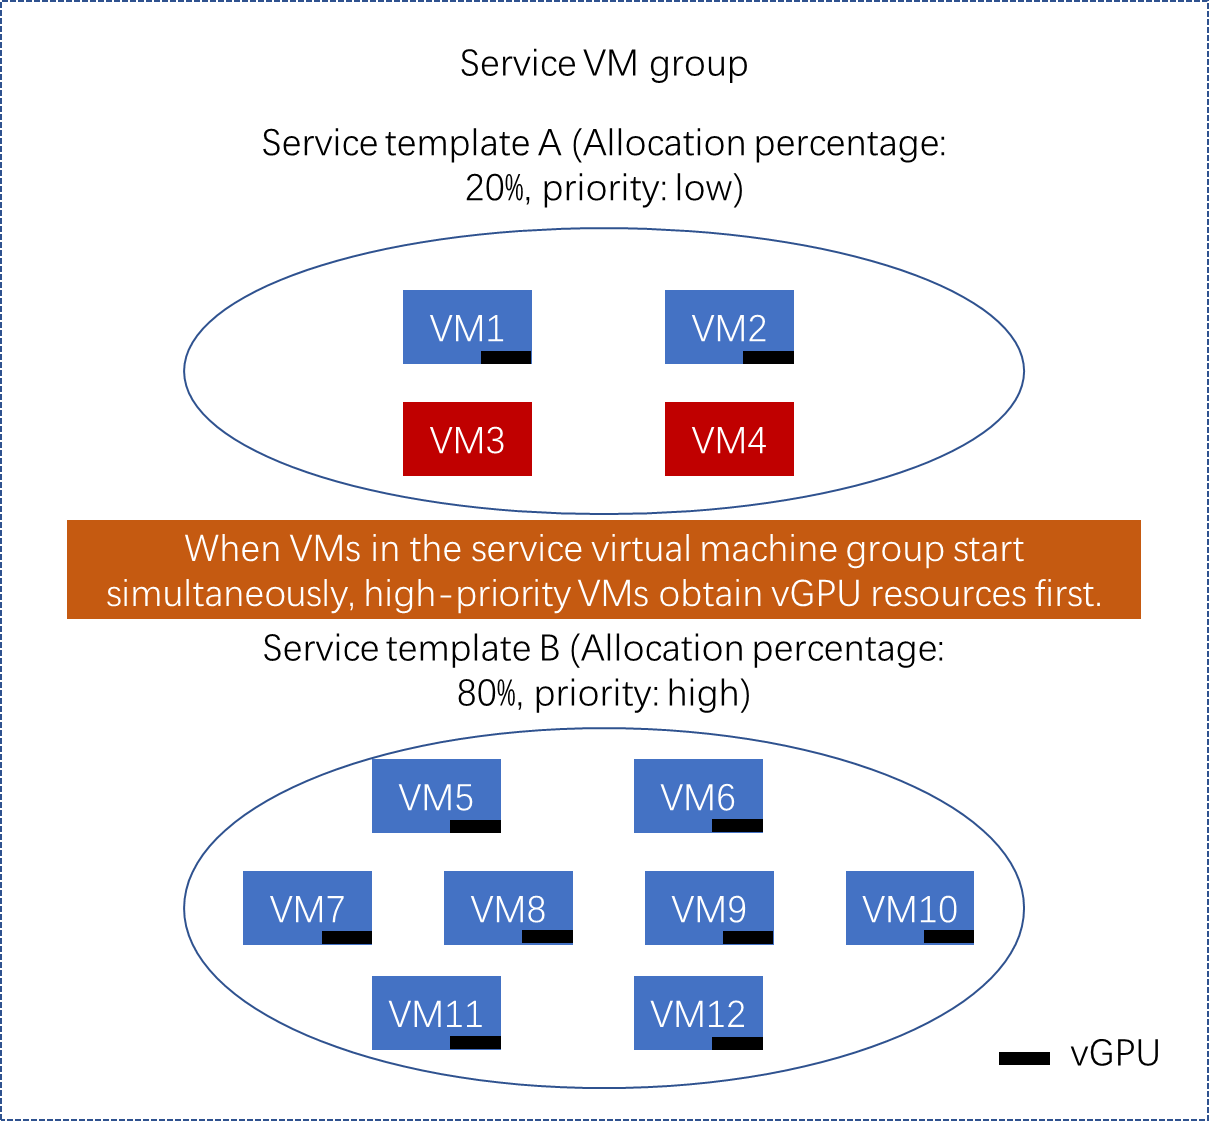
· The system releases some resources used by low-priority VMs to ensure the resource usage for high-priority VMs when the following conditions are met:
¡ The number of idle vGPUs in the service resource group is less than the number of high-priority VMs about to start in the service VM group.
¡ The total percentage of resources used by VMs using the same low-priority service template exceeds the percentage allocated to the service template.
For example, as shown in Figure 28, 10 vGPU resources exist in the service resource group (resource pool) and 12 VMs exist in the service VM group. VMs VM1 through VM4 apply service template A (priority: low, allocation percentage: 20%), while VMs VM5 through VM12 apply service template B (priority: high, allocation percentage: 80%). VMs VM1 through VM10 are running. Low-priority VMs VM1 through VM4 use a total of 4 vGPU resources, 40% (greater than service template A's allocation percentage 20%) of total resources. If high-priority VMs VM11 and VM12 start, they will preempt the vGPU resources used by low-priority VMs.
Figure 30 vGPU resource allocation example (2)
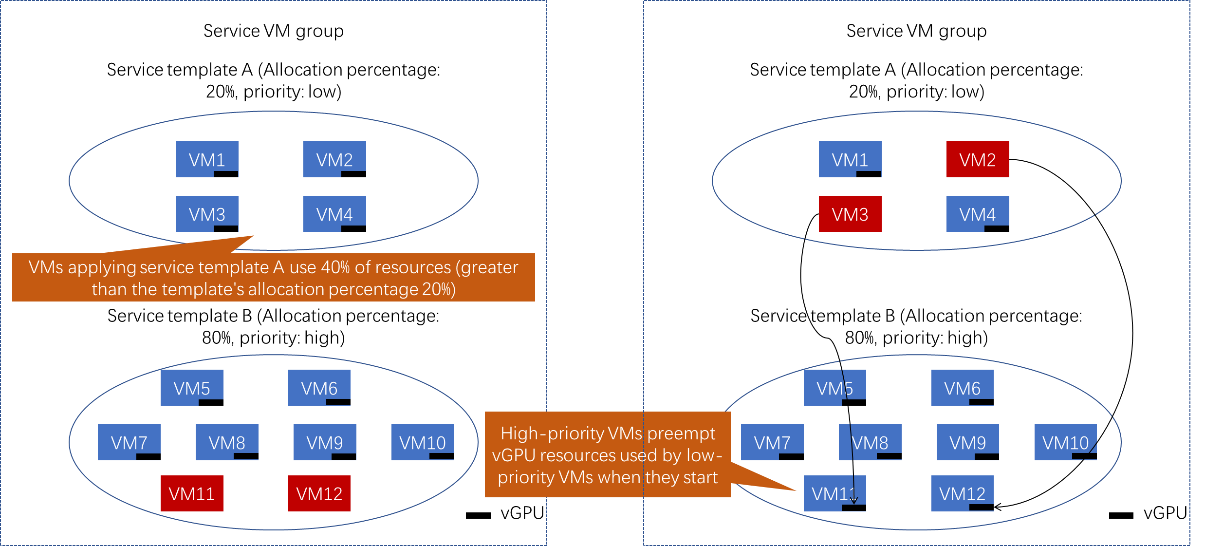
You can view relevant syslogs to identify the causes and analyze system anomalies.
Using and configuring NTP
About NTP
Network Time Protocol (NTP) is a UDP-based protocol for network time synchronization that synchronizes the clocks of computers in the network to UTC. Combined with the offset adjustment for each time zone, precise time synchronization can be achieved. Many servers provide NTP time synchronization, such as Microsoft's NTP server, which allows the device clock systems to operate correctly.
NTP is an application layer protocol for synchronizing time between distributed servers and clients. It defines the structures, algorithms, entities, and protocols used in implementation. The NTP protocol is based on IP and UDP and can be used by other protocol groups. The NTP protocol, evolved from Time Protocol and ICMP Timestamp Message, is specially designed mainly in terms of accuracy and robustness.
The benefits of NTP are as follows:
· NTP uses a stratum structure to describe the clock precision, and is able to quickly synchronize time among all devices within the network.
· NTP supports access control and MD5 authentication.
· NTP can send protocol packets in unicast, multicast, or broadcast mode.
NTP-related concepts
GMT and UTC
GMT, short for Greenwich Mean Time, is an international time standard. Noon GMT refers to the time when the sun crosses the Greenwich meridian (prime meridian). However, due to the uneven and irregular rotation of the Earth, GMT is not accurate and is no longer used as the world standard time.
UTC, short for Coordinated Universal Time, is a time measurement system based on atomic time seconds and is as close as possible to GMT. To ensure that the difference between UTC and GMT does not exceed 0.9 seconds, positive or negative leap seconds are added to UTC as needed. UTC is now used as the world standard time.
Therefore, UTC is basically the same as GMT, with an error of no more than 0.9 seconds.
Time zone
Because the Earth rotates from west to east, the east sees the sun first and the time in the east is earlier than that in the west. In order to unify the world's time, the 1884 International Meridian Conference stipulates that the world is divided into 24 time zones (12 to the east and 12 to the west of the UK). The UK, home to the former site of the Greenwich Observatory, is in the zero time zone (GMT+00). Beijing, China, is in the east zone 8 (GMT+08).
If the UK time is 6:00, the GMT time is 6:00, and Beijing time is 14:00.
UNIX timestamp
A UNIX timestamp in computers is the number of seconds from the GMT/UTC time 1970-01-01T00:00:00 to a specific time, regardless of leap seconds. This simplifies the complexity of computers' time operations.
For example, if the current system time of a computer with a default time zone of GMT+08 is February 27, 2015, 15:43:00, the time in the GMT+00 zone is February 27, 2015, 07:43:00, and the UNIX timestamp is 1425022980 seconds.
NTP mechanism
The basic NTP operating mechanism is shown in Figure 4.
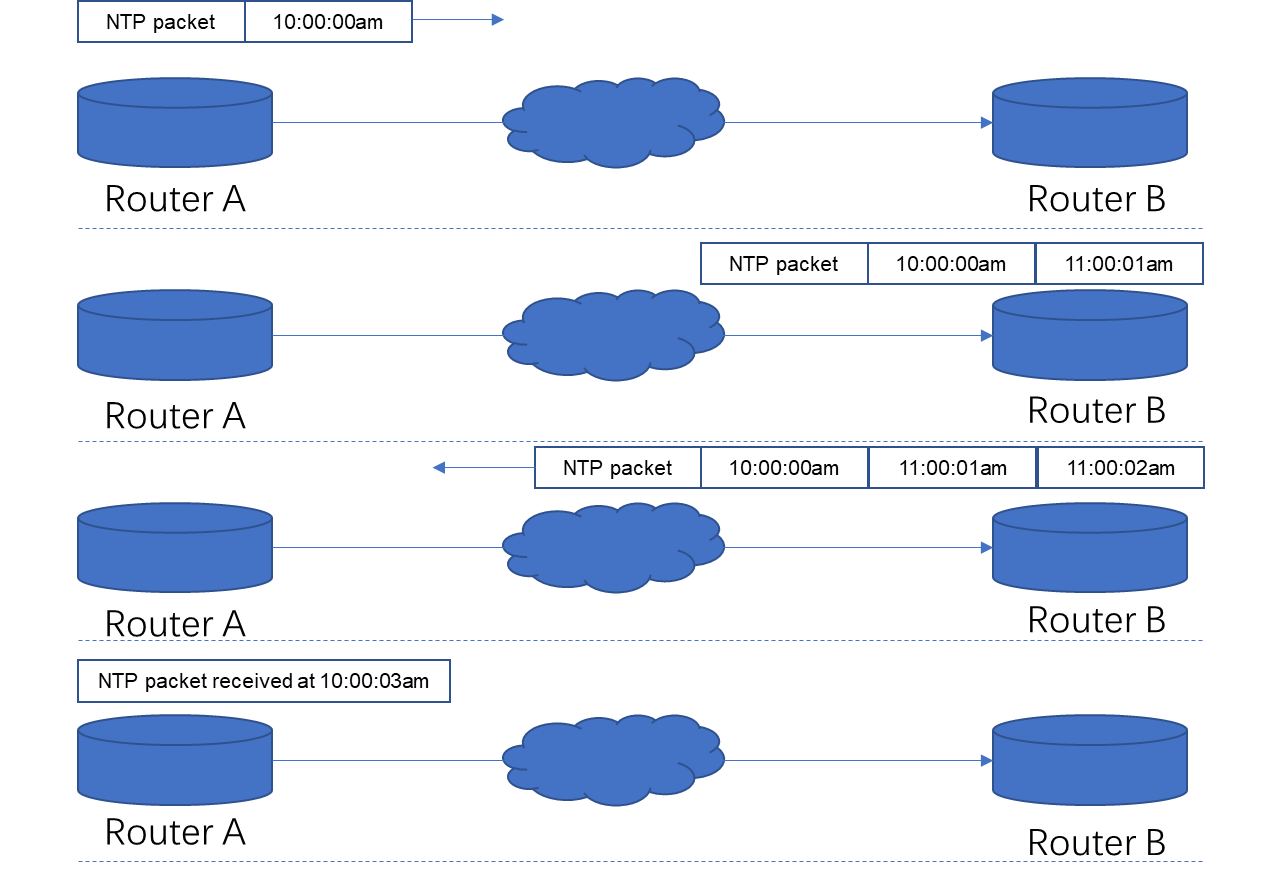
Router A and Router B are connected via the serial port. Both of them have their own independent system clock. To implement automatic synchronization of their system clocks, suppose:
· Prior to system clock synchronization between Router A and Router B, the clock of Router A is set to 10:00:00am and the clock of Router B is set to 11:00:00am.
· Router B acts as the NTP time server. That is, Router A will synchronize its clock with that of Router B.
· One-way transmission of data packets between Router A and Router B needs 1 second.
The process of system clock synchronization is as follows:
1. Router A transmits an NTP packet to Router B. The packet carries the timestamp when it leaves Router A, which is 10:00:00am (T1).
2. When the NTP packet reaches Router B, Router B adds its timestamp to it, which is 11: 00:01am (T2).
3. When the NTP packet leaves Router B, Router B adds its timestamp to it again, which is 11:00:02am (T3).
4. When Router A receives the response packet, it adds a new timestamp to it, which is 10:00:03am (T4).
NTP packet format
The format of an NTP packet is shown in Figure 30.
Figure 32 NTP packet format (1)
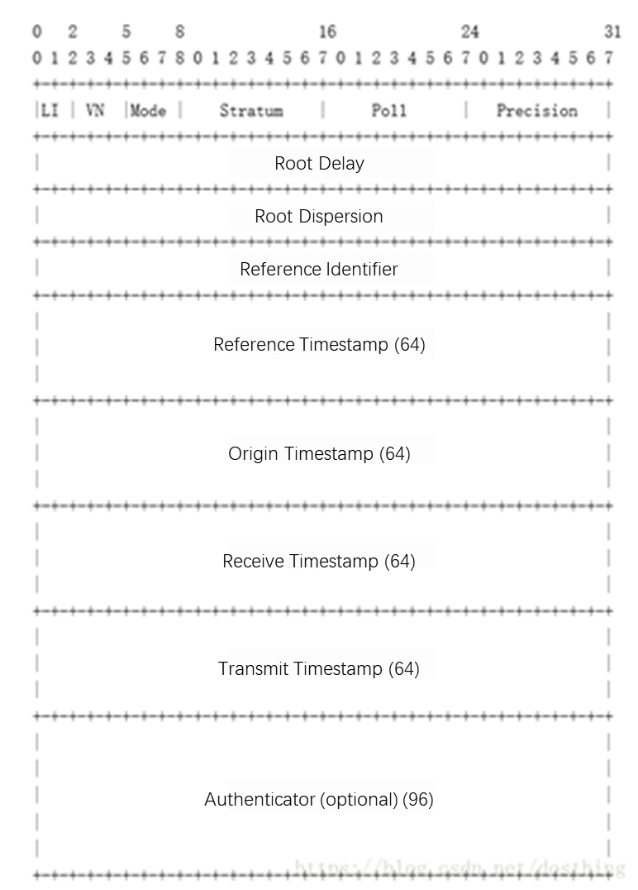
The relevant fields are as follows:
· LI—Leap indicator, 2 bits.
· VN—Version number, 3 bits, indicating the NTP version number, which is 3 in Figure 30.
· Mode—Mode, 3 bits.
· Stratum—Stratum, 8 bits.
· Poll—Maximum interval between successive packets, 8 bits.
· Precision—Precision of the local clock, 8 bits.
· Root Delay—Total round-trip delay to the reference clock, 8 bits.
· Root Dispersion—Total dispersion to the reference clock, 8 bits.
· Reference Identifier—Reference clock identifier used to identify a particular server or reference clock, 8 bits.
· Reference Timestamp—Time when the local clock was last corrected, 64 bits.
· Origin Timestamp—Time when the client sent the packet, 64 bits.
· Receive Timestamp—Time when the server received the packet, 64 bits.
· Transmit Timestamp—Time when the server sent the response, 64 bits.
· Authenticator—Provides cryptographic authentication for the packet, 96 bits. This field is optional.
Figure 33 NTP packet format (2)
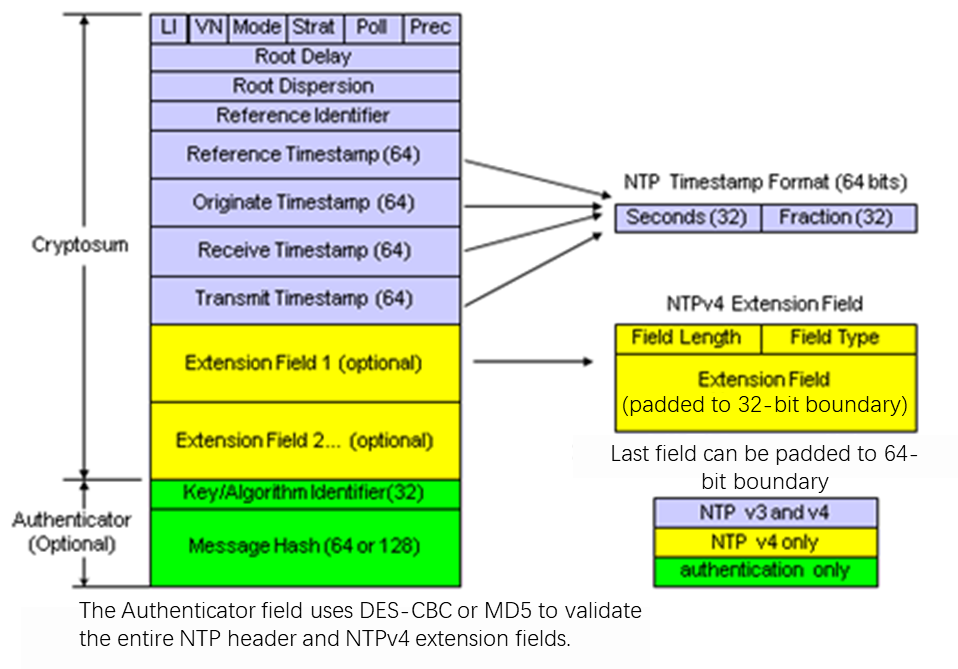
NTP is transmitted based on the UDP protocol, and it uses port 123 at the application level.
Figure 34 NTP request
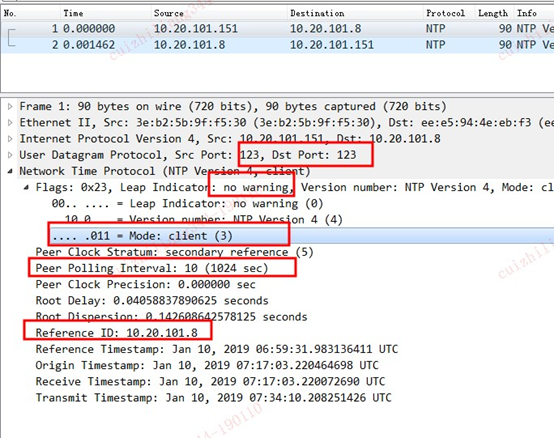
Figure 35 NTP response
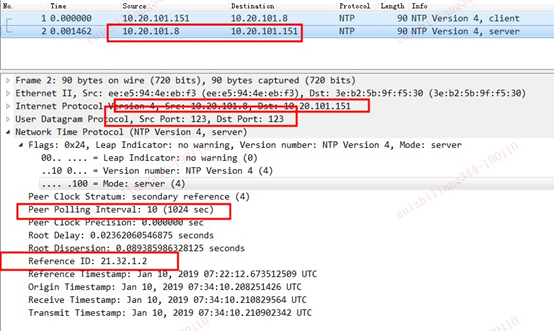
NTP network structure
The basic NTP network structure is shown in Figure 25.
Figure 36 NTP network structure
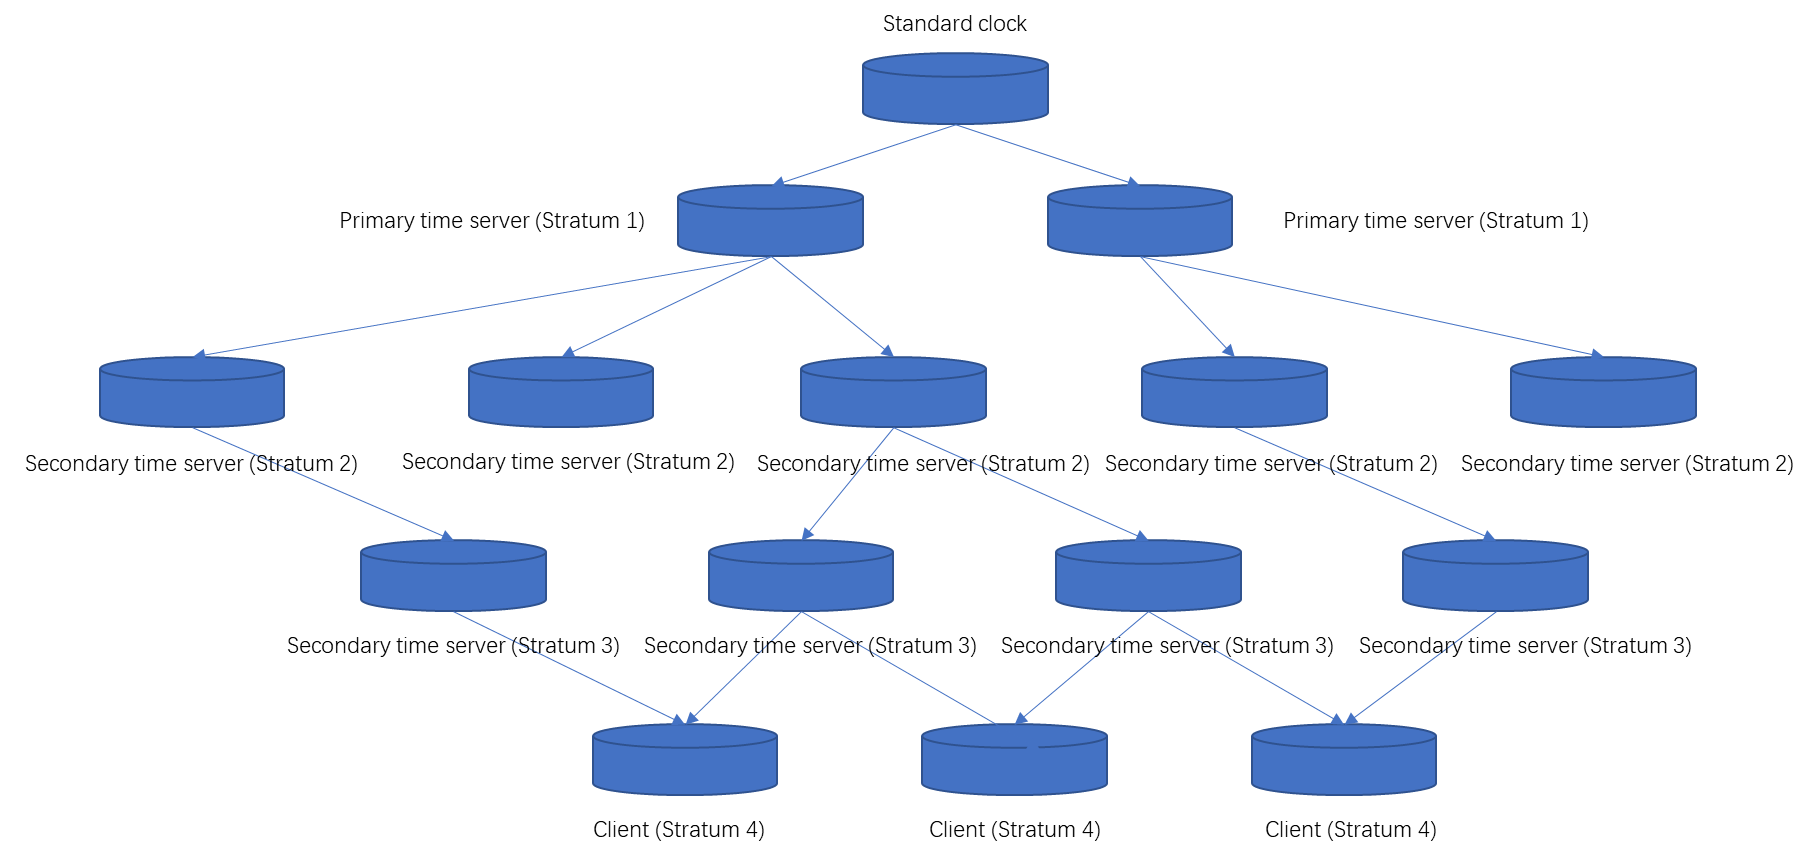
In the NTP model, multiple primary reference sources (such as backbone gateways) that are synchronized with the national standard clock through wired or wireless systems are connected to widely accessed resources in the network. These primary reference sources act as primary time servers in the network. NTP aims to deliver the timing information of these primary time servers to other time servers through the Internet and continuously check the clocks to reduce errors due to instrument or propagation errors. Some hosts or gateways in a local network running NTP act as secondary time servers in the network. The secondary time servers deliver time information to other hosts in the local network through NTP. To improve reliability, lower-accuracy but cheaper Radio Clocks can be installed on selected hosts as backups in case the primary reference servers and/or secondary time servers fail or the communication between the host and the time servers fails.
NTP implementation model
The basic NTP implementation model is shown in Figure 35.
Figure 37 NTP implementation model
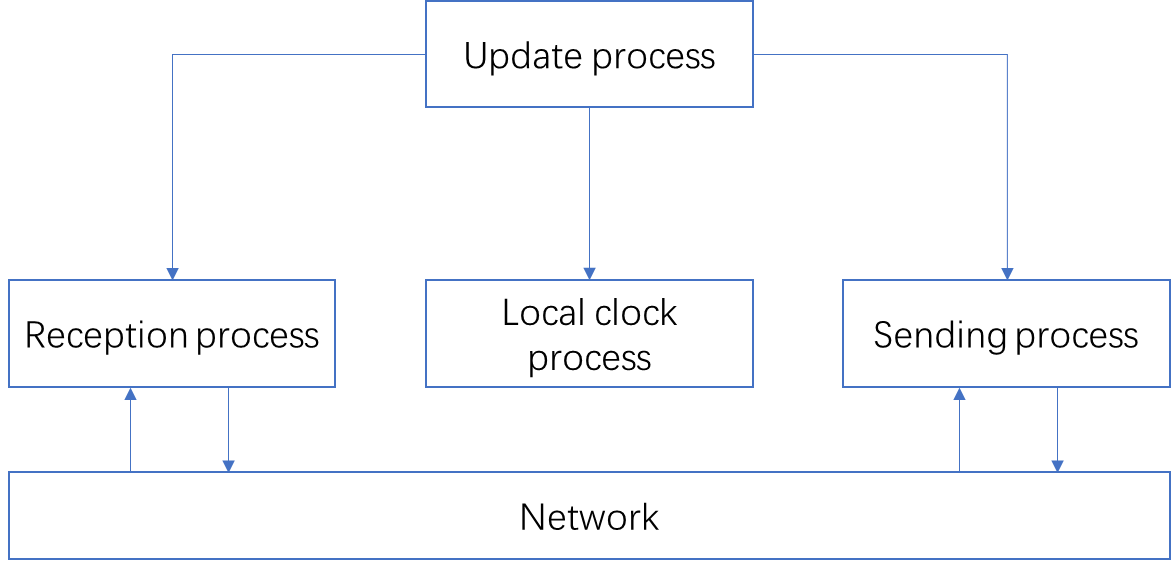
In the model, the sending, reception, and local clock processes run on a host, sharing the same data file divided into blocks. Each peer uses a specific block in the data file, and the three processes are interconnected through a packet transmission system.
Sending process
The sending process on each host is controlled by an independent timer. A host collects information from the data file and sends NTP packets to its peers. Each NTP packet contains the local timestamp when the packet is sent, the timestamp of the last received packet, and other information necessary for determining hierarchy and managing associations.
Reception process
The reception process receives NTP packets (possibly also packets of other protocols) and information from Radio Clocks directly connected to the host.
Update process
This process is triggered in scenarios such as when an NTP packet is received. It handles offset data from each peer and selects the best peer using a selection algorithm.
Local clock process
The local clock process uses a mechanism to adjust the phase and frequency of the local clock based on the offset data generated during the update process.
Software and software architecture for NTP
Software and configuration files
NTP-related software and configuration files are as follows:
· ntp—Main software for the NTP server, including configuration files and executable files.
· tzdata—Short for Time Zone data, providing various time zone display formats.
· /etc/ntp.conf—Main and only configuration file for the NTP server.
· /usr/share/zoneinfo/—Provided by tzdata, containing time format files for each time zone. For example, the time zone format file for Shanghai is /usr/share/zoneinfo/Asia/Shanghai.
· /etc/localtime—Local time configuration file, a copy of the corresponding time zone format file located at the /usr/share/zoneinfo/ directory. For example, by copying time zone format file /usr/share/zoneinfo/Asia/Shanghai, the Linux system generates file /etc/localtime.
Commonly used commands
You can use the following commands to configure NTP:
· /bin/date—Use this command to modify and display Linux system time (software clock).
· /sbin/hwclock—Use this command to modify and display the BIOS clock (hardware clock). This is a root-only command. Because the BIOS time and Linux system time are separate in the Linux system, after you use the /bin/date command to adjust the Linux system time, you must use the /sbin/hwclock command to write the modified system time to the BIOS.
· /usr/sbin/ntpd—Daemon for NTP service. The configuration file of the ntpd daemon is /etc/ntp.conf.
· /usr/sbin/ntpdate—Use this command to correct the time on an NTP client. To only use the NTP client feature without enabling NTP, you can use this command.
Main NTP configuration file ntp.conf
Using the restrict command for access control management
In the ntp.conf file, use the restrict command to manage access control.
Figure 38 restrict command syntax
![]()
Variable keywords for the parameter argument include:
· ignore—Denies all types of NTP connections.
· nomodify—Denies clients from using the ntpc and ntpq programs to modify the server's time parameters, but allows clients to perform network time synchronization through the host.
· noquery—Denies clients from using the commands for programs ntpq and ntpc to query the time server and does not provide NTP network time synchronization service.
· notrap—Does not provide traps for events such as remote event logging.
· notrust—Rejects unauthenticated clients.
Using the server command to specify upper-stratum NTP servers
Command syntax for specifying an upper-stratum NTP server:
Figure 39 server command syntax
![]()
You can specify an IP or host after the server keyword, and use the prefer keyword to specify the server as a preferred server.
Starting and observing NTP
After you configure the NTP server on the interface, the NTP service will be automatically started.
Typically, the following command line is added at the end of the /etc/ntp.conf file:
server 192.168.6.213 iburst minpoll 4 maxpoll 4 prefer
You can use the ntpq -p command to view time synchronization status:
Figure 40 Viewing time synchronization status
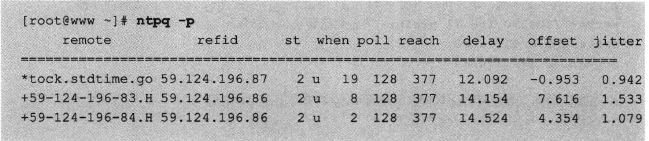
The following fields are displayed:
· remote—IP or hostname of the NTP server. The character on the left of the remote field value indicates the role of the NTP server.
¡ The asterisk (*) indicates the upper-stratum NTP server that the system is synchronizing its time with.
¡ The plus sign (+) indicates that the server is connected and can be the next candidate for time updates.
· refid—Address of the upper-stratum NTP server referred to by the current NTP server.
· st—Stratum.
· when—Number of seconds since the last time synchronization update.
· poll—Number of seconds until the next update.
· reach—Number of responses to time update requests from the upper-stratum NTP server.
· delay—Time delay during network transmission, in units of 10^(-6) seconds.
· offset—Time compensation result between the local system clock and the NTP server, in units of 10^(-3) seconds.
· jitter—Time difference between the Linux system time and the BIOS hardware time, in units of 10^(-6) seconds.
CAS NTP configuration scripts
ntp_set.sh script
The main function of the ntp_set.sh script is to add and delete NTP configurations. The script is called by the front-end interface.
You can execute the script on each host in the cluster to synchronize the time on each host with the NTP server.
In a CVM dual-host environment, before configuring NTP on the backup host, you must first obtain the IP address of the backup CVM host and execute the /opt/bin/ntp_set.sh script on the backup CVM host.
To delete the NTP configuration, delete the NTP server addresses in the /etc/ntp.conf file, delete the /opt/bin/ntp_mon.sh configuration in the /etc/crontab file, restart the crond service, and then execute the python /opt/bin/ntp_check.pyc stop command to shut down the NTP service.
To add an NTP configuration, add the primary and backup NTP server addresses in the /etc/ntp.conf file, start the NTP service, add the /opt/bin/ntp_mon.sh configuration to the /etc/crontab file, and then restart the crond service.
Figure 41 Configuration file

ntp_mon.sh script
This script is configured in the /etc/crontab configuration file of the crond service and is run periodically.
Figure 42 Configuration file
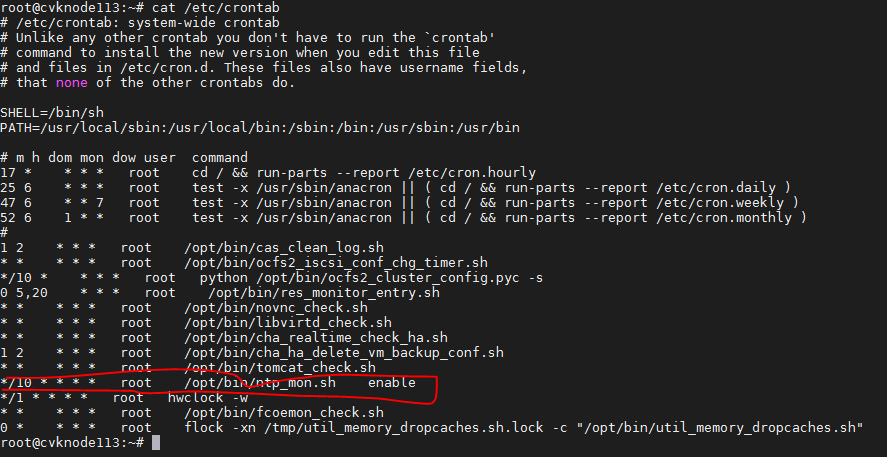
This script checks whether the /opt/bin/ntp_check.pyc process is running and starts the process if it is not running.
ntp_check.py script
This script periodically checks the time between the host and the NTP server. If the difference exceeds 1000 seconds, this script shuts down the host's NTP service, uses the ntpdate command to synchronize the time between the host and the NTP server, and then restarts the NTP service on the host.
ntp_getcvminfo.py script
This script is mainly used to obtain CVM information, including CVM dual-host hot backup status, by using commands such as crm_mon -1.
Managing USB
About USB
A Universal Serial Bus (USB) standard is a serial bus standard for connecting computer systems and external devices. It standardizes the connection and communication between computers and external devices. USB interfaces support plug-and-play and hot-swap functions.
USB controllers and USB devices are included in a USB system. A USB controller is located in the server chipset, indicating the supported USB standards. USB devices are plug-and-play devices.
Currently, mainly used USB devices are USB keys for software authorization and USB disks or flash drives.
USB bus standards
USB 1.0
The maximum transfer rate stipulated in this standard is 1.5 Mbps. USB interfaces and devices using this standard are not commonly seen. You do not need to pay attention.
USB 1.1
USB 1.1, also known as Full-Speed USB 2.0, stipulates a maximum transfer rate of 12 Mbps. Devices and interfaces using this standard are also rare. Some older servers may have USB 1.1 interfaces, such as HP Gen6. Newer servers do not have USB 1.1 physical interfaces.
USB keys mostly use the USB 1.1 standard, and their compatibilities are generally not very good.
USB 2.0
High-Speed USB 2.0 stipulates a maximum transfer rate of 480 Mbps. It is a USB standard that most servers support. USB flash drives and disks mostly support the USB 2.0 standard.
USB 3.0
USB 3.0, also known as Super-Speed USB, stipulates a maximum transfer rate of 5 Gbps. Few servers support USB 3.0. You do not need to pay attention currently.
Managing USB on CAS
How to check the supported USB bus standards on the server (CVK system)
You can execute the lspci -vvv | grep USB command to obtain USB information.
root@cvknode18:~# lspci -vvv | grep USB
00:1a.0 USB controller: Intel Corporation C600/X79 series chipset USB2 Enhanced Host Controller #2 (rev 05) (prog-if 20 [EHCI])
00:1d.0 USB controller: Intel Corporation C600/X79 series chipset USB2 Enhanced Host Controller #1 (rev 05) (prog-if 20 [EHCI])
01:00.4 USB controller: Hewlett-Packard Company Integrated Lights-Out Standard Virtual USB Controller (rev 02) (prog-if 00 [UHCI])
The output on a mainstream HP server shows that the system supports USB 2.0 and USB 1.1 (represented by the EHCI and UHCI fields, respectively ).
However, the USB 1.1 (UHCI) controller is virtual and is not backed by an actual physical chip. Therefore, the system actually supports only USB 2.0.
How to query USB devices plugged in the server (CVK system)
You can use the lsusb command to query the USB devices plugged in the CVK system.
root@cvknode18:~# lsusb
Bus 002 Device 003: ID 0424:2660 Standard Microsystems Corp.
Bus 002 Device 002: ID 8087:0024 Intel Corp. Integrated Rate Matching Hub
Bus 002 Device 001: ID 1d6b:0002 Linux Foundation 2.0 root hub
Bus 003 Device 001: ID 1d6b:0001 Linux Foundation 1.1 root hub
Bus 001 Device 002: ID 8087:0024 Intel Corp. Integrated Rate Matching Hub
Bus 001 Device 001: ID 1d6b:0002 Linux Foundation 2.0 root hub
The output shows that no actual USB devices are plugged in and only some virtual devices that come with the system exist.
HP servers generally have a virtual USB 1.1 controller related to iLO. If, after executing the lsusb command, you only see a USB 1.1 root hub (as highlighted in the red text), it indicates that the server supports only USB 2.0.
You can use the lsusb -t command to display the tree structure of USB devices and their mounting situation. In this way, you can identify the USB buses connected to devices.
root@cvknode18:~# lsusb -t
/: Bus 03.Port 1: Dev 1, Class=root_hub, Driver=uhci_hcd/2p, 12M
/: Bus 02.Port 1: Dev 1, Class=root_hub, Driver=ehci-pci/2p, 480M
|__ Port 1: Dev 2, If 0, Class=hub, Driver=hub/8p, 480M
|__ Port 3: Dev 3, If 0, Class=hub, Driver=hub/2p, 480M
/: Bus 01.Port 1: Dev 1, Class=root_hub, Driver=ehci-pci/2p, 480M
|__ Port 1: Dev 2, If 0, Class=hub, Driver=hub/6p, 480M
The output shows that three types of USB buses exist in the system: two USB 2.0 and one USB 1.1. By executing the lspci -vvv | grep USB command, you can know that USB 1.1 is virtual and cannot be actually used. Therefore, if any USB devices (including USB 1.1 devices) exist, they must be mounted under the physical bus of USB 2.0.
USB adding interface on CAS
The latest version of CAS supports adding devices using three types of USB controllers. Because servers generally do not support USB 3.0, you do not need to pay attention currently.
When a new USB device is plugged in, the VM can directly access the USB device. To add a USB device using a specific USB standard on CAS, select the corresponding USB controller. If failures occur when adding a device with a type of USB controller, you can try another one.
The USB 1.0 controller on the CAS interface actually refers to the USB 1.1 standard, rather than the obsolete USB 1.0 standard.
Alarm module
Alarming is a fundamental and crucial requirement for managing virtualized data centers. The alarm scope includes major alarm summary and alarms on cluster resource usage, host resource usage, VM resource usage, network and storage connectivity, security, and environment anomalies. The statistics on all types of anomalies and their potential causes and alarm clearance actions are expected to be clearly displayed on the virtualization management platform. This will help system administrators to promptly identify alarm generation and analyze the distribution and reasons for anomalies. Ultimately, this provides factual information for building a healthy and stable virtualized environment.
CAS allows you to configure alarm attributes on CVM to generate alarms on part of the settings. It also provides alarm notifications via email, SMS, and other methods.
The trigger of the alarm function depends on specific situations, typically triggered by backend detection commands. The location and analysis of problems require confirmation through log analysis combined with the actual situation at the front end and back end.
Introduction to CAS log collection
Log analysis is critical for CAS. If issues occur, specific functional modules are analyzed based on symptoms. The reasons for issues might be identified through the logs of relevant modules.
Any developer or maintenance personnel needs to be familiar with CAS log analysis, and understand the basic processing flow of modules and common mistakes to analyze and infer the location of issues.
Log collection methods
Collecting logs from the Web interface
CAS logs can be collected from the Web interface. You can select CVK on the Web interface to collect logs, and then download them. To share the logs with others, you can upload them to ipan.h3c.com. Sharing logs on ipan with specific site names will facilitate R&D personnel in locating and analyzing logs.
Collecting logs from the CLI
You can use the cas_collect_log.sh script to collect CVK logs from the CLI.
root@cvknode213:~# cas_collect_log.sh -h
SHELL NAME: cas_collect_log.sh
USAGE : cas_collect_log.sh $time $size
PARAMETER :
time : collect log last time days
size : size of logs(KB)
Execute the following command to collect logs:
cas_collect_log.sh 7 100000
The CVK logs are saved to the /vms directory in log file cvknode213.diag.tar.bz2.
To view log collection file information, execute root@cvknode213:~# ls -al /vms/*tar.bz2:
-rw-r----- 1 root root 3285203 Mar 9 04:43 /vms/cvknode213.diag.tar.bz2
Log analysis
After CAS log collection, a log file name is typically the combination of versions and dates, such as CAS_E0705_202003090450.tar.gz. When decompressed, the log file is displayed in a tree structure, with the top directory containing front end-related operation logs like tomcat, casserver, and operations.
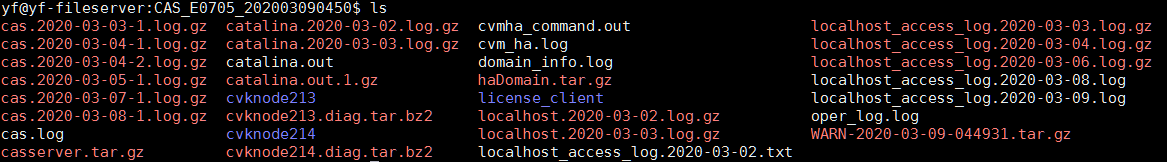
A CVK log collection file is shown as follows:
yf@yf-fileserver:CAS_E0705_202003090450$ tree cvknode213 -L 2
cvknode213
├── cas_cvk-version Version number
├── command.out Information collection of CVK status, hardware and commands
├── etc Collection of the configuration files for each module
│ ├── cmsd
│ ├── cvk
│ ├── cvm
│ ├── default
│ ├── drbd.d
│ ├── iscsi
│ ├── libvirt
│ ├── multipath.conf
│ ├── network
│ ├── ocfs2
│ ├── openvswitch
│ └── udev
├── loglist
├── run
│ ├── device_config_cache.xml
│ └── openvswitch
└── var var information collection
├── lib
└── log Log directory collection
The log lists and directories for CVK and CVM belong to different CAS modules. For example, the libvirt directory contains logs for libvirt and kvm/qemu, and the cas_ha directory contains HA-related logs.
yf@yf-fileserver:CAS_E0705_202003090450$ tree cvknode213/var/log -L 1
cvknode213/var/log
├── boot.log
├── br_shell_202003.log
├── cas_ha
├── caslog
├── cas_util_shell_202003.log
├── cmsd
├── cron.log
├── cron.log.1
├── cvknode213_ocfs2_kernel_state_202003090448.log
├── cvm_master_slave.log
├── fc_san_shell_202003.log
├── fsm
├── installer
├── kern.log
├── kern.log.1
├── libvirt
├── license_client
├── lldp
├── log_shell_202003.log
├── mcelog
├── mysql
├── noVNC
├── ocfs2_fence_shell_202003.log
├── ocfs2_shell_202003.log
├── openvswitch
├── operation
├── res_monitor
├── sa_shell_202003.log
├── syslog
├── syslog.1
├── syslog.2
├── syslog.3
├── syslog.4
├── syslog.5
├── syslog.6
└── syslog.install
After receiving on-site logs, you can analyze module-specific log information based on symptoms. For example, for shared file system errors, you need to analyze log modules including syslog/message, ocfs2_shell*.log, fsm, and other log modules to identify possible causes. For HA logs, you need to analyze the log information in the cas_ha directory. Libvirt and qemu logs are saved in the /var/log/libvirt directory. For analysis on logs of a specific module, refer to the corresponding logs for the module.
To deal with extreme anomalies such as a sudden CVK restart, analyze all log information to identify the potential issues and those that have occurred as needed.
Scripts for CAS in /opt/bin
About functions and scripts
The scripts and commands in the /opt/bin directory are the locations of the commands and scripts at the CLI of CAS. Different modules are identified by different prefixes, indicating different functions, as follows:
· ocfs2_*: Scripts for configuring shared file systems on hosts, including ocfs2 information and configuration.
· br_*: Scripts for VM backup and restoration.
· cha_*: Scripts for HA configuration and management.
· cas_*: CAS configuration scripts at the CLI.
· fc_san_*: Scripts for FC management and configuration.
· host_*: Scripts for server configuration and hardware settings.
· ms_*: Stateful failover scripts.
· ovs_*: Scripts related to virtual switches and network configuration.
· sa_*: Configuration scripts related to storage adapters.
· util_*: A collection of common scripts used by common functions across all modules.
This document does not describe every script. You only need to focus on commonly used scripts for issue location. To locate issues, pay attention to the corresponding log analysis.
You can add -h to a script to obtain basic functions and usage guidelines for the script. For example:
root@cvknode213:~# sa_scan.sh -h
NAME
/opt/bin/sa_scan.sh.x - Scan the storage adapter
SYNOPSIS
/opt/bin/sa_scan.sh.x [-h] [0|1] [iscsi|fc|FCoE] [wwn]
DESCRIPTION
-h: Help
[0|1]: 0 Normal refresh, 1 Force refresh
[iscsi|fc]: the type to be refreshed
[wwn]: the wwn to be refreshed
A Python script can use the following command format:
root@cvknode213:/opt/bin# python /opt/bin/ocfs2_iscsi_list_lun.pyc -h
usage: ocfs2_iscsi_list_lun.pyc [-h] [-t TARGET [TARGET ...]] ip
List luns in xml format.
positional arguments:
ip ip address
optional arguments:
-h, --help show this help message and exit
-t TARGET [TARGET ...], --target TARGET [TARGET ...]
target name list, if not specialed, output all luns
under ip_address
The usage and query of other scripts are similar. Most scripts are provided with the -h option and the corresponding usage guidelines.
Typical scripts for issue location and analysis
You only need to remember a few typical commands for troubleshooting and analysis.
· fc_san_info_collector.sh: FC information collection script. After you execute this command, a compressed file named /var/log/fc_san_info.tar.gz will be created, which includes FC information collection.
· ocfs2_kernel_stat_collect.sh: Collects the list of processes in D state and their stack information, OCFS2 node configuration, and blocking lock information for OCFS2 DLM, and so on. When OCFS2 encounters blocking issues, you can use this script to output OCFS2 information to be located to a file named /var/log/hostname_ocfs2_kernel_state_date.log. For example:
/var/log/cvknode213_ocfs2_kernel_state_202003161519.log
· sa_info.sh: Collects and outputs basic information about storage adapters, including the model and HBA firmware version.
· cas_collect_log.sh: Collects logs from the CVK CLI manually. The generated log files are saved to compressed files in the /vms directory.
· host_hw_info.sh: Collects server hardware information, including memory, CPUs, and BIOS. To view detailed information, use the -h option.
Configuration cautions and guidelines
As a best practice, do no use scripts and commands for CAS maintenance. If necessary, you must have knowledge of the functions and parameters of the scripts. The risk of executing commands and scripts from the CLI is borne by operators.
If you do not have sufficient knowledge and risk assessment, do not use commands or scripts from the CLI as a best practice.
CAS configuration cautions and guidelines
Guidelines
This section describes operation risks and precautions for each module, such as deleting files and disabling physical NICs.
Perform operations from the Web interface instead of the CLI.
Do not edit or configure the settings without sufficient risk assessments or understanding of operating principles when services are running.
If the risk of operations from the Web interface cannot be determined, contact Technical Support.
CAS management
Configuring the NTP Server
Introduction: Perform this task to configure NTP server settings.
Cautions: You must identify the difference between the system time on the NTP server and the current server time. You cannot synchronize time backwards.
Restarting hosts
Introduction: Perform this task to reboot a host only when the host is in maintenance mode.
Cautions: An abnormal host restart might result in host startup failure and require repairs to the configuration files or file system.
Virtual switches
Suspending a virtual switch
Introduction: Perform this task to suspend the running of virtual switches.
Cautions: A virtual switch cannot provide services when it is suspended. To avoid service interruption, make sure the virtual switch is not in use before you suspend a virtual switch.
Editing a virtual switch
Introduction: Perform this task to edit virtual switch settings, including the virtual switch name, forwarding mode, VLAN ID, physical interface, and IP address.
Cautions: Editing the settings of virtual switches might cause network connectivity issues. Make sure you fully understand the impact of the edit operation.
Deleting a virtual switch
Introduction: Perform this task to delete a virtual switch.
Cautions: Deleting a virtual switch might cause system anomalies. Make sure you fully understand the impact of the delete operation.
Editing a port profile
Introduction: Perform this task to edit a port profile.
Cautions: Editing port profiles might cause network connectivity issues and service interruption of virtual switches. Make sure you fully understand the impact of the edit operation. If CAS is managed by other cloud platforms, do not port profiles of other cloud platforms on CAS.
Storage
Suspending a storage pool
Introduction: Perform this task to suspend a storage pool in active state. You cannot suspend a storage pool that has files in use or a storage pool that is being used by suspended virtual switches.
Cautions: If a storage pool is suspended, files within the storage pool cannot be used. VMs using the suspended storage pool cannot be started.
Deleting a storage volume
Introduction: Perform this task to delete a storage volume in a storage pool.
Cautions: Before deleting a storage volume, make sure the storage volume is not in use. Perform the backup or confirmation as needed.
Shared file system
Editing a shared file system
Introduction: Perform this task to edit the settings of a shared file system.
Cautions: After the system comes online, you must edit a shared file system with caution. Adding and deleting LUNs might cause anomalies in a shared file system and even result in data loss.
Formatting a shared file system
Introduction: Perform this task to formatting partitions.
Cautions: Formatting partitions will clear all files in a shared file system. Perform this task only when you fully understand the usage of the shared file system.
Deleting a shared file system
Introduction: Perform this task to delete a shared file system.
Cautions: Deleting a shared file system causes data loss. Perform this task only when you fully understand the usage of the shared file system.
Basic life cycle management for VMs
Bulk starting VMs
Introduction: Perform this task to bulk start VMs in shutdown state for the VMs to operate correctly.
Cautions: This operation might cause a startup storm. Do not bulk start VMs when services are busy.
Suspend a VM
Introduction: Perform this task to suspend a running VM. The data in the memory of a VM is retained after the VM is suspended and the VM stops running.
Cautions: Suspending a VM might cause VM service interruption.
Hibernating a VM
Introduction: Perform this task to hibernate a VM in running or suspended state . When you hibernate a VM, the system saves the data in the memory into the hard disk as files, and then powers off the VM to hibernate it.
Cautions: Hibernating a VM might cause VM service interruption.
Restarting a VM
Introduction: Perform this task to restart a running or suspended VM. You might also need to restart a VM when the VM fails or its configuration changes, for example, because of an increase or decrease in CPU, memory, or disk capacity.
Cautions: Restarting a VM might cause VM service interruption.
Bulk restarting VMs
Introduction: Perform this task to restart VMs in shutdown state for the VMs to operate correctly.
Cautions: This operation might cause a startup storm. Do not bulk restart VMs when services are busy.
Powering off a VM
Introduction: Perform this task to forcedly power off a VM.
Cautions: Powering off a VM might cause data loss from the VM OS and applications. To avoid data loss, do not power off a VM directly. As a best practice, shut down a VM by shutting down relevant applications on the VM. Powering off a VM with caution.
Deleting a VM
Introduction: Perform this task to delete a VM.
Cautions: The delete operation will be forcibly executed, regardless of whether a VM is in running state. To avoid data loss, be cautious when you delete a VM.
VM migration
Migrating a VM online
Introduction: Perform this task to migrate a running or suspended VM to another host.
Cautions: Online VM migration might the memory and CPU performance of hosts and might cause service interruption..
Migrating storage
Introduction: Perform this task to migrate the image files of a VM from one storage pool to another.
Cautions: Storage migration might affect the memory performance, CPU performance, and disk I/O of hosts.
Bulk migrating VMs online
Introduction: Perform this task to bulk migrate the specified VMs other hosts.
Cautions: Do not bulk migrating VMs online when services are busy. Make sure you fully understand the impact of the migrate operation for daily maintenance.
Bulk migrating storage
Introduction: Perform this task to bulk migrate the image files of the specified VMs to other storage pools.
Cautions: Bulk storage migration will severely affect the memory performance, CPU performance, network bandwidth, and disk I/O Maintenance of hosts. Do not bulk migrating storage when services are busy. Make sure you fully understand the impact of the migrate operation for daily maintenance.
VM templates
Converting to template
Introduction: Perform this task to convert a VM to a VM template.
Cautions: After you convert a VM to a template, the original VM will be deleted.
VM snapshots
Restoring VM snapshots
Introduction: Perform this task to restore a VM to a snapshot.
Cautions: Restoring a VM to a snapshot will result in data loss after the creation time of the snapshot.
VM backup
Backing up a VM
Introduction: Perform this task to back up a VM to the local directory of the host or a remote server.
Cautions: VM backup will occupy system resources of the CVK host. Therefore, do not perform VM backup when services are busy. As a best practice, back up a VM when services are not busy.
For more information, see the configuration cautions for cloud computing products v1.0.
Maintenance and changes
CAS installation and deployment
For more information, see H3C CAS Installation Guide.
CVM re-installation
CVM hosts require re-installed in case of anomalies. The anomalies might include the following:
· A CVM host is powered off. This causes file system damage and the repair attempts have failed.
· A CVM host infected with Trojan or viruses and cannot start up or completely remove viruses.
· Some CVM configuration become unavailable because of operation mistakes from administrators.
You can configure backup policies for CVM on the Web interface. If no backup policy is configured, CVM backup configurations will be backed up in the /vms directory of two CVK hosts managed by the system.
After CVM damage, you can access the CLI of all CVK hosts through SSH and search the /vms/.cvmbackup directory for find the latest backup.
If CVM backup is configured, you can upload and import the backup to CVM, and restore CVM.
CVK re-installation
CVK hosts require re-installation in case of anomalies. The anomalies might include the following:
· A CVK host is powered off. This causes file system damage and the repair attempts have failed.
· A CVK host is infected with Trojan or viruses and cannot start up or completely remove viruses.
· Some CVK configurations become unavailable due to operations mistakes or others.
· A hardware fault occurs on CVK, causing an anomaly during operation. After CVK restarts, the system fails to start up.
If a hardware fault occurs on a CVK host, isolate the CVK host by disconnecting its connected storage links. Then, repair the CVK host.
When a CVK host fails, the HA feature will migrate VMs on the CVK host to another one.
CVK needs to be installed in the current version of CVM. If a patch is required, install the patch for the corresponding CVK host separately.
After a CVK host is re-installed, re-add the CVK host for management to CVM.
CAS expansion
Adding hosts
To expand hosts to CAS, install the same CAS system version on a server, and then add the server on CVM.
Expanding storage
Expanding shared storage
CAS does not support direct storage expansion on CVM. To expand shared storage:
1. Allocate a LUN to be mounted on the storage side.
2. Add the LUN to CAS through shared storage, and mount it to the corresponding host.
3. Migrate VM files to the mounted LUN through VM storage migration.
4. After the migration is completed, destroy the unused LUN.
Expanding the local storage on a host
If the local storage resides on the system disk, that is, the disk to be expanded has been installed with CAS, expand the local storage through re-installation as follows:
1. Migrate the VMs on the host to another host.
2. Expand the disk on the host.
3. Re-install the CAS system.
4. Add the host back to CAS.
5. Migrate the VMs back to their original host.
If the local storage resides on a data disk without a CAS system, expand the local storage as follows:
6. Migrate the VMs running on the local storage to another storage pool through migration.
7. Expand the data disk.
8. Migrate the storage files of the VMs back to the original storage.
Expanding memory
When a host's memory is insufficient, follow these steps to expand the memory:
1. Migrate the VMs running on the host to another host through VM migration.
2. Suspend the shared storage on the host, and delete the shared storage to place the host in maintenance mode.
3. Remove the host from the cluster.
4. Expand the memory on the host.
5. Add the host back to CAS.
6. Add the corresponding shared storage and migrate the VMs back to the host.
CAS upgrade
After some design-driven or kernel-related version upgrades on H3C CAS, hosts needs to be restarted.
Some versions are hot patches and do not require host restart after the upgrade.
CAS upgrade supports both offline and online upgrades. For more information, see H3C CAS release notes.
Replacing hardware components
Before replacing hardware components for a host, place the host into maintenance mode and then power it off. To replace a CPU, system board, or NIC for a CVM host, you need to unbind and re-register the license.
Hardware replacement for a CVK host
Before replacing hardware for a CVK host, migrate the virtual machines to another CVK host that is operating correctly and then place the original host into maintenance mode.
After hardware replacement is complete, exit the maintenance mode for the host, and migrate the original virtual machines back to the host.
Figure 43 Hardware replacement procedure
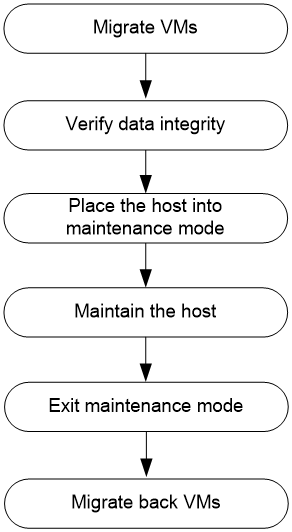
Replacing a CPU, memory, or disk
1. Before replacing a CPU, memory, or disk for a host, place the host into maintenance mode. Migrate the virtual machines on the host to a server that is operating correctly, stop the shared file system on the host, and then shut down the host.
¡ CVK host: Log in to CVM and place the target host into maintenance mode.
¡ CVM host: In a stateful failover system, switch the primary CVM whose hardware is to be replaced to a standby CVM. If CVK shares the same host as CVM, place CVK into maintenance mode.
Figure 44 Placing the target host into maintenance mode

|
|
CAUTION: · Make sure the server hardware time is synchronized with the system time before performing hardware maintenance on the host. If they are not synchronized, CAS might be abnormal. · For the server hardware time synchronization method, contact the server hardware service provider. |
2. Replace the CPU. As a best practice, make sure the replacement CPU is the same model as the original CPU. No operations are required in the CLI of the CAS operating system.
3. Replace the memory. No operations are required in the CLI of the CAS operating system.
4. If a local disk on the CVM or CVK host is faulty, use the following method:
¡ Check whether the system disks are configured in RAID1. If a disk in the RAID1 setup is faulty, see the hardware guide for the server to replace the disk.
¡ If no redundancy is configured for the system disks, replace the faulty disks and reinstall CVM or CVK.
5. After maintenance is completed, exit the maintenance mode for CVK in the CVM Web interface.
Replacing NICs
1. Check the environment and prepare for the replacement.
¡ Ensure that the network environment is correct.
¡ If the NIC is operating properly, use ping to check network connectivity. Record the connections between network cables, fiber optic cables, and NIC interfaces.
¡ Check if the host system and hardware time is correct and record them.
¡ Check if the NTP server service is functioning properly.
2. Back up the NIC configuration file.
¡ Ubuntu system
Back up NIC configuration file, for example, 70-persistent-net.rules.
root@cvk01:~# cd /etc/udev/rules.d/
root@cvk01:/etc/udev/rules.d# cp 70-persistent-net.rules 70-persistent-net.rules.bak
root@cvk01:/etc/udev/rules.d# ll
total 32
drwxr-xr-x 2 root root 4096 May 9 15:17 ./
drwxr-xr-x 3 root root 4096 Apr 30 17:34 ../
-rw-r--r-- 1 root root 541 Apr 30 17:37 70-custom-net.rules
-rw-r--r-- 1 root root 536 Apr 30 17:33 70-persistent-cd.rules
-rw-r--r-- 1 root root 683 May 9 01:46 70-persistent-net.rules
-rw-r--r-- 1 root root 683 May 9 15:35 70-persistent-net.rules.bak
-rw-r--r-- 1 root root 496 Oct 24 2018 71-persistent-fcoe.rules
-rw-r--r-- 1 root root 1157 Apr 6 2012 README
¡ CentOS system
Back up the NIC configuration file, for example, /etc/sysconfig/network-scripts/ifcfg-ethx (x, in the range of 0 to N, represents the eth number of the NIC).
If only some of the NICs are to be replaced, identify the eth number of NICs to be replaced. If the system board or all NICs are to be replaced, back up all configuration files.
The following is an example of backing up the configuration file for one NIC.
[root@cvknode ~]# cd /etc/sysconfig/network-scripts/
[root@cvknode network-scripts]# cp ifcfg-eth0 ifcfg-eth0.bak
3. Place the host into maintenance mode.
4. Migrate the virtual machines of the host to a server that is operating correctly, and stop and delete the shared file system of the host.
¡ CVK host: Log in to CVM and place the target host into maintenance mode.
¡ CVM host: In a stateful failover system, switch the primary CVM whose NIC is to be replaced to a standby CVM. If CVK shares the same host as CVM, place CVK into maintenance mode. If CVK does not share the same host as CVM, go to the next step.
Figure 45 Placing the target host into maintenance mode
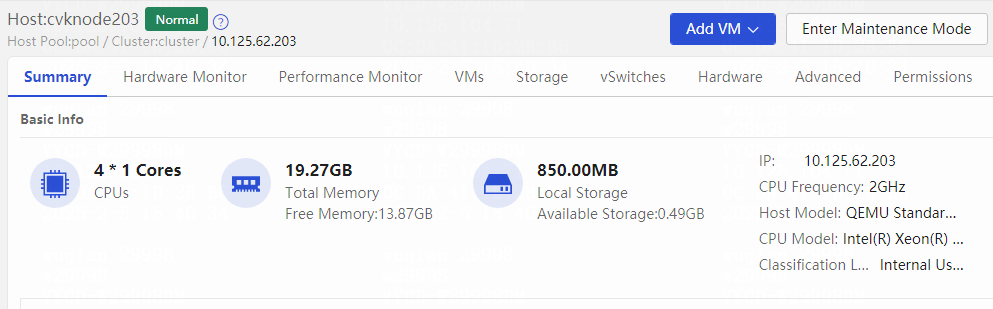
5. Shut down the host and replace the NICs. Then restore the physical links based on the recorded connection relations between the network cables, optical fibers, and NIC interfaces.
In this example, NIC1 to NIC4 on a VM are replaced, resulting in MAC address changes of NICs.
|
|
CAUTION: · Make sure the server hardware time is synchronized with the system time before performing hardware maintenance on the host. If they are not synchronized, CAS might be abnormal. · For the server hardware time synchronization method, contact the server hardware service provider. |
6. Restore the NIC number. After the (onboard) NIC, system board, or NIC MAC address is changed, the NIC configuration file will be updated. As a result, the network might be disconnected. In this case, you must modify the NIC configuration file manually to restore the network.
Figure 46 CAS XConsole prompting to check the uplink on vSwitch0 after NIC replacement
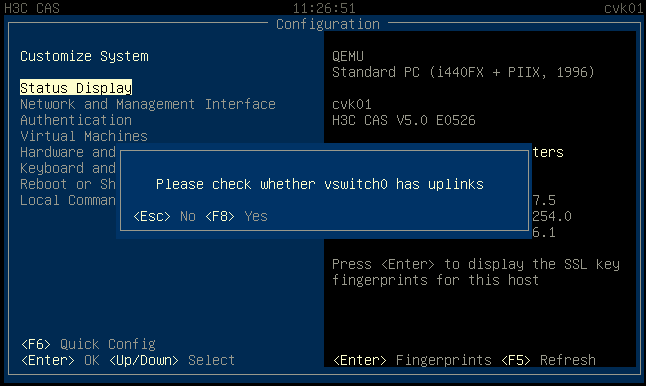
¡ After NIC is replaced, Ubuntu will automatically update the NIC configuration file (70-persistent-net.rules), with the eth number of the new NIC following the original one. To restore the network, update the eth number in the NIC configuration file (70-persistent-net.rules) to a new MAC address.
¡ After NIC is replaced, the CentOS system will add a new NIC configuration file (ifcfg-ethx) to the etc/sysconfig/network-scripts/ directory, with eth number following the original one. To restore the network in the CentOS system, update the MAC address in the original configuration file (ifcfg-ethx) to a new MAC address.
To obtain the MAC address after network interface change, perform the following steps. This example assumes that the physical link status is up after system board and NIC replacement. (Disconnect the host NIC and perform operations below without impacting services)
a. Open the XConsole, access the local command shell, execute the ip a | grep DOWN command, and record the result.
![]()
b. After the system board and physical NIC are replaced, switch the physical link status of the original Ethernet port eth0 from up to down (by unplugging the network cable or shutting down the Ethernet port). Execute the ip a | grep DOWN command and record the result.
![]()
c. Compare the results. You can find that after the MAC address of eth0 is changed, the system takes eth0 as a new NIC and renumber it as eth4. Record the old and new eth number mapping relation to Table 3.
d. Repeat steps a to c to obtain and record all mapping relations between the old and new eth numbers. Execute the /opt/bin/ovs_dbg_listports command to view the MAC addresses of eth4 to eth7 (as shown in _Ref104210516). Record the MAC addresses of new eth numbers to Table 3 (add colons to the MAC addresses yourself).
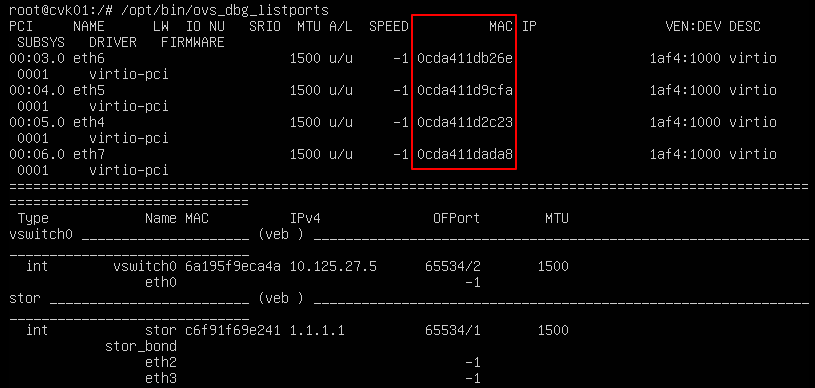
Table 3 Mapping between new and original eth numbers
|
|
Original eth number |
New eth number |
New MAC address |
|
NIC 1 |
eth0 |
eth4 |
0c:da:41:1d:2c:23 |
|
NIC 2 |
eth1 |
eth5 |
0c:da:41:1d:9c:fa |
|
NIC 3 |
eth2 |
eth6 |
0c:da:41:1d:b2:6e |
|
NIC 4 |
eth3 |
eth7 |
0c:da:41:1d:ad:a8 |
7. Modify the NIC configuration file.
¡ For a Ubuntu system: Modify the ATTR{address} in the original eth number entry in the 70-persistent-net.rules file to a new MAC address.
In the configuration example, NIC 1 is updated to eth0, NIC 2 is updated to eth1, NIC 3 is updated to eth2, and NIC 4 is updated to eth3 after replacement.
After backing up the new file 70-persistent-net.rules, execute the vim 70-persistent-net.rules command to modify the 70-persistent-net.rules file:
root@cvk01:~# cd /etc/udev/rules.d/
root@cvk01:/etc/udev/rules.d# cp 70-persistent-net.rules 70-persistent-net.rules.bak.nwe
root@cvk01:/etc/udev/rules.d# vim 70-persistent-net.rules
Figure 47 Updating MAC addresses of new eth numbers
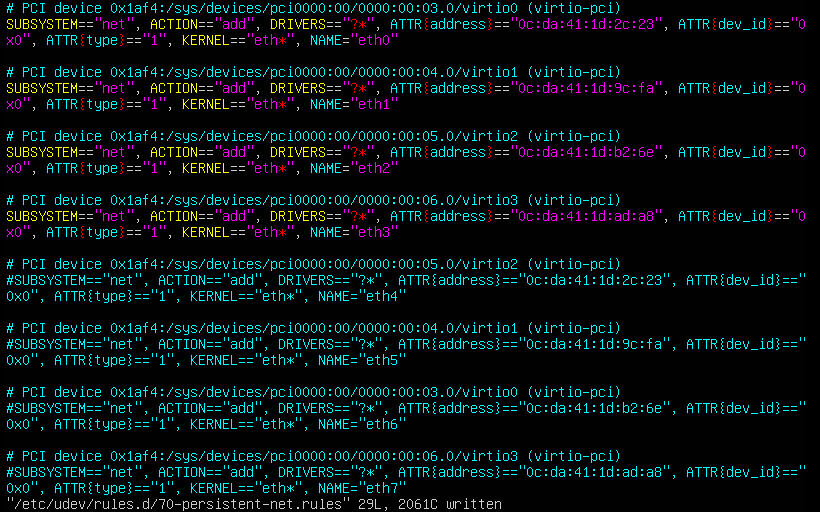
Update the MAC addresses based on the mapping relations recorded in Table 3 (values of MAC addresses must be in lowercase):
Go to the NAME=”eth0” line, and update the MAC address, for example, ATTR{address}==“0c:da:41:1d:2c:23”.
Go to the NAME=”eth1” line, and update the MAC address, for example, ATTR{address}==“0c:da:41:1d:9c:fa”.
Go to the NAME=”eth2” line, and update the MAC address, for example, ATTR{address}==“0c:da:41:1d:b2:6e”.
Go to the NAME=”eth3” line, and update the MAC address, for example, ATTR{address}==“0c:da:41:1d:ad:a8”.
To comment the entries for eth4 to eth7, start each line with "#"
After updating the information as shown in Figure 49, verify the configuration. Then press ESC, and enter :wq, save the configuration, and quit the vim editor.
¡ For a CentOS system: After the NIC replacement is complete, new configuration files (ifcfg-eth4 to ifcfg-eth7) will be generated under the /etc/sysconfig/network-scripts/ directory. You need to update the HWADDR values in the original configuration files (ifcfg-eth0 to ifcfg-eth3) to new MAC addresses based on the mapping relations between the original eth numbers and new MAC addresses in Table 3.
Open the ifcfg-eth0 file with the vim editor, locate the HWADDR line and update the MAC addresses, for example, HWADDR="0c:da:41:1d:2c:23" (the MAC address must be in lowercase). After updating the information as shown in Figure 49, verify the configuration. Then press ESC, and enter :wq, save the configuration, and quit the vim editor.
Continue to update ifcfg-eth1 to ifcfg-eth3 with the procedures similar to that of updating ifcfg-eth0. After update, delete the configuration files (ifcfg-eth4 to ifcfg-eth7).
Figure 48 Updating the MAC address of new eth0 in the CentOS system
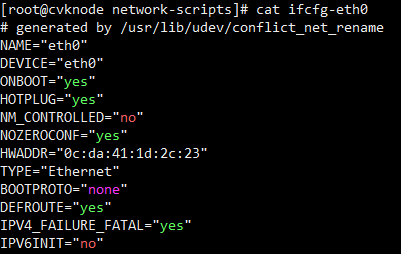
8. After modification, execute the reboot command to reboot the host. Then log in to the host CLI, and use the ip a command to check the mapping relations between the eth numbers and the MAC addresses. Use ping to verify network connectivity after NIC replacement.
If the mapping relations between the eth numbers and the MAC addresses are correct, but ping verification fails, check the connection relations between the network cables, optical fiber cables and NIC interfaces and mapping relations between NIC interfaces and MAC addresses.
Figure 49 Using the ip a command to verify the mapping relations between eth numbers and MAC addresses
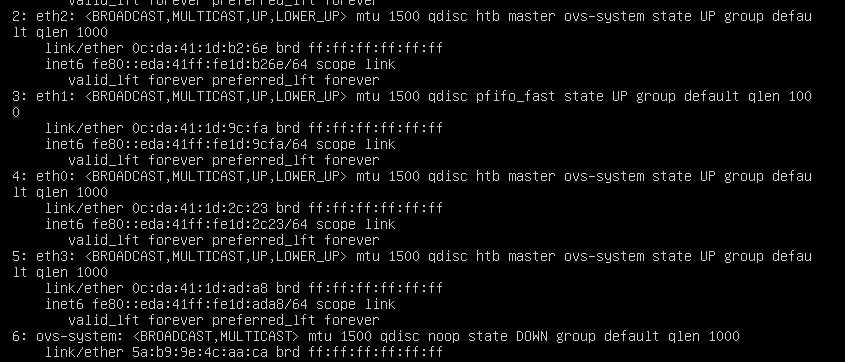
9. After maintenance is complete, exit maintenance mode for the CVK host in the CVM Web interface.
Changing, extending, updating, and unbinding licenses
For information about changing, extending, updating, and unbinding licenses, see H3C CAS Licensing Guide.
Modifying the management IP address and host name
|
|
CAUTION: · Do not modify the IP address and host name in the CLI of the CVK. · If you delete a CVK host while the shared storage of the CVK is suspended, the shared storage will be automatically deleted. You need to remount the shared storage after adding back the CVK host. · You cannot modify the IP address of the storage intranet, storage extranet, and service network if these networks share the IP address. · When deleting a host, the system will automatically back up the data. |
You might need to modify the management IP or host name after CAS deployment.
After adding a CVK host to the system, you cannot modify the IP address or hostname from the Xconsole interface, as shown in the following figure. You must first delete the CVK host from the system.
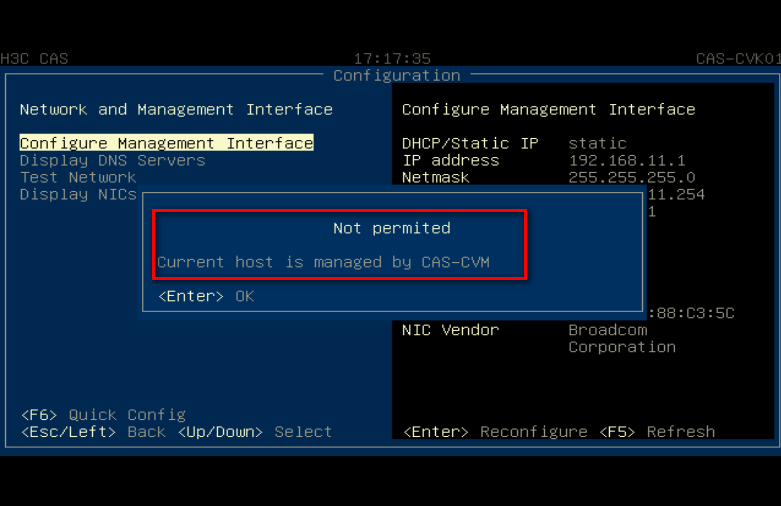
The CVK host cannot be deleted if shared storage is enabled on it or virtual machines are running on it. In this case, you need to first shut down the virtual machines (or migrate the virtual machines) and suspend the shared file system (delete the shared file system), and then delete the host.
Flowchart for modifying the management IP and host name
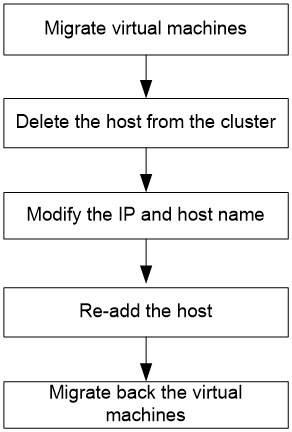
Procedure
1. Delete the CVK host from the CAS system.
2. Log in to the Xconsole of CVK.
3. Select Network and Management Interface and press Enter.
Figure 50 Selecting Network and Management Interface
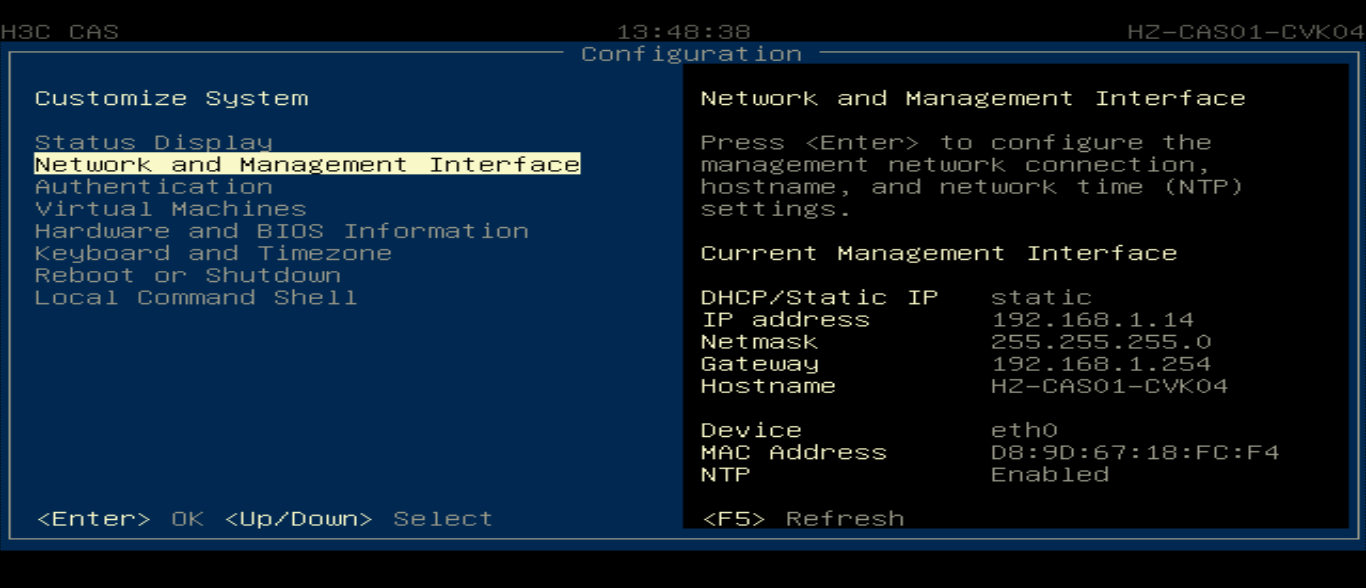
c. Select Configure Management Interface and press Enter.
Figure 51 Selecting Configure Management Interface
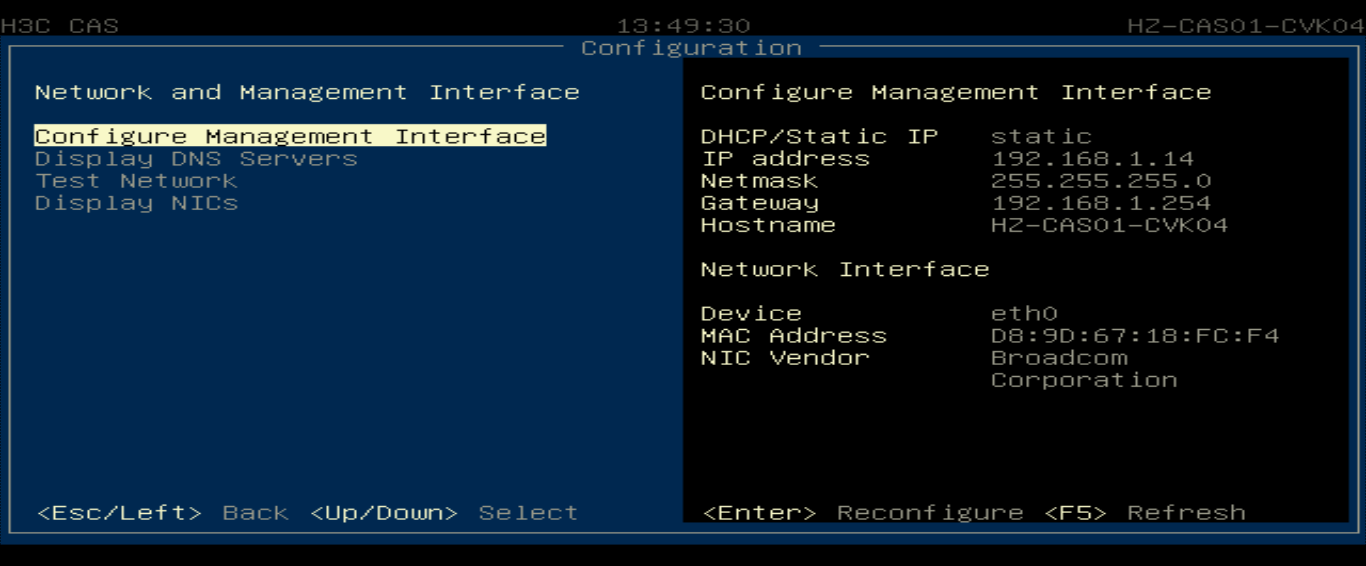
d. Enter the root password.
Figure 52 Entering the root password
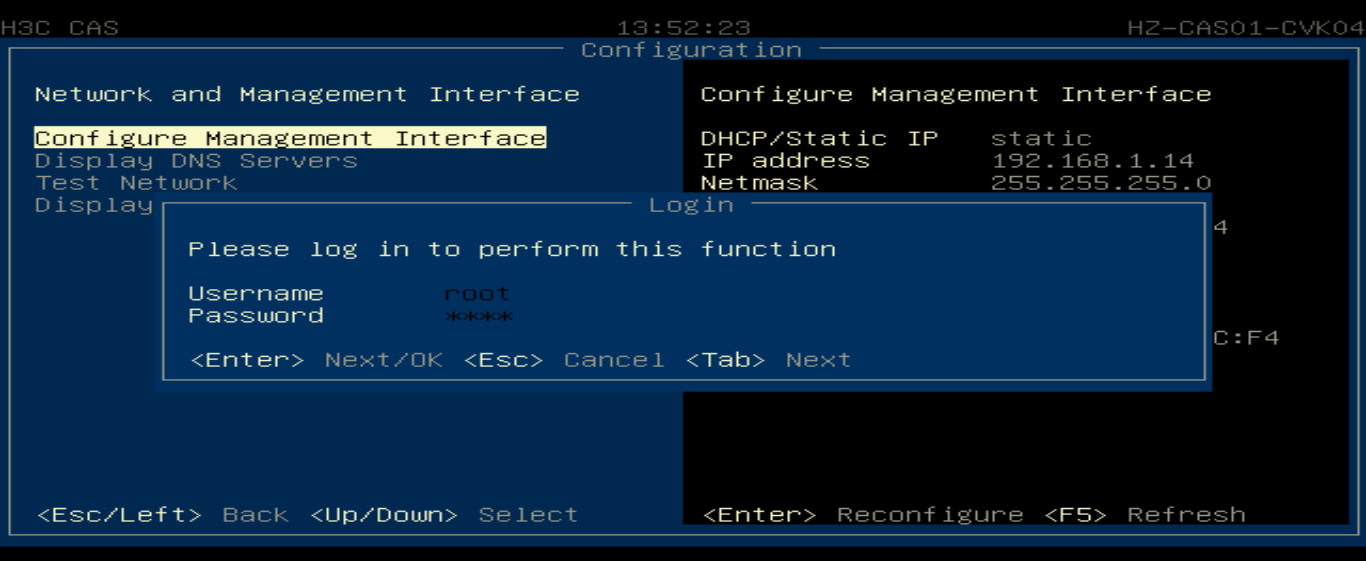
4. Select the management interface to modify, and then press Enter.
Figure 53 Selecting a management interface
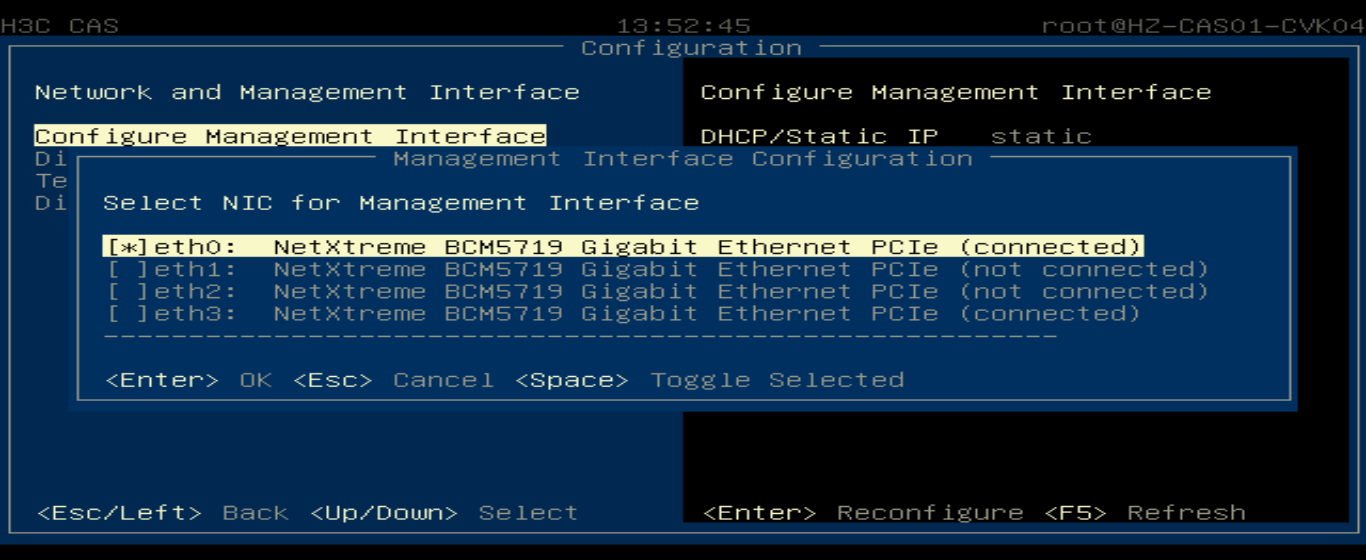
5. Modify the IP address and hostname, and then press Enter.
Figure 54 Modifying management IP address and host name
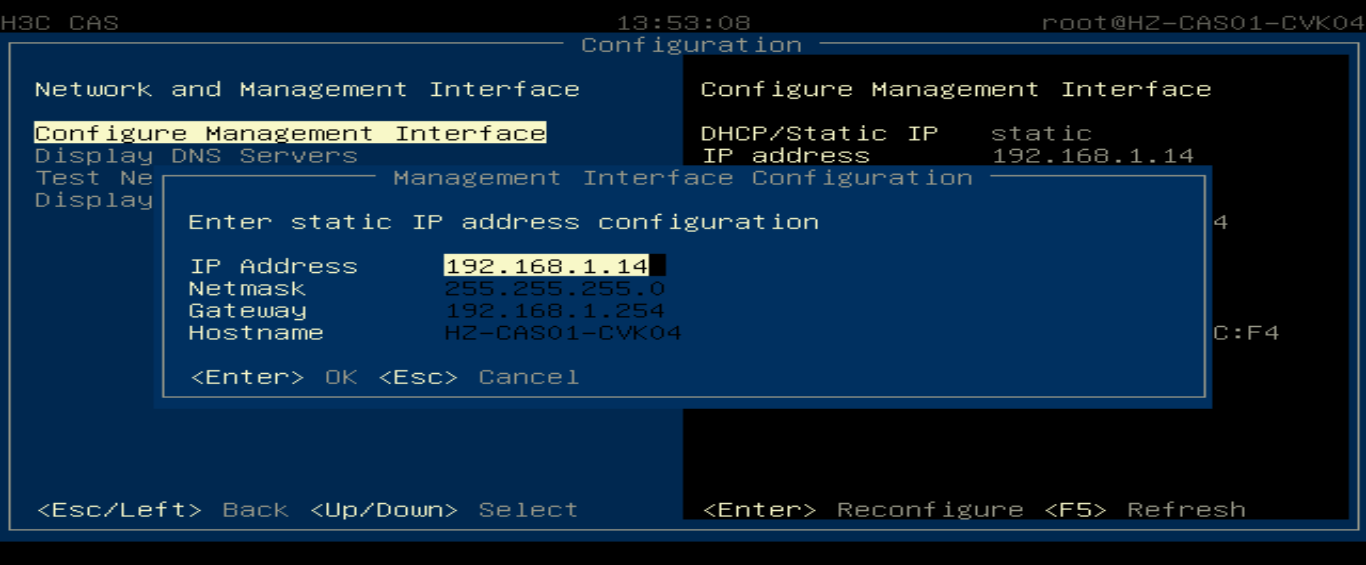
6. Re-add the host to the cluster and then migrate back the VMs.
Changing the physical interface bound to the management vSwitch
You can change the physical interface of a service or storage vSwitch (vSwitch) from the Web interface.
You can change the physical interface of a management vSwitch from the Web interface or from the XConsole interface of the CVK host.
Changing the physical interface bound to the management vSwitch from the CAS Web interface
Changing the physical interface bound to the management vSwitch might cause network disruption. In this case, you can make the change from the XConsole interface of the CVK host.
1. Log in to CAS and then select the vSwitch used by the service network, yewu in this example. As shown in the figure, the service network is bound to physical interface eth2. Click the Edit icon in the Actions column for that vSwitch.
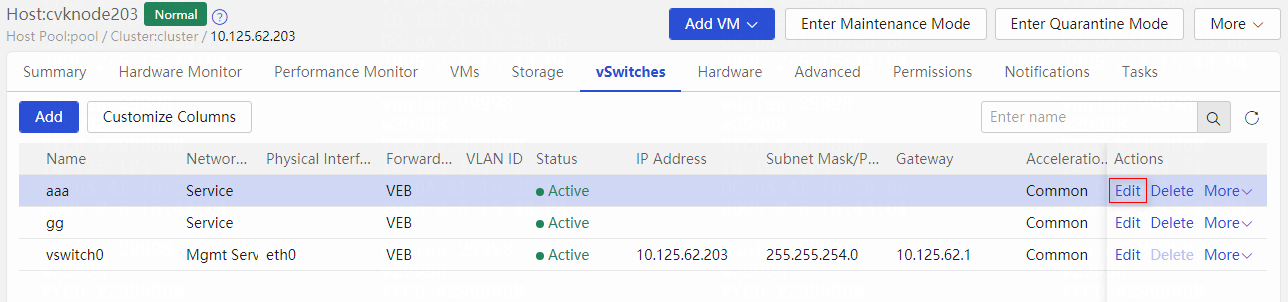
2. On the Modify vSwitch page, change the physical interface to eth1.
|
|
CAUTION: · If a virtual machine uses the vSwitch, the physical interface of the vSwitch cannot be modified. · Modifying the physical interface might cause abrupt network interruption. If services in virtual machines cannot tolerate abrupt network interruption, migrate the virtual machines on the host to another host. |
3. Verify the change of the physical interface bound to the management vSwitch.
Changing the physical interface bound to the management vSwitch from the Xconsole interface
1. Access the Xconsole Interface of the host.
2. Navigate to the Network and Management Interface page.
Make sure you have deleted the target CVK host on the CVM page. If the host has not been deleted, a prompt like "Current host is managed by CAS-CVK01" or "ocfs2 or Active/Standby is running" is displayed when you select Configure Management Interface.
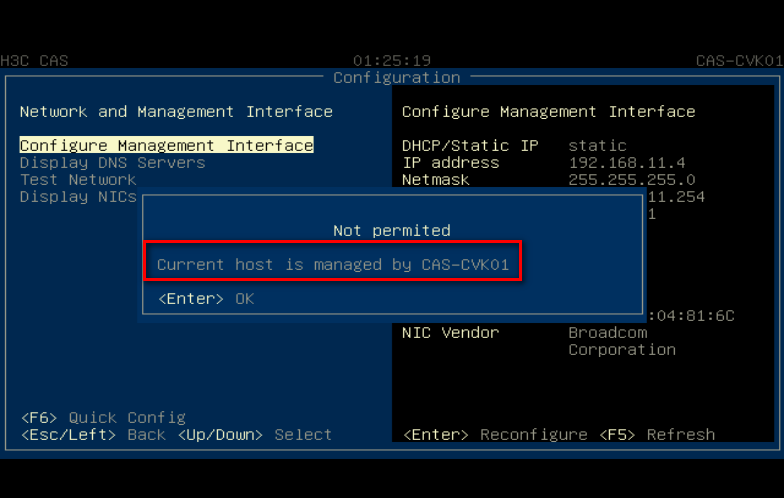
3. Select Configure Management Interface and identify the current physical interface used. Physical interface eth0 is used in this example.

|
|
NOTE: The Configure Management Interface menu displays the physical interface used by the management vSwitch. |
4. On the Management Interface Configuration page, change the physical interface to eth1 and then press Enter.
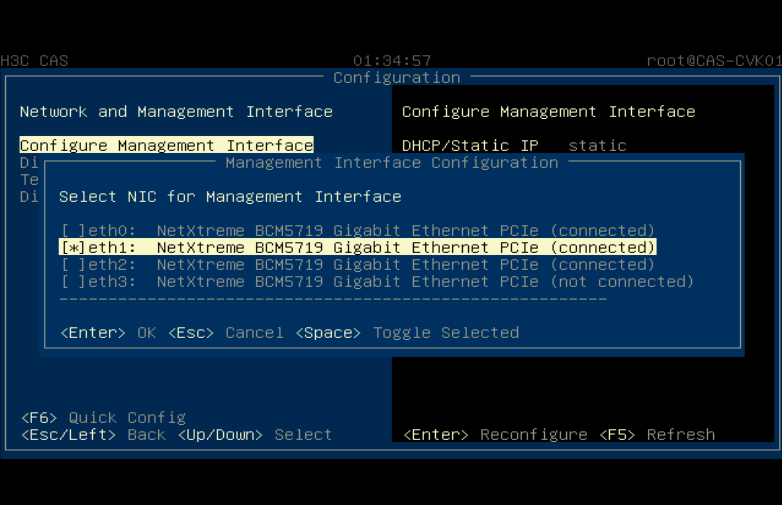
5. On the Configure Management Interface page, verify that the physical interface has been changed to eth1.

Adding a physical NIC to a CVK host
Restart the CVK host after adding a physical NIC, for example a PCI NIC, to the host. You can view information about the newly added physical NIC on the physical NIC page of the CVK host.
Modifying the CVK root password
As a best practice, change the CVK root password regularly for security. CAS supports modifying the CVK root password.
Restrictions and guidelines
|
|
CAUTION: Do not change the root password for a CVK host in the CLI. |
As a best practice, do not log in to the CVK CLI via SSH to modify the root password, as this will cause corruption of the password-free access between CVM and CVK, resulting in abnormal display of CVK at the CVM Web interface.
To restore password-free access if it is corrupted, log into the CVK CLI, change the password to the previous password, and then connect to the host from the Web interface.
Procedure
1. Enter the CAS Web interface, select the host for which you are to change the root password.
2. Right-click the host or click More, then select Modify Host.
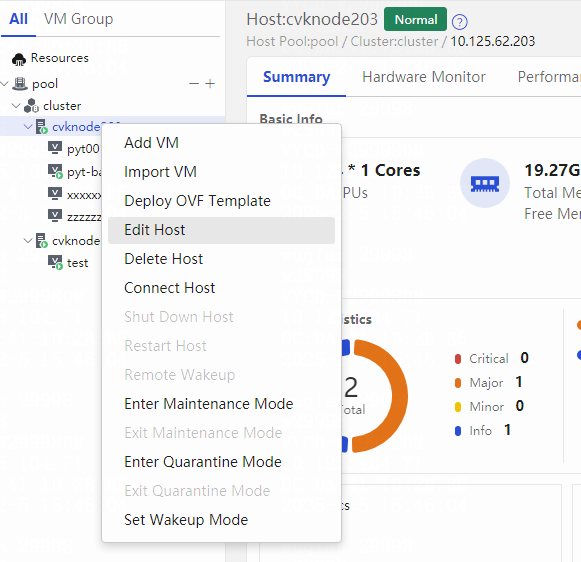
3. Change the root password.
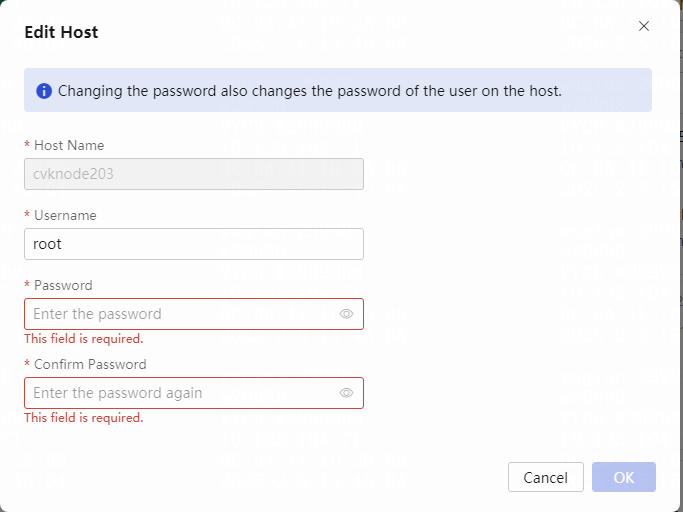
Common issue analysis and troubleshooting method with logs
View the cas.log messages generated at the operation time, and determine the cause of the issue.
Backing up and restoring CVM configuration
Backing up CVM configuration
If CVM backup settings are not configured, the system will automatically back up the CVM configuration in the /vms directory of CVK. If CVM backup settings are configured, the CVM configuration will be backed up to the specified location.
You can specify a local or remote FTP/SCP server and set a specific CVM backup policy at the Web interface as shown in the following figure. Then, the system will back up the configuration at specified intervals.
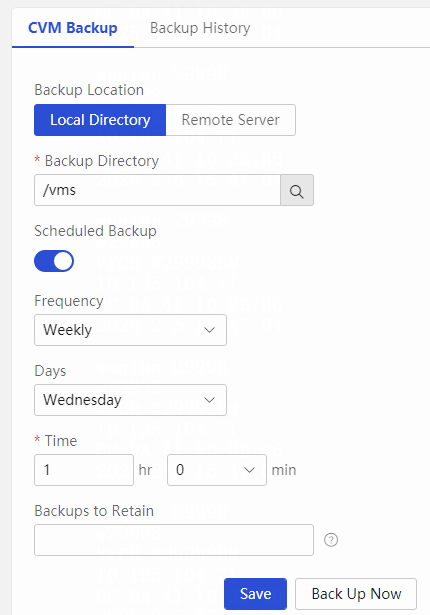
Restoring the CVM configuration
After uploading the backup configuration file, click Restore.
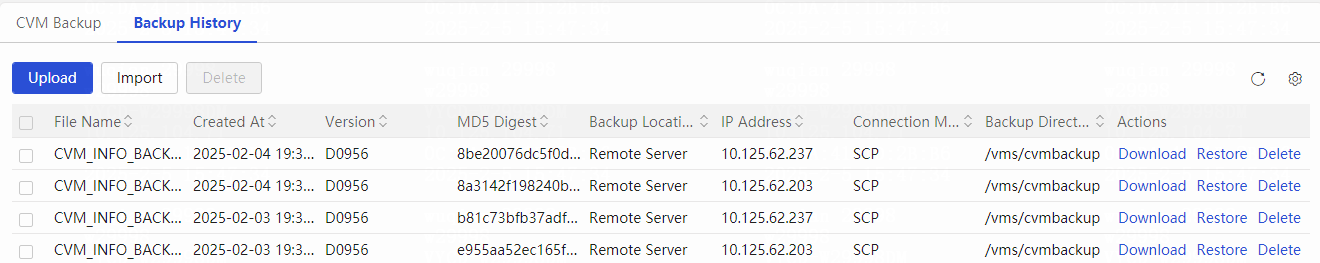
|
|
CAUTION: CVM typically has 2 system disks configured in RAID1. The two system disks back up each other. Damage of one disk does not affect the normal operation of the system. If both disks are damaged, the system cannot be restored. In the event of one system disk being damaged, replace it promptly. |
Changing the admin password
Changing the default admin password
The admin account is assigned a default password after CAS is installed. Upon login, users will be prompted to modify the default admin password.
To modify the password, click Modify Now.
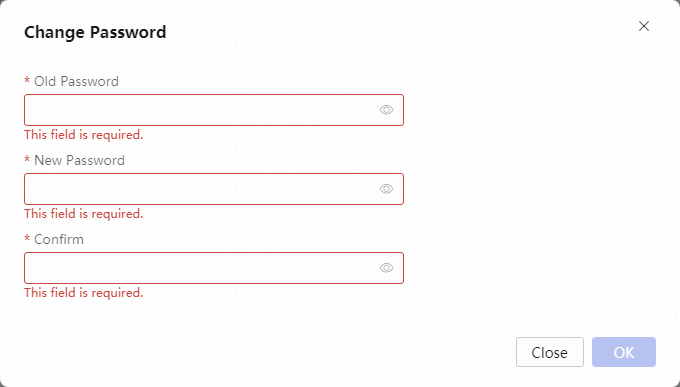
The modified password must comply with the complexity requirements.
Changing the admin password at the operator management page
You can change the admin password at the operator management page after logging in to CVM.
1. Navigate to the System > Operators & Groups > Operator page.
2. Click Modify in the Actions column for the admin user and select to reset the password.
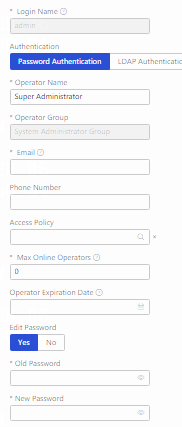
Resetting the admin password in the CVM CLI
In the case that you forget the admin login password, you can restore the default admin password in the CVM CLI by executing the ./ResetAdminPwd.sh script in the /opt/tool directory.
Common issue analysis and troubleshooting method with logs
View the cas.log messages generated at the operation time, and determine the cause of the issue.
Redefining a virtual machine
If a virtual machine cannot be started because the host where the virtual machine resides is abnormal, you can redefine the virtual machine on another host and bring it up.
To redefine a virtual machine:
1. Locate the configuration file of the virtual machine.
When HA is enabled, the virtual machine's configuration file will be saved by default in the HA directory on the CVM host, typically, the /etc/cvm/ha/clust_id/cvk_name directory. Such directory exists for each cluster. cvk_name represents the CVK where the virtual machine is located. In this directory, you will find the configuration file of the virtual machine, for example, the configuration file of virtual machine test01.
2. Identify the storage volume that contains the disk file of the virtual machine.
If you already know the storage volume where the virtual machine disk is located, you can go to CLI of another host that has mounted the storage volume and verify whether the storage volume is normal. If you do not know the storage volume where the virtual machine disk is located, view the virtual machine's configuration file via vim or cat editor and identify the location of the virtual machine's disk.
The source file path is the location of the disk file.
3. Copy the virtual machine's configuration file to another host.
Copy the virtual machine's configuration file in 1 to the /etc/libvirt/qemu directory on another host on which the storage volume has been mounted.
4. Redefine the virtual machine by using the configuration file.
a. In the /etc/libvirt/qemu directory, execute the virsh define vm_xml command, as shown below:
The virtual machine is defined through the XML configuration file.
You can view the virtual machine by using the virsh list –all command in the CLI.
b. Connect to the host in the CVM Web interface, and you can see the virtual machine and start it from the Web interface.
c. In the event where a large number of virtual machines need to be defined, you can automatically define virtual machines by restarting libvirt (after verifying that no Chinese virtual machines exist). As shown in the figure, after a successful definition, start the virtual machines in the Web interface.
5. Clear VMs from the original host.
¡ If the host is completely damaged because of hardware issues, repair the server hardware and reinstall CAS.
¡ If the host does not have hardware issues, disable cluster's HA on the CVM to prevent double-writing when the server restarts and the HA pulls up the virtual machines on the source host. After disabling HA, if the server can start upon reboot, you can delete the virtual machines on the source host in the Web interface.
Logs
System logs
The log function of CAS can collect all log information of CVM and CVKs managed by CVM.
In theory, to locate an issue, you need to analyze the logs of the related functional modules. However, in the case of a host anomaly, you need to analyze all log contents to locate possible anomalies from the logs.
CAS is a software product, and deployment of CAS requires configuration of servers, switches, and storage. Any anomaly in any process might result in a software anomaly or fault. Therefore, when a fault occur, it is necessary to analyze them in conjunction with the relevant product lines. When collecting CAS logs, determine whether a joint investigation with relevant product lines is needed. For example, a link flapping issue requires a joint inspection of switches and storage.
Logs provide some local historical information. In some cases, it is necessary to log into the system remotely and check the relevant real-time data.
Collecting logs
1. Navigate to the System > Operation Logs > Collect page.
2. Select the CVK host the logs of which you are to collect, and then click Collect to save the log file to your local computer.
If a CVK anomaly occurs and you cannot collect CVK logs from the CVM page, you can log in to the CVK CLI to manually collect the logs.
Execute the cas_collect_log.sh command in the CVK host CLI. After the collection is completed, a log file for the CVK host will be generated in the /vms directory.
You can download the file to your local computer for analysis by using SSH client software.
root@cvknode213:~# cas_collect_log.sh -h
SHELL NAME: cas_collect_log.sh
USAGE : cas_collect_log.sh $time $size
PARAMETER :
time : collect log last time days
size : size of logs(KB)
Command for manual collection of the logs:
root@cvknode213:~# cas_collect_log.sh 1 100000
root@cvknode213:~# ls -al /vms/cvknode213.diag.tar.bz2
-rw-r----- 1 root root 1106638 Mar 20 14:04 /vms/cvknode213.diag.tar.bz2
Logs
The name of the downloaded log file is CAS_XXX_XXX.tar.gz.
Compressed log package
The files in the compressed log package include:

· cas*.log/cas*.log.gz: CVM management console logs.
· casserver.tart.gz: CAS server logs.
· catalina.out: Web container Tomcat logs.
· oper_log.log: User operation logs.
· *.diag.tar.bz2: CVK host logs.
· WARN*.tar.gz: Alarm information.
· haDomain.tar: HA configuration information.
CVK log files
Decompress the XXX.tar.bz2 log file of the CVK host. It contains the following directory files:
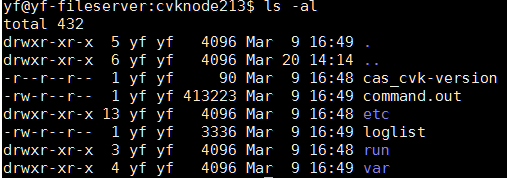
· etc: The directory contains some configuration files under /etc, such as libvirt, ovs, and ocfs2.
· var: Contains log information and system information of functional modules, syslogs, and script logs.
· command.out: CLI command output information, host hardware information, ovs configuration, some libvirt commands. As a best practice, familiarize yourself with the contents of this file.
· cas _cvk-version: Version information.
· loglist: Log file name information.
· run: Status information in running state.
Log information for each functional module in the CVK var directory
As shown in the following example, some log information is recorded:
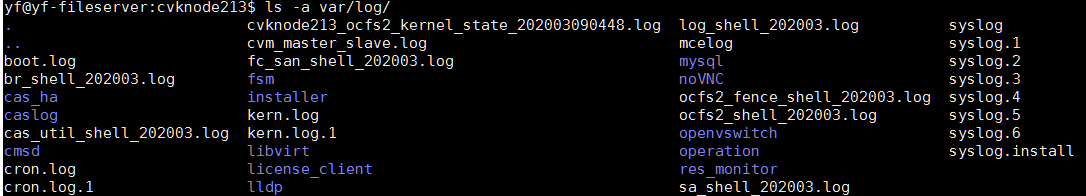
· Syslog/message: Host syslogs that record system running information.
· Ocfs2_shell_XX.log: Shared file system script logs.
· Fsm: fsm storage manager logs.
· cas_ha: HA logs (H3C-proprietary).
· Ha_shell_XX.log: HA logs.
· Libvirt: Virtual machine logs.
· Openvswtich: vSwitch logs.
· Ovs_shell_XX.log: vSwitch logs.
· Tomcat8: Web logs.
· Operation: Logs about manual operations in the CLI.
The Syslog/message logs record important information during the operation of the operating system, such as information about CVK host common issues, the server startup process, and service processes.
The Libvirtd.log records the running status of libvirt. The running status of other modules can be found in their respective logs.
Analysis for restart of a CVK host after an unexpected crash
With HA configured, virtual machines on a host will be automatically migrated if the host suddenly crashes and restarts. The migration process of the virtual machines can be found in the operation logs at the Web interface.
As shown in the following example, the syslog/message logs for a CVK shows that it was restarted at 20200320 16:15:15. The fault occurred between 16:04:54 and 16:15:15.
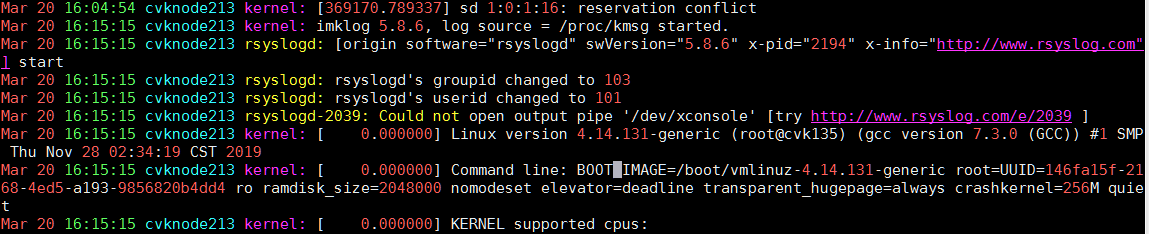
No anomaly logs were generated before the restart.
The command.out logs record crash information and some stack information.
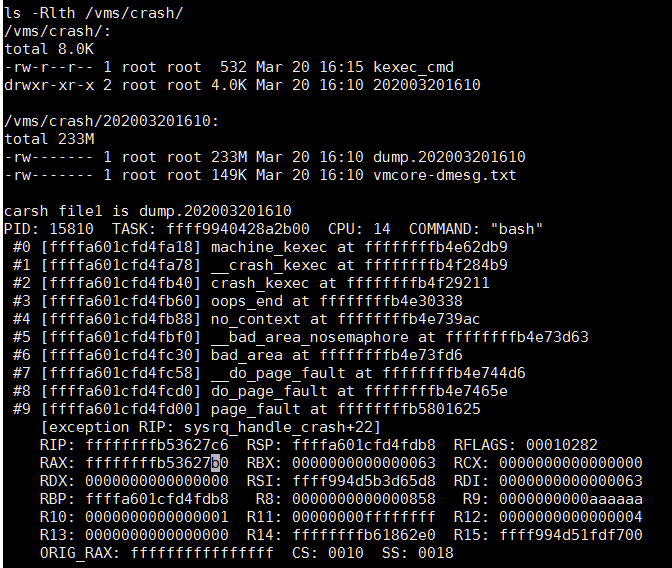
Libvirt logs
As shown below, a log in the /var/log/libvirt/libvirtd.log file reported that the CVK host lacked memory resources with the memory usage reaching 97%. Similar logs are displayed when CPU resources are insufficient.
2014-10-24 09:15:52.792+0000: 2994: warning : virIsLackOfResource:1106 : Lack of Memory resource! only 374164 free 64068 cached and vm locked memory(4194304*0%) of 16129760 total, max:85; now:97
2014-10-24 09:15:52.792+0000: 2994: error : qemuProcessStart:3419 : Lack of system resources, out of memory or cpu is too busy, please check it.
The log directory (/var/log/libvirt/qemu) saves the log files of virtual machines running on the CVK host, as shown below.
/var/log/libvirt/qemu# ls -l
total 44
-rw------- 1 root root 7067 Jan 9 19:08 RedHat5.9.log
-rw------- 1 root root 1969 Jan 18 15:41 win7.log
-rw------- 1 root root 26574 Feb 11 16:15 windows2008.log
The virtual machine log file records operation information of the virtual machine, such as its startup time, shutdown time, and disk file information.
2015-02-11 15:50:18.349+0000: starting up
LC_ALL=C PATH=/usr/local/sbin:/usr/local/bin:/sbin:/bin:/usr/sbin:/usr/bin QEMU_AUDIO_DRV=none /usr/bin/kvm -name windows2008 -S -machine pc-i440fx-1.5,accel=kvm,usb=off,system=windows -cpu qemu64,hv_relaxed,hv_spinlocks=0x2000 -m 1024 -smp 1,maxcpus=12,sockets=12,cores=1,threads=1 -uuid 43741f06-166d-4155-b47e-4137df68e91c -no-user-config -nodefaults -chardev file=/vms/sharefile/windows2008,if=none,id=drive-virtio-disk0,format=qcow2,cache=directsync –device
…..
char device redirected to /dev/pts/0 (label charserial0)
qemu: terminating on signal 15 from pid 4530
2015-02-11 16:15:28.825+0000: shutting down
Operation logs
Operation logs record command information executed in the CVK CLI. The information in the operation log file includes the execution time, access user, login address and method, as well as the specific command and directory where the command is executed for each command.
root@cvknode213:~# ls -al /var/log/operation/
total 24
drwxrwxrwx 2 root root 4096 Mar 20 14:03 .
drwxr-xr-x 35 root root 4096 Mar 20 17:15 ..
-rwxrwxrwx 1 root root 2787 Mar 13 17:32 20-03-13.log
-rwxrwxrwx 1 root root 3609 Mar 16 16:50 20-03-16.log
-rwxrwxrwx 1 root root 202 Mar 19 16:35 20-03-19.log
-rwxrwxrwx 1 root root 1676 Mar 20 17:15 20-03-20.log
2020/03/20 17:11:55##root pts/0 (10.114.72.54)##/root## sa_info.sh
2020/03/20 17:11:55##root pts/0 (10.114.72.54)##/root## sa_info.sh
2020/03/20 17:11:59##root pts/0 (10.114.72.54)##/root## ls -al /var/log/operation/
2020/03/20 17:13:50##root pts/0 (10.114.72.54)##/root## more /var/log/operation/20-03-20.log
Collecting logs of CAStools
The system and VMs are isolated. To monitor and manage VMs on the system, you must install CAStools on the operating system of the VMs.
The log collection method for CAStools varies by the VM operating system:
· Windows operating system—Obtain the qemu-ga.log file in the C:\Program Files\castools\ directory of a VM.
· Linux operating system—Obtain the qemu-ga.log, set-ip.log, and set-ipv6.log files in the /var/log/ directory of a VM.
To obtain more detailed information about log messages, you can edit the configuration file of QEMU-GA and adjust the log levels for debugging purposes.
· On the Linux operating system, perform the following operations:
a. Use the /etc/qemu-ga/qemu-ga.conf command to access the configuration file.
b. Edit the line #verbose=true by removing the pound sign (#) in front of it to make it effective, save the configuration file, and then restart the QEMU-GA service.
· On the Windows operating system, use the C:<错误!超链接引用无效。> command to access the configuration file and perform the same operations as on the Linux operating system.
Managing logs of a Windows operating system
Collecting logs of a Windows operating system
1. Open the Server Manager window, and then select Server Manager > Diagnostics > Event Viewer > Windows logs from the left navigation pane.
2. Right click System, and then select Save All Events As.
3. Save the logs to a file.
The downloaded log file is saved to the specified location with the specified file name.
Viewing logs of a Windows operating system
1. On the local computer (installed with the Windows 7 operating system), open the Computer Management window. From the left navigation pane, select Computer Management (Local) > System Tools > Event Viewer. Right click Windows Logs, and then select Open Saved Log.
2. In the dialog box that opens, select the saved log file.
The logs are displayed on the Computer Management (Local) > System Tools > Event Viewer > Saved Logs page.
Troubleshooting tools and utilities for CVK host issues
Introduction to kdump
Kdump is a dump tool of the Linux kernel. It saves part of the memory to store the capture kernel. Once the current kernel crashes, kdump uses kexec to run the capture kernel. The capture kernel dumps complete information of the crashed kernel (for example, CPU register and stack statistics) to files on a local disk or in the network.
By default, CAS supports kdump. When the kernel of a CVK host fails, the system generates crash files in the /vms/crash directory for troubleshooting, as shown in the following example:
root@cvknode213:~# ls -al /vms/crash/*
-rw-r--r-- 1 root root 532 Mar 20 16:15 /vms/crash/kexec_cmd
/vms/crash/202003201610:
total 238104
drwxr-xr-x 2 root root 4096 Mar 20 16:10 .
drwxr-xr-x 3 root root 4096 Mar 20 16:10 ..
-rw------- 1 root root 243650117 Mar 20 16:10 dump.202003201610
-rw------- 1 root root 151992 Mar 20 16:10 vmcore-dmesg.txt
// File dump.202003201610 is a core dump file, and file vmcore-dmesg.txt contains dmesg information.
[369478.414803] sysrq: SysRq : Trigger a crash
[369478.415664] BUG: unable to handle kernel NULL pointer dereference at (null)
[369478.417279] IP: sysrq_handle_crash+0x16/0x20
[369478.418162] PGD 80000017d6b58067 P4D 80000017d6b58067 PUD 1716680067 PMD 0
[369478.419594] Oops: 0002 [#1] SMP PTI
[369478.420318] Modules linked in: ipt_REJECT(E) nf_reject_ipv4(E) xt_connlimit(E) bnx2fc(OE) cnic(OE) uio(E) fcoe(E) libfcoe(E) libfc
(E) drbd(E) lru_cache(E) chbk(OE) 8021q(E) mrp(E) garp(E) stp(E) llc(E) ocfs2_dlmfs(OE) ocfs2_stack_o2cb(OE) ocfs2_dlm(OE) ocfs2_disk_
lock(OE) ocfs2(OE) quota_tree(E) ocfs2_nodemanager(OE) event_keeper(OE) ocfs2_stackglue(OE) ib_iser(E) rdma_cm(E) ib_cm(E) iw_cm(E) is
csi_tcp(E) libiscsi_tcp(E) libiscsi(E) scsi_transport_iscsi(E) openvswitch(OE) udp_tunnel(E) nf_conntrack_ipv4(E) nf_defrag_ipv4(E) nf
_nat_ipv4(E) nf_conntrack_ipv6(E) nf_defrag_ipv6(E) nf_nat_ipv6(E) nf_nat(E) nf_conntrack(E) dm_multipath(E) vhost_net(E) vhost(OE) ta
p(E) kvm_intel(E) kvm(E) irqbypass(E) nbd(E) nfsd(E) nfs_acl(E) auth_rpcgss(E) nfs(E) fscache(E) lockd(E) sunrpc(E) grace(E) dm_crypt(
E) xt_tcpudp(E)
[369478.434808] iptable_filter(E) ip_tables(E) x_tables(E) ipmi_ssif(E) dm_mod(E) ses(E) enclosure(E) input_leds(E) joydev(E) psmouse
(E) gpio_ich(E) ipmi_si(E) ipmi_devintf(E) mac_hid(E) ipmi_msghandler(E) hpwdt(E) lpc_ich(E) serio_raw(E) hid_generic(E) hpilo(E) i7co
re_edac(E) acpi_power_meter(E) lp(E) parport(E) ext4(E) jbd2(E) mbcache(E) raid10(E) raid456(E) async_raid6_recov(E) async_pq(E) async
_xor(E) xor(E) async_memcpy(E) async_tx(E) raid6_pq(E) libcrc32c(E) raid1(E) raid0(E) multipath(E) linear(E) mlx4_ib(E) ib_core(E) mlx
4_core(E) devlink(E) ttm(E) drm_kms_helper(E) sd_mod(E) lpfc(OE) drm(E) scsi_transport_fc(E) fb_sys_fops(E) nvmet_fc(E) sysimgblt(E) n
vmet(E) sysfillrect(E) usbhid(E) hpsa(E) syscopyarea(E) nvme_fc(E) hid(E) i2c_algo_bit(E) scsi_transport_sas(E) nvme_fabrics(E) nvme_c
ore(E)
[369478.723332] be2net(OE)
[369478.723339] CPU: 14 PID: 15810 Comm: bash Tainted: G IOE 4.14.131-generic #1
[369478.833417] Hardware name: HP ProLiant BL460c G7, BIOS I27 07/02/2013
[369478.870909] task: ffff9940428a2b00 task.stack: ffffa601cfd4c000
[369478.908585] RIP: 0010:sysrq_handle_crash+0x16/0x20
[369478.945930] RSP: 0018:ffffa601cfd4fdb8 EFLAGS: 00010282
[369478.983035] RAX: ffffffffb53627b0 RBX: 0000000000000063 RCX: 0000000000000000
[369479.056131] RDX: 0000000000000000 RSI: ffff994d5b3d65d8 RDI: 0000000000000063
[369479.129041] RBP: ffffa601cfd4fdb8 R08: 0000000000000858 R09: 0000000000aaaaaa
[369479.201263] R10: 0000000000000001 R11: 00000000ffffffff R12: 0000000000000004
[369479.273947] R13: 0000000000000000 R14: ffffffffb61862e0 R15: ffff994d51fdf700
[369479.346628] FS: 00007faae2b1d740(0000) GS:ffff994d5b3c0000(0000) knlGS:0000000000000000
[369479.419160] CS: 0010 DS: 0000 ES: 0000 CR0: 0000000080050033
[369479.455372] CR2: 0000000000000000 CR3: 00000017cfe30005 CR4: 00000000000206e0
[369479.526730] Call Trace:
[369479.561171] __handle_sysrq+0x88/0x140
[369479.595200] write_sysrq_trigger+0x2f/0x40
[369479.628478] proc_reg_write+0x45/0x70
[369479.660856] __vfs_write+0x3a/0x170
[369479.692065] ? set_close_on_exec+0x35/0x70
Kdump file analysis
You can use the crash tool to analyze kdump files. The vmlinux file for the kernel version is required for the analysis. You can find that file at /usr/src/linux-4.14.0-generic/vmlinux-kernelversion (the kernel version name might vary), for example, crash /usr/src/linux-4.14.131-generic/vmlinux-4.14.131-generic /vms/crash/202003201610/dump.202003201610.
After you use the crash tool to analyze a dump core file, you can output the corresponding logs by using the bt or log command. The output information of the commands can be saved in a text file and sent to R&D for preliminary analysis.
CPU error
1. View abnormal call stack information.
crash] bt
PID: 0 TASK: ffff8807f4618000 CPU: 6 COMMAND: "swapper/6"
#0 [ffff8807ffc6ac50] machine_kexec at ffffffff8104c991
#1 [ffff8807ffc6acc0] crash_kexec at ffffffff810e97e8
#2 [ffff8807ffc6ad90] panic at ffffffff8174ac9d
#3 [ffff8807ffc6ae10] mce_panic at ffffffff81038b2f
#4 [ffff8807ffc6ae60] do_machine_check at ffffffff810399d8
#5 [ffff8807ffc6af50] machine_check at ffffffff817589df
[exception RIP: intel_idle+204]
RIP: ffffffff8141006c RSP: ffff8807f4621db8 RFLAGS: 00000046
RAX: 0000000000000010 RBX: 0000000000000004 RCX: 0000000000000001
RDX: 0000000000000000 RSI: ffff8807f4621fd8 RDI: 0000000001c0d000
RBP: ffff8807f4621de8 R8: 0000000000000009 R9: 0000000000000004
R10: 0000000000000001 R11: 0000000000000001 R12: 0000000000000003
R13: 0000000000000010 R14: 0000000000000002 R15: 0000000000000003
ORIG_RAX: ffffffffffffffff CS: 0010 SS: 0018
--- [MCE exception stack] ---
#6 [ffff8807f4621db8] intel_idle at ffffffff8141006c
#7 [ffff8807f4621df0] cpuidle_enter_state at ffffffff81602a8f
#8 [ffff8807f4621e50] cpuidle_idle_call at ffffffff81602be0
#9 [ffff8807f4621ea0] arch_cpu_idle at ffffffff8101e2ce
#10 [ffff8807f4621eb0] cpu_startup_entry at ffffffff810c1818
#11 [ffff8807f4621f20] start_secondary at ffffffff8104306b
crash]
// The output information shows that a machine check error (MCE) exception has occurred. This exception is typically caused by a hardware issue.
2. Execute the crash-dmesg command to view information generated before the unexpected reboot.
[ 15.707981] 8021q: 802.1Q VLAN Support v1.8
[ 16.416569] drbd: initialized. Version: 8.4.3 (api:1/proto:86-101)
[ 16.416573] drbd: srcversion: F97798065516C94BE0F27DC
[ 16.416575] drbd: registered as block device major 147
[ 17.142281] Ebtables v2.0 registered
[ 17.203400] ip_tables: (C) 2000-2006 Netfilter Core Team
[ 17.247387] ip6_tables: (C) 2000-2006 Netfilter Core Team
[ 139.114172] Disabling lock debugging due to kernel taint
[ 139.114185] mce: [Hardware Error]: CPU 2: Machine Check Exception: 4 Bank 5: be00000000800400
[ 139.114192] mce: [Hardware Error]: TSC 10ba0482e78 ADDR 3fff81760d32 MISC 7fff
[ 139.114199] mce: [Hardware Error]: PROCESSOR 0:206c2 TIME 1415161519 SOCKET 0 APIC 14 microcode 13
[ 139.114203] mce: [Hardware Error]: Run the above through 'mcelog --ascii'
[ 139.114208] mce: [Hardware Error]: Machine check: Processor context corrupt
[ 139.114211] Kernel panic - not syncing: Fatal Machine check
crash]
// The output information shows that an error has occurred on CPU 2.
Memory error
A CVK node at a site reboots unexpectedly. No abnormal records are found in the syslogs before and after the reboot. The node generates a kdump record at the reboot.
1. View call stack information from the Kdump record.
A hardware error might occur if the following information is output:
crash] bt
PID: 0 TASK: ffffffff81c144a0 CPU: 0 COMMAND: "swapper/0"
#0 [ffff880c0fa07c60] machine_kexec at ffffffff8104c991
#1 [ffff880c0fa07cd0] crash_kexec at ffffffff810e97e8
#2 [ffff880c0fa07da0] panic at ffffffff8174ac9d
#3 [ffff880c0fa07e20] asminline_call at ffffffffa014c895 [hpwdt]
#4 [ffff880c0fa07e40] nmi_handle at ffffffff817598da
#5 [ffff880c0fa07ec0] do_nmi at ffffffff81759b7d
#6 [ffff880c0fa07ef0] end_repeat_nmi at ffffffff81758cf1
[exception RIP: intel_idle+204]
RIP: ffffffff8141006c RSP: ffffffff81c01da8 RFLAGS: 00000046
RAX: 0000000000000010 RBX: 0000000000000010 RCX: 0000000000000046
RDX: ffffffff81c01da8 RSI: 0000000000000018 RDI: 0000000000000001
RBP: ffffffff8141006c R8: ffffffff8141006c R9: 0000000000000018
R10: ffffffff81c01da8 R11: 0000000000000046 R12: ffffffffffffffff
R13: 0000000000000000 R14: ffffffff81c01fd8 R15: 0000000000000000
ORIG_RAX: 0000000000000000 CS: 0010 SS: 0018
--- [NMI exception stack] ---
#7 [ffffffff81c01da8] intel_idle at ffffffff8141006c
#8 [ffffffff81c01de0] cpuidle_enter_state at ffffffff81602a8f
#9 [ffffffff81c01e40] cpuidle_idle_call at ffffffff81602be0
#10 [ffffffff81c01e90] arch_cpu_idle at ffffffff8101e2ce
#11 [ffffffff81c01ea0] cpu_startup_entry at ffffffff810c1818
#12 [ffffffff81c01f10] rest_init at ffffffff8173fc97
#13 [ffffffff81c01f20] start_kernel at ffffffff81d37f7b
#14 [ffffffff81c01f70] x86_64_start_reservations at ffffffff81d375f8
#15 [ffffffff81c01f80] x86_64_start_kernel at ffffffff81d3773e
crash]
2. Execute the dmesg command to view information before the unexpected reboot.
crash] dmesg
...
[10753.155822] sd 3:0:0:1: [sdd] Very big device. Trying to use READ CAPACITY(16).
[10804.115376] sbridge: HANDLING MCE MEMORY ERROR
[10804.115386] CPU 23: Machine Check Exception: 0 Bank 9: cc1bc010000800c0
[10804.115387] TSC 0 ADDR 12422f7000 MISC 90868002800208c PROCESSOR 0:306e4 TIME 1417366012 SOCKET 1 APIC 2b
...
[10804.283467] sbridge: HANDLING MCE MEMORY ERROR
[10804.283473] CPU 9: Machine Check Exception: 0 Bank 9: cc003010000800c0
[10804.283475] TSC 0 ADDR 1242ef7000 MISC 90868000800208c PROCESSOR 0:306e4 TIME 1417366012 SOCKET 1 APIC 26
[10804.303482] EDAC MC1: 28416 CE memory scrubbing error on CPU_SrcID#1_Channel#0_DIMM#0 (channel:0 slot:0 page:0x12422f7 offset:0x0 grain:32 syndrome:0x0 - OVERFLOW area:DRAM err_code:0008:00c0 socket:1 channel_mask:1 rank:0)
[10804.303489] EDAC MC1: 192 CE memory scrubbing error on CPU_SrcID#1_Channel#0_DIMM#0 (channel:0 slot:0 page:0x12424a7 offset:0x0 grain:32
...
[10804.319474] sbridge: HANDLING MCE MEMORY ERROR
[10804.319481] CPU 6: Machine Check Exception: 0 Bank 9: cc001010000800c0
[10804.319482] TSC 0 ADDR 1243087000 MISC 90868002800208c PROCESSOR 0:306e4 TIME 1417366012 SOCKET 1 APIC 20
[10805.303772] EDAC MC1: 64 CE memory scrubbing error on CPU_SrcID#1_Channel#0_DIMM#0 (channel:0 slot:0 page:0x1243087 offset:0x0 grain:32 syndrome:0x0 - OVERFLOW area:DRAM err_code:0008:00c0 socket:1 channel_mask:1 rank:0)
[10813.602696] sd 3:0:0:0: [sdc] Very big device. Trying to use READ CAPACITY(16).
[10813.603219] sd 3:0:0:1: [sdd] Very big device. Trying to use READ CAPACITY(16).
[10840.833238] Kernel panic - not syncing: An NMI occurred, please see the Integrated Management Log for details.
3. View information in the kern.log file.
Nov 30 07:05:01 HBND-UIS-E-CVK09 kernel: [229821.496666] sd 11:0:0:1: [sdd] Very big device. Trying to use READ CAPACITY(16).
Nov 30 07:05:55 HBND-UIS-E-CVK09 kernel: [229875.188854] sbridge: HANDLING MCE MEMORY ERROR
Nov 30 07:05:55 HBND-UIS-E-CVK09 kernel: [229875.188873] CPU 23: Machine Check Exception: 0 Bank 9: cc1e0010000800c0
Nov 30 07:05:55 HBND-UIS-E-CVK09 kernel: [229875.188874] TSC 0 ADDR 10638f7000 MISC 90868002800208c PROCESSOR 0:306e4 TIME 1417302355 SOCKET 1 APIC 2b
...
Nov 30 07:05:55 HBND-UIS-E-CVK09 kernel: [229875.244902] EDAC MC1: 30720 CE memory scrubbing error on CPU_SrcID#1_Channel#0_DIMM#0 (channel:0 slot:0 page:0x10638f7 offset:0x0 grain:32 syndrome:0x0 - OVERFLOW area:DRAM err_code:0008:00c0 socket:1 channel_mask:1 rank:0)
...
root@gzh-139:/vms/issue_logs/hebeinongda/20141201/HBND-UIS-E-CVK09/logdir/var/log# grep OVERFLOW kern* | wc
225 6341 60264
root@gzh-139:/vms/issue_logs/hebeinongda/20141201/HBND-UIS-E-CVK09/logdir/var/log#
// The output information shows that the issue is caused by a memory error. To resolve the issue, replace the memory.
Introduction to KDB
KDB is an interactive kernel debugger, essentially a patch to kernel codes, which allows experts to access kernel memory and data structures. One of the main advantages of KDB is that it does not require another machine for debugging. You can debug the kernel running on the same machine.
In some scenarios, a server reboots unexpectedly without generating any abnormal syslog messages or kdump files. In addition, memory detection cannot detect any memory issues, and even HPE SmartStart cannot detect any issues when it checks the entire server. In this case, turn on the kernel KDB, make sure the system is mounted at the KDB when an unexpected reboot occurs, and then use the KDB to analyze the unexpected reboot.
Configuring the KDB environment
1. Connect the serial port of a server:
a. Use a 9-pin female-to-female RS232 serial cable to connect the serial port of Server A (the server being tested) to the serial port of Server B.
b. Use Minicom on Server B to connect to the serial port of Server A.
Alternatively, you can connect Server A to a PC and use a hyper terminal on the PC to connect to the serial port of Server A.
If a 9-pin female-to-female RS232 serial cable is not available, you must make the cable on site. The following figure shows the pin connections of the cable:

Cross connect at least the two pins for data reception and transmission at both ends. That is, connect pin 2 at this end to pin 3 at the other end, and connect pin 3 at this end to pin 2 at the other end.
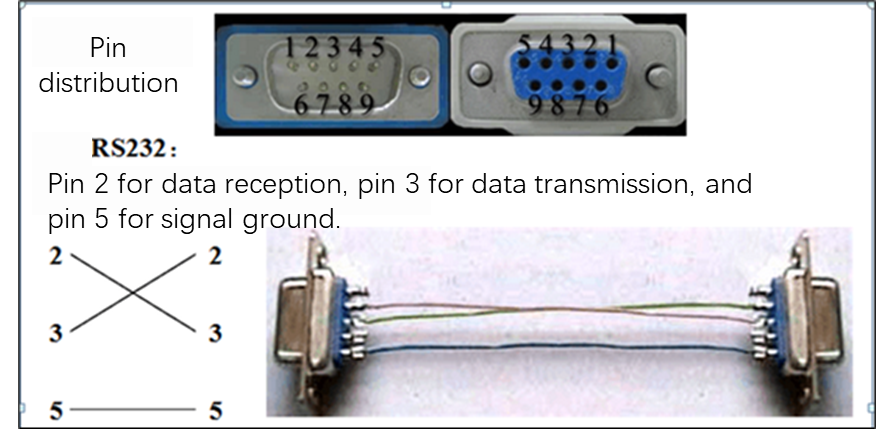
2. On Server B, configure Minicom:
a. Make sure the server can reach the public network.
b. Use the apt-get install minicom command to install Minicom. Alternatively, you can store the following Minicom installation package on the server, and then execute the dpkg –i command to install the package.

c. Log in to Minicom. Execute the minicom command, press Ctrl + A, and then press Z. In the window that opens, press O in upper case to configure Minicom.

d. Select serial port setup and configure the settings as follows:
|
|
IMPORTANT: Change the value of the Hardware Flow Control field to No. Make sure the baud rate is the same as the configuration in the grub.cfg file on the server, which is 115200. |
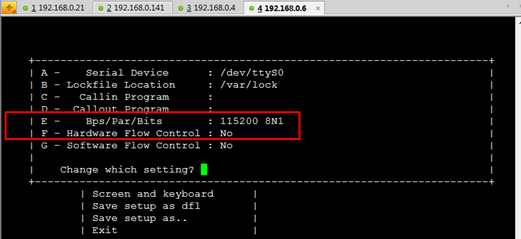
e. Save the settings to a file, for example, _dev_ttyS0.
f. Close the window, and then execute the minicom _dev_ttyS0 command to relog in to Minicom. Alternatively, you can use the minicom /dev/ttys0 command at login.
3. Configure file grub.conf:
a. On Server A, enable KDB and edit start script file grub.conf.
export linux_gfx_mode
if [ "$linux_gfx_mode" != "text" ]; then load_video; fi
menuentry 'Ubuntu, with Linux 3.13.6' --class ubuntu --class gnu-linux --class gnu --class os {
recordfail
gfxmode $linux_gfx_mode
insmod gzio
insmod part_msdos
insmod ext2
set root='(hd0,msdos1)'
search --no-floppy --fs-uuid --set=root 501e46b1-31bc-41ae-9ec2-6a41fe312c29
linux /boot/vmlinuz-3.13.6 root=UUID=501e46b1-31bc-41ae-9ec2-6a41fe312c29 ro console=ttyS0,115200 kgdboc=ttyS0,115200 crashkernel=512M quiet
initrd /boot/initrd.img-3.13.6
}
menuentry 'Ubuntu, with Linux 3.13.6 (recovery mode)' --class ubuntu --class gnu-linux --class gnu --class os {
b. Save the configuration, and then exit the configuration view. For the configuration to take effect, you must restart CVK.
c. Verify that you can view the start information of Server A on the Minicom serial port of Server B. The following shows a sample for the start information:
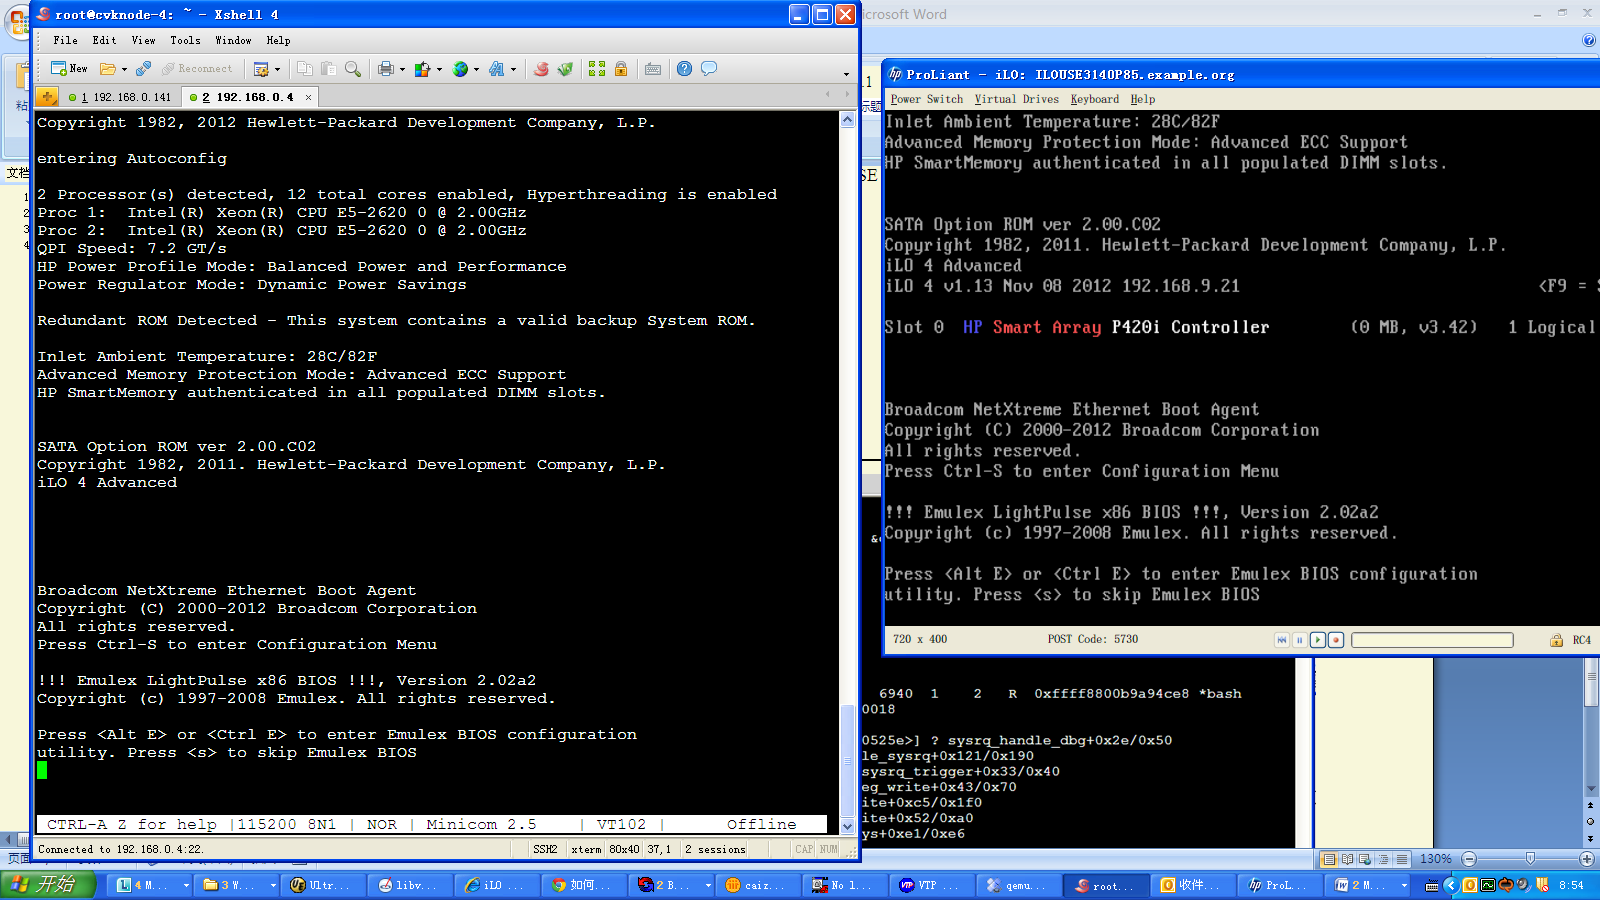
Alternatively, you can execute the echo "Test the minicom channel!" command on Server A to write the message enclosed by the quotation marks to the serial port. If you can view message Test the minicom channel! on the Minicom serial port of Server B, the configuration is correct. If you cannot view the message, the configuration has errors. In this case, you must check and correct the configuration.
Viewing KDB information
With the configuration in "Configuring the KDB environment," once Server A reboots unexpectedly, you can view the stack information generated by KDB on the Minicom interface of Server B. The following provides a sample of the stack information during an unplanned reboot:
Welcome to minicom 2.5
OPTIONS: I18n
Compiled on May 2 2011, 10:05:24.
Port /dev/ttyS0
Press CTRL-A Z for help on special keys
AT = 0x000000000000000a
[19]kdb] AT S7=45 S0=0 L1 V1 X4 &c1 E1 Q0
AT = 0x000000000000000a
[19]kdb]
AT = 0x000000000000000a
[19]kdb] bt
Stack traceback for pid 2579
0xffff880e333c1800 2579 2577 1 19 R 0xffff880e333c1ce8 *ip
ffff880e32931368 0000000000000018 ffffffffa00ab599 0000000000000000
ffffffff00000000 ffffffff00000000 0000000000000010 0000000000000246
ffff880e329313a8 0000000000000018 ffff880e329313b8 ffff880e329313f8
Call Trace:
[[ffffffffa00ab599]] ? bnx2x_panic_dump+0x1f9/0xdb0 [bnx2x]
[[ffffffff8174b867]] ? printk+0x61/0x63
[[ffffffffa00ad603]] ? bnx2x_send_final_clnup+0x163/0x210 [bnx2x]
[[ffffffffa00b470b]] ? bnx2x_igu_clear_sb_gen+0xf8b/0x1380 [bnx2x]
[[ffffffffa01054d7]] ? bnx2x_dcbx_pmf_update+0x31e7/0x8090 [bnx2x]
[[ffffffffa010d5e2]] ? bnx2x_func_state_change+0x102/0x10b0 [bnx2x]
[[ffffffffa00af9e6]] ? bnx2x_fw_command+0x156/0x16c0 [bnx2x]
[[ffffffffa010d43c]] ? bnx2x_init_func_obj+0x9c/0x140 [bnx2x]
[[ffffffffa00eb638]] ? bnx2x_nic_load+0x5e8/0x1e00 [bnx2x]
[[ffffffff8109c987]] ? wake_up_process+0x27/0x50
[[ffffffff81633c78]] ? pci_conf1_write+0xc8/0x110
[[ffffffffa00e7cf7]] ? bnx2x_set_power_state+0xb7/0x170 [bnx2x]
[[ffffffffa00b289a]] ? bnx2x_chk_parity_attn+0x106a/0x1110 [bnx2x]
[[ffffffff816574c7]] ? __dev_open+0xb7/0x130
[[ffffffff816577ec]] ? __dev_change_flags+0xac/0x190
[[ffffffff81657920]] ? dev_change_flags+0x30/0x70
[[ffffffff816f6079]] ? inet6_fill_ifla6_attrs+0x309/0x340
[[ffffffff8166446d]] ? do_setlink+0x25d/0x970
[[ffffffff81665f1e]] ? rtnl_fill_ifinfo+0xa3e/0xc50
[[ffffffff813b1f30]] ? nla_parse+0x30/0xe0
[[ffffffff81666ef9]] ? rtnl_newlink+0x369/0x5b0
[[ffffffff813400b7]] ? apparmor_capable+0x27/0x70
[[ffffffff81666aa5]] ? rtnetlink_rcv_msg+0x165/0x250
[[ffffffff817569c1]] ? __mutex_lock_slowpath+0x1a1/0x1b0
[[ffffffff81645257]] ? __alloc_skb+0x87/0x2a0
[[ffffffff81666940]] ? __rtnl_unlock+0x20/0x20
[[ffffffff81682869]] ? netlink_rcv_skb+0xa9/0xd0
[[ffffffff81663745]] ? rtnetlink_rcv+0x25/0x40
[[ffffffff81681dcb]] ? netlink_uniUISt+0x10b/0x190
[[ffffffff816821ca]] ? netlink_sendmsg+0x37a/0x790
[[ffffffff811b7714]] ? __mem_cgroup_commit_charge+0xb4/0x360
[[ffffffff8163c40f]] ? sock_sendmsg+0xaf/0xc0
[[ffffffff81152fa7]] ? unlock_page+0x27/0x30
[[ffffffff8117c43a]] ? do_wp_page+0x2ca/0x760
[[ffffffff8163c7dc]] ? ___sys_sendmsg+0x3bc/0x3d0
[[ffffffff8175c3f0]] ? __do_page_fault+0x290/0x570
[[ffffffff81114ebc]] ? acct_account_cputime+0x1c/0x20
[[ffffffff8109fc19]] ? account_user_time+0x99/0xb0
[[ffffffff810a029d]] ? vtime_account_user+0x5d/0x70
[[ffffffff8163d5e9]] ? __sys_sendmsg+0x49/0x90
[[ffffffff8163d649]] ? SyS_sendmsg+0x19/0x20
[[ffffffff81760fbf]] ? tracesys+0xe1/0xe6
[19]kdb]
[19]kdb]
[19]kdb]
[19]kdb]
[19]kdb] ep
ep = 0x000000000000000e
[19]kdb]
ep = 0x000000000000000e
[19]kdb] rd
ax: 0000000000000000 bx: ffff880e32624000 cx: ffff880425dc4000
dx: 00000000000001cc si: 00000000000001cc di: 0000000000000246
bp: ffff880e32931478 sp: ffff880e32931368 r8: 0000000000000000
r9: 00000000000001c5 r10: 00000000000009e1 r11: 00000000000009e0
r12: ffff880425dc4880 r13: ffff880e329313d0 r14: 0000000000000000
r15: ffffffffa0145143 ip: ffffffffa00ab6a5 flags: 00010212 cs: 00000010
ss: 00000018 ds: 00000018 es: 00000018 fs: 00000018 gs: 00000018
[19]kdb]
When the system is mounted at the KDB, the RD personnel can further analyze the issue according to the stack information for troubleshooting.
Troubleshooting
Installation issues
Installation being stuck at 21% for a long time
Symptom
At the final stage when you install a CAS package by using the correct method, you must install an additional CAS package. This package is relatively large. If the network speed is slow, it takes a long time to install the package. The installation gets stuck at 21% for a long time.
Solution
When the installation gets stuck at 21%, press Alt + F2 to access the backend and use the ls –lh /target/root command display the size changes of the extras.tar file.
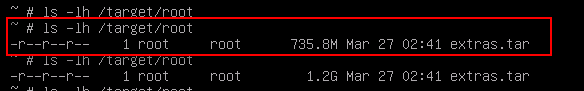
After the system copies the extras.tar file, it decompresses the file and installs the file. After decompression, the following directory appears and the installation becomes fast:
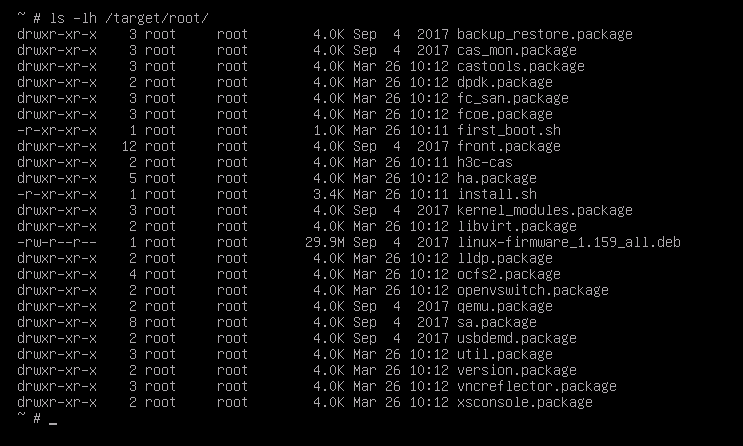
Cannot discover disks during system installation
Symptom
No disks are discovered in the disk detection step, as shown in the following figure:
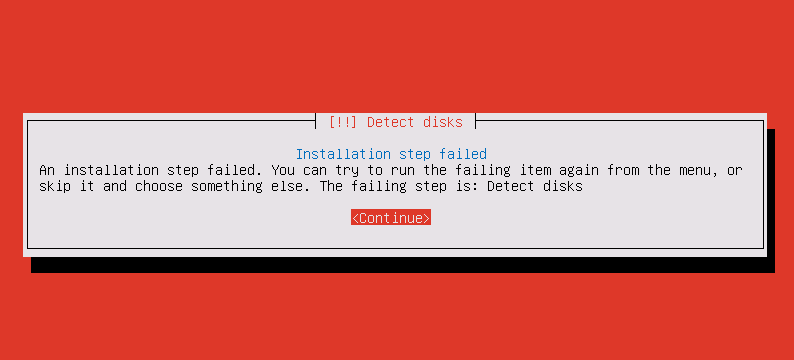
Solution
To resolve this issue:
1. Check the CAS version to identify whether the server is compatible with the version. Typically, new or very old servers are not compatible with the version. If the server is not compatible with the version, use the latest CAS ISO version.
2. If the issue persists, contact the technical support.
Black screen or being stuck during system installation
Symptom
During installation, the screen turns black after the language page or stays stuck on that page. You cannot input any information.
Solution
To resolve this issue:
1. Check the kernel version of the server and identify whether the installed version is compatible with the kernel version of the server:
¡ If the kernel version is new, install an ISO compatible with a new kernel version.
¡ If the kernel version is old, install an ISO compatible with an old kernel version.
¡ Install the Ubuntu16.04/18.04 or Centos 7.5 ISO.
2. Check whether the server has hardware incompatible with the installed version, for example, a FC card. If the server has such hardware, remove the hardware and then install the version again.
Version and kernel compatibility
· E0306 to E0513: 4.1 kernel.
· E0520 to E0530: 4.14.0 kernel.
· E0535- and later: 4.14.131 kernel.
System functions missing after installation
Symptom
After system installation, no blue xsconsole interface is available on the server manager, or some common commands are missing in the backend.
Analysis
Typically, this issue is caused by an interruption when you remotely install an ISO through the server BMC management console. If the network is unstable when you remotely install the ISO through the BMC management console, the server might be disconnected from the BMC management console. The disconnection causes installation errors. If you manually disconnect the server from the BMC management console during installation, the symptom also occurs.
Solution
Reinstall the ISO.
Analysis and detection of blocking issues in OCFS2
Symptom
When you select the storage pool tab for CVK on the CAS management console, you cannot refresh the page. As a result, the CAS management console gets blocked. You cannot refresh the page, either, when selecting some other tabs. Some CVK servers turn red and cannot be managed. Alternatively, the entire CAS management console cannot respond to management and configuration operations.
Analysis
This issue might be caused by the following reasons:
· Web server blocking.
· Backend VM manager blocking.
· Shared file system blocking.
To identify the blocked location, use the ocfs2_kernel_stat_collect.sh script and analyze the blocked stack information in the log files stored in the directory of /var/log/host-name.
Solution
Exclude related factors one by one.
Troubleshooting Tomcat
1. In the address bar of the Web browser, enter the CVM address and log in to the CVM. Verify that the login succeeds.
2. Use SSH to access the backend of the CVM server and check whether error stack messages exist in Tomcat log files stored in the directory of /var/log/tomcat6.
3. Use the service tomcat restart or service tomcat6 restart command to restart the Tomcat service.
4. Log in to the CVM management console again, and check whether Tomcat is in normal state.
Troubleshooting blocking at the virtualization management layer
1. Locate the blocked CVK, use SSH to access the backend of the CVK, and then execute the virsh list and virsh pool-list commands to check whether the CVK can respond to the commands correctly.
¡ If yes, the virtualization management layer is running correctly.
¡ If not, go to the next step.
2. Analyze logs in the libvirtd.log file at the directory of /var/log/libvirt to identify whether errors have occurred.
3. Use the service libvirt-bin restart command to restart the virtualization management layer of the CVK.
4. Verify that the virtualization management layer of the CVK is running correctly. If not, check the storage.
Troubleshooting the shared file system or storage
Blocking of the shared file system can cause blocking at the virtualization layer, which in turn results in blocking at the CAS management layer.
To resolve the blocking issue of the storage layer on a CVK, restart that CVK. In some cases, you must forcibly shut down and start up the CVK.
Procedure:
1. Use the df –h command to check whether you can correctly access each mount point attached to the storage pool.
If it takes a long time for the system to respond to the df –h command, the shared file system gets blocked.
2. Use the mount | grep ocfs2 command to check the shared file system in use.
root@B12-R390-FC-06:~# mount |grep ocfs2
ocfs2_dlmfs on /dlm type ocfs2_dlmfs (rw)
/dev/sdj on /vms/IPsan-St-002 type ocfs2 (rw,_netdev,heartbeat=local)
/dev/sdm on /vms/VM_BackUp type ocfs2 (rw,_netdev,heartbeat=local)
/dev/dm-0 on /vms/FC-St type ocfs2 (rw,_netdev,heartbeat=local)
/dev/sdk on /vms/IPsan-St-001 type ocfs2 (rw,_netdev,heartbeat=local)
/dev/sdl on /vms/ISO_POOL type ocfs2 (rw,_netdev,heartbeat=local)
3. Use the debugfs.ocfs2 -R "fs_locks -B" command to check whether each disk has blocked locks.
The following output shows that disks sdb and sde are not blocked and disk sdc has three blocked DLM locks.
root@ZJ-WZDX-313-B11-R390-IP-07:~# mount |grep ocfs2
ocfs2_dlmfs on /dlm type ocfs2_dlmfs (rw)
/dev/sdb on /vms/IPsan-St-002 type ocfs2 (rw,_netdev,heartbeat=local)
/dev/sde on /vms/VM_BackUp type ocfs2 (rw,_netdev,heartbeat=local)
/dev/sdc on /vms/IPsan-St-001 type ocfs2 (rw,_netdev,heartbeat=local)
/dev/sdd on /vms/ISO_POOL type ocfs2 (rw,_netdev,heartbeat=local)
root@ZJ-WZDX-313-B11-R390-IP-07:~# debugfs.ocfs2 -R "fs_locks -B" /dev/sdb
root@ZJ-WZDX-313-B11-R390-IP-07:~# debugfs.ocfs2 -R "fs_locks -B" /dev/sde
root@ZJ-WZDX-313-B11-R390-IP-07:~# debugfs.ocfs2 -R "fs_locks -B" /dev/sdc
Lockres: P000000000000000000000000000000 Mode: No Lock
Flags: Initialized Attached Busy Needs Refresh
RO Holders: 0 EX Holders: 0
Pending Action: Convert Pending Unlock Action: None
Requested Mode: Exclusive Blocking Mode: No Lock
PR > Gets: 0 Fails: 0 Waits (usec) Total: 0 Max: 0
EX > Gets: 13805 Fails: 0 Waits (usec) Total: 8934764 Max: 5
Disk Refreshes: 0
Lockres: M000000000000000000020737820a41 Mode: No Lock
Flags: Initialized Attached Busy
RO Holders: 0 EX Holders: 0
Pending Action: Convert Pending Unlock Action: None
Requested Mode: Protected Read Blocking Mode: No Lock
PR > Gets: 2192274 Fails: 0 Waits (usec) Total: 15332879 Max: 1784
EX > Gets: 2 Fails: 0 Waits (usec) Total: 5714 Max: 3
Disk Refreshes: 1
Lockres: M000000000000000000020137820a41 Mode: No Lock
Flags: Initialized Attached Busy
RO Holders: 0 EX Holders: 0
Pending Action: Convert Pending Unlock Action: None
Requested Mode: Protected Read Blocking Mode: No Lock
PR > Gets: 851468 Fails: 0 Waits (usec) Total: 409746 Max: 8
EX > Gets: 3 Fails: 0 Waits (usec) Total: 6676 Max: 3
Disk Refreshes: 0
4. Obtain the usage information of each blocked DLM lock, and obtain the corresponding usage on the owner node:
a. Obtain the information of a DLM lock and find that its owner node number is 5.
root@ZJ-WZDX-313-B11-R390-IP-07:~# debugfs.ocfs2 -R "dlm_locks P000000000000000000000000000000" /dev/sdc
Lockres: P000000000000000000000000000000 Owner: 5 State: 0x0
Last Used: 0 ASTs Reserved: 0 Inflight: 0 Migration Pending: No
Refs: 3 Locks: 1 On Lists: None
Reference Map:
Lock-Queue Node Level Conv Cookie Refs AST BAST Pending-Action
Converting 10 NL EX 10:1260
b. Access the /etc/ocfs2/cluster.conf file to find the node with number 5.
c. Use SSH to access the node, and then use the DLM query command to display the usage of the lock on each DLM node. The output information shows that DLM node 7 is holding the lock. Other DLM nodes cannot use the lock.
root@ZJ-WZDX-313-B12-R390-FC-05:~# debugfs.ocfs2 -R "dlm_locks P000000000000000000000000000000" /dev/sdk
Lockres: P000000000000000000000000000000 Owner: 5 State: 0x0
Last Used: 0 ASTs Reserved: 0 Inflight: 0 Migration Pending: No
Refs: 12 Locks: 10 On Lists: None
Reference Map: 1 2 3 4 6 7 8 9 10
Lock-Queue Node Level Conv Cookie Refs AST BAST Pending-Action
Granted 7 EX -1 7:1446 2 No No None
Converting 4 NL EX 4:1443 2 No No None
Converting 2 NL EX 2:1438 2 No No None
Converting 8 NL EX 8:1442 2 No No None
Converting 6 NL EX 6:1441 2 No No None
Converting 3 NL EX 3:1438 2 No No None
Converting 1 NL EX 1:1442 2 No No None
Converting 10 NL EX 10:1260 2 No No None
Converting 5 NL EX 5:1442 2 No No None
Converting 9 NL EX 9:1259 2 No No None
5. On the nodes that are holding the blocked DLM locks, for example, DLM node 7, use the following command to display blocked processes:
|
|
IMPORTANT: In some cases, you can use the kill -9 command to kill the blocked processes to resolve the blocking issue. |
ps -e -o pid,stat,comm,wchan=WIDE-WCHAN-COLUMN | grep D
PID STAT COMMAND WIDE-WCHAN-COLUMN
22299 S< o2hb-C12DDF3DE7 msleep_interruptible
27904 D+ dd ocfs2_cluster_lock.isra.30
6. Use the cat /proc/22299/stack or cat /proc/27904/stack command to display stack information about the specified process.
7. Collect the information in the previous steps and send the information and syslog messages to the CAS R&D team after the system recovers.
To resolve the storage blocking issue for a CVK server, you must reboot that CVK server. To reboot the CVK server:
1. On the node where the blocking issue exists, use the ps -ef |grep kvm command to display all VMs running on the CVK server. Obtain all VM processes in the backend, and record the VNC port of each VM.
2. If possible, shut down the VMs from inside if you use the VNC or a remote desktop to access the VMs.
3. For VM that cannot be shut down, use the kill -9 pid command to forcibly close their processes.
4. Use the reboot command to reboot the abnormal CVK.
If the reboot fails, you must log in to the CVK management interface through the iLo port, and select to reboot the server in secure mode or reset to reboot the server.
5. Veify that the system recovers from the issue.
After CAS 3.0, you can use the ocfs2_kernel_stat_collect.sh script to obtain all blocking states in one execution. One execution generates one file in the /var/log/ directory. This script encapsulates all the query actions related to debugfs.ocfs2 in this section, simplifying the query process. The file name is in the format of hostname_ocfs2_kernel_state_20170XXXXXXX.log.
Libvirt and QEMU blocking
Libvirt blocking
Libvirt blocking events are divided into the following categories:
· Libvirt main process blocking.
· Module blocking in Libvirt, for example, VM, storage pool driver, and network nwfilter driver blocking.
Libvirt main process blocking
Symptom
The connection between the CVM and Libvirt is disconnected for a host. The host cannot operate correctly. You cannot perform any operations on the host, including VM-related operations on the CVM, storage pool start, pause, and refresh operations, and network-related operations.
Executing any virsh command causes blocking on the abnormal CVK.
Exceptions occur on other modules that interact with the Libvirt service, for example, the HA module and the storage FSM component.
Analysis
This issue might be caused by the following reasons:
· In versions earlier than E0520, an unreasonable timer mechanism causes VM startup and shutdown storms. As a result, the Libvirt main process gets stuck.
· An exception occurs on the QEMU process of a VM. The Libvirt main process is waiting for feedbacks from the QEMU process. As a result, the Libvirt main process is blocked.
· Libvirt code bugs.
Module blocking in Libvirt
Symptom
On the CVM, some functions cannot operate correctly or become inaccessible for a CVK. For example, the icons of VMs turn blue and the VMs become inoperable, you cannot refresh storage pools or the storage management page gets stuck and blocked, and other functions related to the affected VMs and storage pools are blocked.
Executing certain virsh commands causes blocking on the abnormal CVK.
Exceptions occur on other modules that interact with the abnormal CVK, for example, the HAS module and the storage FSM component.
Analysis
This issue might be caused by the following reasons:
· Storage pool exception. Common storage pool exceptions include OCFS2 shared file system exceptions and NFS storage pool server-end exceptions.
· VM QEMU process exception, which causes the Libvirt layer of the affected VM unable to interact with QEMU. For more information, see "QEMU blocking."
· Code bugs in the corresponding modules of Libvirt.
Solution
To resolve this issue, you must first identify the blocking category and resolve the issue according to the blocking category.
For Libvirt main process blocking:
· The issue probably is a known issue if the version is earlier than E0520 and bulk VM startup and shutdown operations are performed.
· If the version is E0520 or later, check whether VMs have exceptions on the CVK. If exceptions exist on a VM, analyze the QEMU process of that VM:
a. Use the ps aux | grep vm-name command to check whether the process is in correct state. If the state is D or Z, the process is not in correct state.
b. Use the top –c –H –p vm-process-pid command to check whether the CPU usage and memory usage of the threads under the process are too high.
c. If the issue persists, use the gdb attach 'pidof libvirtd' <<< "thread apply all bt"> /root/libvirtd.bt command to collect Libvirt process stack information, and send the information to the R&D team for analysis.
For module blocking in Libvirt, identify which module has the issue and resolve the issue accordingly:
· On the abnormal CVK, a storage pool exception occurs if the system responds to the virsh list command but gets blocked when executing the virsh pool-list command. To resolve the issue in this case:
a. Check the storage-related log files with the syslog and ocfs2 prefixes in the /var/log directory to identify whether an exception occurs on the OCFS2 shared file system.
b. Check the XML file of each storage pool in the /etc/libvirt/storage directory to identify whether NFS storage pool exist. If an NFS storage pool exists, use the server IP address in the XML file of that storage pool to check whether the server is running correctly.
· On the abnormal CVK, a VM exception occurs if the system responds to the virsh pool-list command but gets blocked when executing the virsh list command. For more information, see the methods used to troubleshoot VMs.
· On the abnormal CVK, an exception exists on the nwfilter module if the system gets stuck when executing the virsh nwfilter-list command. In this case, collect Libvirtd process stack information and send the information to the R&D team for analysis.
If you cannot identify the reason causing the issue, collect and send log messages to the R&D team for analysis:
1. On the CVM, collect logs.
2. Use the gcore –o /vms/libvirtd 'pidof libvirtd' command to generate a core dump file for the Libvirt process. File /vms/libvirtd*** will be generated after command execution.
Recovery method
After the issue is resolved, restart the Libvirt service. Make sure no VM names contain Chinese characters.
QEMU blocking
The majority blocking events of QEMU processes only affects a single VM. Typically, they are related to the configuration of the VM.
Symptom
On the VM, services stop or run slowly, or operation delays occur.
On the CVM, the icon of the VM becomes blue. You cannot edit the VM, access the VM through the VNC console, or ping the VM.
Analysis
The issue might be caused by the following reasons:
· An exception occurs in the storage pool where the VM disks reside. The exception causes the kernel layer failing to respond to the disk read and write operations. However, the QEMU main process is continuously waiting for the response from the kernel layer.
· The VM has anti-virus software installed, and an exception occurs on the backend driver of the anti-virus module (software installed on the CVK by the anti-virus vendor). The exception causes the QEMU process to continuously wait for the response from the kernel layer.
· Typically, a cloud desktop environment uses the spice component. The component requires the cooperation of the QEMU process on the VM. If the component is abnormal, the QEMU call might never end, which leads to blocking.
· VM disk rate is limited during online storage migration, causing internal services of the VM to run slowly. This situation is normal.
· Typically, the total size of VM disks is several terabytes. Some internal services on the VM are prone to disk fragmentation. When the fragmentation rate reaches 50% or higher, snapshot operations will cause internal delays. This is a flaw inherent to the QCOW2 disk format.
· Exceptions occur on other devices installed on the VM, for example, on a USB device.
Solution
To resolve this issue:
1. Check the ongoing operations on the VM.
¡ If the VM is performing online storage migration, it is normal that the internal services on the VM run slowly.
¡ If the VM is creating a snapshot or using a snapshot to restore the configuration, and the VM disk size is several terabytes, use the qemu-img check vm-disk-absolute-path command to check the fragmented field. If the fragmentation rate is 50% or higher, the issue is a flaw in the QCOW2 disk format. We will optimize the issue in the future.
¡ In other situations, handle the issue according to the actual situations.
2. Use the virsh dumpxml vm-name command to display VM configuration in running state and find whether the VM has settings that are not commonly used.
For example:
¡ If a shmem label is available, anti-virus is enabled on the VM.
¡ If a USB label is available, identify whether a USB device is attached to the VM, for example, U key, USB drive, or removable hard disk.
¡ If a hostdev label is available, identify whether a passthrough device exists.
3. View VM QEMU logs in file vm-name.log at the directory of /var/log/libvirt/qemu/ to check for error messages before and after the abnormal time point to get a preliminary understanding of which hardware might have caused the issue.
For example:
¡ If errors exist in disk read and write operations, check the CVK syslogs and the storage-related logs.
¡ If the spice component has errors, analyze the cloud desktop-related modules.
4. If the VM QEMU logs are correct, check the QEMU process state.
¡ Use the ps aux | grep vm-name command to display the running processes of the VM and check whether the processes are in D or Z state.
¡ Use the top –c –H –p vm-qemu-process-pid to check whether the CPU usage and memory usage of the specified process are abnormal.
¡ Use the cat /proc/vm-qemu-process-pid/stack command to display the process stack.
5. If the issue persists, collect the following information and send the information to the technical support:
¡ Logs collected on the CVM.
¡ VM QEMU process state information. To collect the information, use the methods in step 4.
¡ VM QEMU process stack.
¡ Information collected by using the find /proc/vm-qemu-process-pid/task/ -name stack | xargs grep . command. The command has a dot (.) behind grep.
Troubleshooting network issues and capturing packets
Capturing packets can intercept data transmitted over a network, obtaining the most primitive packet interaction information. If a service anomaly occurs and is suspiciously caused by a network problem, you can troubleshoot the issue by capturing packets. This document introduces commonly used packet-capturing tools and briefly explains the steps for capturing packets.
A packet capture tool in Windows environment
In a Windows environment, Wireshark is commonly used to capture and analyze network traffic. Wireshark is a free and open-source tool, which can be installed within a Windows VM to help effectively analyze network issues.
Steps to capture packets using Wireshark:
1. Install and open Wireshark, select the Capture > Options menu item.
![]()
2. In the Wireshark Capture Options dialog box that opens, select the NIC for capturing packets by either interface name or corresponding IP address, and then click Start.
3. After capturing enough data packets, select the Capture > Stop menu item.
4. Select File > Save menu item to save the captured packets to a specific file.
Open the capture file in Wireshark as follows:
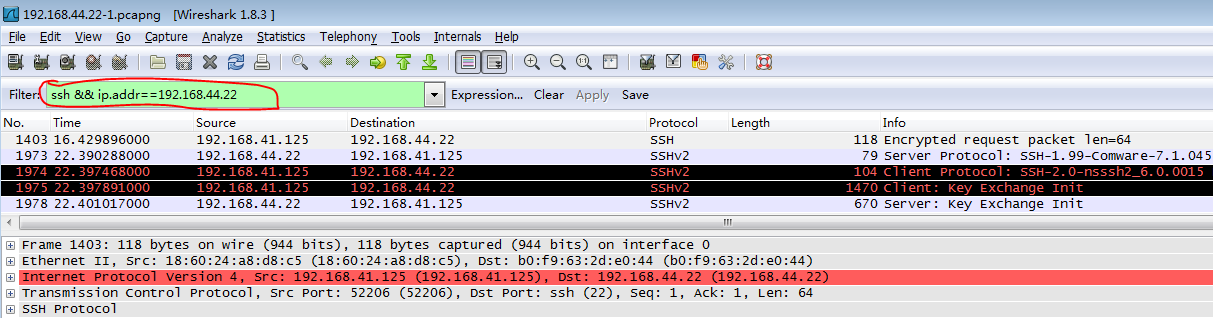
You can use expressions in the Filter input box to extract matching packets, improving packet analysis efficiency.
For more information about using Wireshark and methods for data analysis, refer to the official Wireshark documentation at https://www.wireshark.org/docs/
A packet capture tool in Linux environment
In a Linux environment, tcpdump is commonly used to capture and analyze network traffic.
Example usage of tcpdump:
Usage: tcpdump [-aAbdDefhHIKlLnNOpqRStuUvxX#] [ -B size ] [ -c count ]
[ -C file_size ] [ -E algo:secret ] [ -F file ] [ -G seconds ]
[ -i interface ] [ -M secret ] [ --number ]
[ -Q in|out|inout ]
[ -r file ] [ -s snaplen ] [ -T type ] [ --version ] [ -V file ]
[ -w file ] [ -W filecount ] [ -y datalinktype ] [ -z command ]
[ -Z user ] [ expression ]
Common parameters description (case-sensitive):
Use -s to set the packet capture length for data packets. If -s equals 0, it means automatically selecting the appropriate length to capture the data packets.
· Use -w to save packet capture results to a file instead of analyzing and printing output on the console.
· Use -i to specify the interface (NIC) that needs to be monitored.
· Use -vvv to output detailed interaction data.
· Use -e to print on the console the header information of the link layer in a packet, including source MAC, destination MAC, and network layer protocol.
· Use -n to display the data packets after translating domain name addresses to IP addresses.
· Use -r to read data packet information from the specified file.
· Use -Q to specify capturing packets from the incoming or outgoing direction of the monitored interface (NIC).
· Use expression to specify a regular expression to filter packets. The expressions mainly include the following types:
¡ Keywords for the specified types, including host, net, and port.
¡ Keywords for specifying transmission orientation: src (source), dst (destination), dst or src (source or destination), and dst and src (source and destination).
¡ Keywords for specified protocols, including ICMP, IP, ARP, RARP, TCP, and UDP.
For more information and instructions on using additional tcpdump parameters, refer to the manpage of tcpdump at http://www.tcpdump.org/manpages/tcpdump.1.html.
Reference for commonly used tcpdump packet capture commands:
· Capture all packets with IP address 10.99.207.130 on port eth0 and print their layer 2 information.
tcpdump -i eth0 -ne host 10.99.207.130
· Capture outgoing packets with IP address 10.99.207.130 on vswitch0. (This command won't capture incoming packets received on vswitch0.)
tcpdump -i vswitch0 host 10.99.207.130 -Q out
· Capture DHCP interaction packets on vnet2.
tcpdump -i vnet2 -ne udp and port 67 and port 68
· Capture ping packets on eth0.
tcpdump -i eth0 –ne icmp
· Capture packets with source MAC 60:da:83:0c:7f:e9 on eth0.
tcpdump -i eth0 -ne ether src 60:da:83:0c:7f:e9
· Capture packets with protocol number of 0x88cc (LLDP) on eth0.
tcpdump -i eth0 ether proto 0x88cc
· Capture packets with source IP 10.99.207.130 and destination IP 10.99.190.54 on eth0.
tcpdump -i eth0 -ne src 10.99.207.130 and dst 10.99.190.54
· Capture packets with IP address 10.99.190.53 and port 22 (SSH) on eth0.
tcpdump -i eth0 -ne port 22 and host 10.99.190.53
· Capture packets on eth0 and save them to file /home/eth0.pcap.
tcpdump -i eth0 -w /home/eth0.pcap
The previous commands are common tcpdump commands for reference. To filter packets, you might need to use proper parameter combinations based on the on-site issues.
Introduction to packet processing in CAS environment
If a network service issue occurs, you can use a packet capture tool to capture packets on each port of the packet forwarding path to find the specific location where packets are being discarded, and then analyze the root cause of the issue.
The following diagram is a typical network scenario in a CAS virtualization environment, where a virtual machine (VM) is the source end.
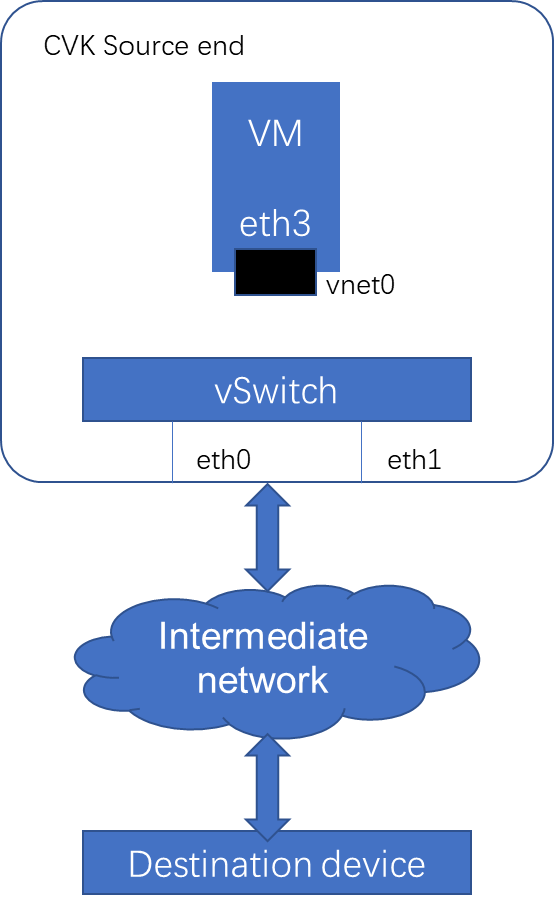
1. The VM on CVK initiates a request as the source, and sends the request packet out of the internal port eth3 of the VM.
2. The virtualization layer forwards the packet to interface vnet0. OVS matches the packet with the flow table and then forwards it based on the matching rule. In this example, the packet is forwarded to the physical network interface. As aggregation is configured on the virtual switch (vSwitch), the packet will be forwarded to the corresponding physical network interface based on the aggregation's hash rule and transmitted out of the CVK.
3. The packet passes through intermediate devices (switches, gateways, or firewalls) and reaches the destination device (which could be CVK, VM, or other devices including a public network server).
4. The destination device will respond and transmit a response packet upon receiving the request packet.
5. The response packet passes through the intermediate network and returns to the physical NIC of CVK, and then enters OVS. OVS matches the flow table rules and forwards the packet accordingly. In this case, the packet will be forwarded to vnet0.
6. The virtualization layer forwards the packet to the internal interface eth3 of the VM to complete this network communication interaction.
Capture request packets on the internal NIC of the VM
Capture packets on the internal NIC of the VM (refer to the packet capture instructions previously introduced) and check if the source has sent the request packets.
If a request packet has not been sent, it might be due to the following reasons:
· Verify that the service programs running inside the VM are functioning properly.
· Check the network configuration inside the VM, and verify if the packet has been transmitted from another NIC.
· Check whether a security policy is applied within the VM, for example, enabling iptables and intercepting network packets.
· Other reasons.
If the request packet has been transmitted, move on to the next step.
Capture request packets on the vnet port of CVK
Use tcpdump commands on CVK to capture packets on the vnet port corresponding to the virtual NIC of the VM. Check if vnet forwarding is working properly. Follow these steps:
Execute the /opt/bin/ovs_dbg_listports command at the CLI of CVK. This command can list all the currently running VMs and their corresponding vnet ports.
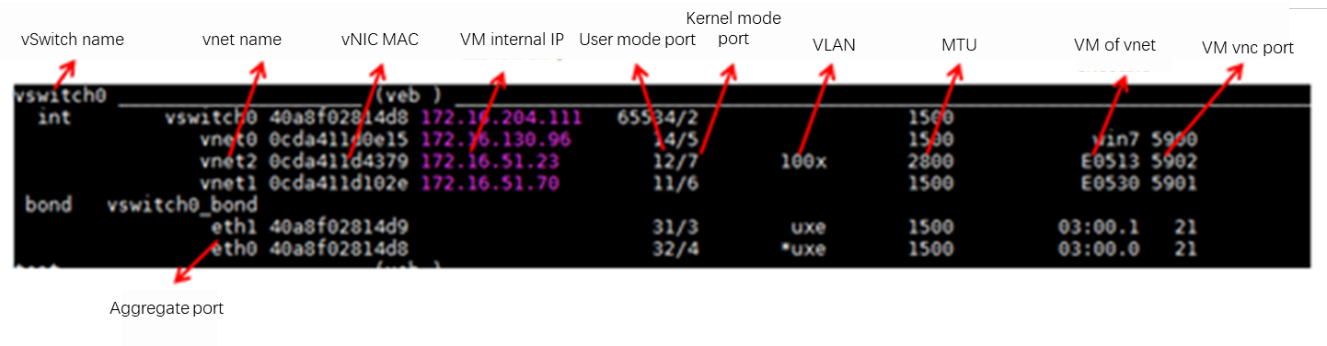
Use the MAC address of the NIC to locate the corresponding vnet port on CVK, transmit the packet to the vnet and check if the packet is sent out of the vnet successfully.
If the request packet is not sent out of the vnet, it might be due to the following reasons:
· Check if antivirus software is installed.
· Check the status of the vnet port by using ovs-vsctl list interface vnetx command.
· Check if any mistakes have occurred in the virtualization layer.
· Other reasons.
If the request packet has been sent out, move on to the next step.
Capture request packets on the physical port of CVK
Use tcpdump commands on CVK to capture packets from the physical network interface bound to the vSwitch. Check if the forwarding of the physical interface is normal.
When the vSwitch is configured with aggregation, special requirements need to be met for packet capture.
· If static link aggregation with active/standby LB is configured on the vSwitch, capture packets on the primary link.
· If a different type of aggregation is configured on the vSwitch, packets need to be captured on all physical interfaces. It is normal for the packet to be sent from any NIC.
You can use the command ovs-appctl bond/show to view the aggregation configuration information.

If the request packet has not been sent from eth, it might be due to the following reasons:
· Check if the packet has been discarded by an OVS flow rule. To check this, view whether the VNET port has the related ACL rule configured.
· Check if CVK has configured with a security policy, such as iptables, that discards the packet.
· Other reasons.
If the request packet has already been sent from eth, the following issues should also be considered:
· Verify that the VLAN tag in the packet is correct.
· Verify that the vSwitch has successfully negotiated the aggregation.
· Check if there is any error message about the NIC driver in the syslog.
If no such issues exist, the packet has been sent out of the vSwitch and entered the intermediate network. Proceed to the next step of analysis.
Capture response packets on physical interfaces of CVK
The process of capturing response packets is the same as capturing request packets on the physical interfaces of CVK previously described. If the vSwitch is configured with aggregation, the following requirements should be met:
· If static link aggregation with active/standby LB is configured on the vSwitch, capture packets on the primary link.
· If a different type of aggregation is configured on the vSwitch, packets need to be captured on all physical interfaces. It is normal for the packet to be received on any NIC.
If no response packet is captured on the physical NICs, it indicates that the network problem occurs outside the CVK. Check the following:
· Check the switch configuration: VLANs and aggregation.
· Verify that the physical NICs are connected to the correct switch.
· Verify that the gateway configuration in the intermediate network is correct and packets are being forwarded correctly.
· Check if security devices, such as firewalls, are deployed in the intermediate network and if the security devices have intercepted the packets for security purposes.
· The destination end did not receive or transmit a response packet. In this case, capture and analyze packets on the destination end.
· Other reasons.
If a response packet is captured on a physical NIC, proceed to the next step of analysis.
Capture the response packet on the vnet interface of CVK
The process of capturing response packets is the same as capturing request packets on the vnet of CVK.
If no response packet is captured on the vnet interface, possible reasons might include the following:
· The VLAN tag of the packet does not match the VLAN of the vnet.
· The packet has been discarded by an ovs flow rule. To check this, view whether the vnet interface has the related ACL rule configured.
· View the MAC table of OVS: Check for possible issues with the MAC table of the vSwitch by executing ovs-appctl fdb/show vswitch_name.
· Other reasons.
If a response packet is captured on the vnet interface, proceed to the next step of analysis.
Capture response packets on the internal NIC of the VM
The process of capturing response packets is the same as capturing request packets on the internal NIC of the VM.
Possible reasons for not capturing response packets on the VM's internal NIC include:
· Check if the NIC state is normal and if there is any error message about NIC drivers in the VM logs.
· Check if there is a continuous increase in TX drop statistics on the corresponding vnet by using the ifconfig vnet command. If the continuous increase of TX drops occurs, it may be due to the delayed packet reception within the VM, causing packet accumulation and loss on the vnet.
· Other issues.
Typical case analysis
Locating IP conflict issues
Symptom
1. An anomaly was detected on a host (172.16.51.23) on CVM, with all services on the host being normal. However, CAS log on the CVM showed a connection failure to the host: 2019-05-27 17:40:48 [ERROR] [pool-3-thread-373] [com.virtual.plat.server.vm.vmm.SshHostTool::queryHardwareInfo] connect host error: Host 172.16.51.23 connection error.
2. When connecting to 172.16.51.23 from a PC through SSH, an error occurs, stating incorrect password despite correct password input.
Analysis
The SSH request from the PC follows this path: PC NIC > intermediate network > CVK's eth > CVK's vSwitch0.
The SSH response from CVK follows this path: CVK's vSwitch0 > CVK's eth > intermediate network > PC NIC.
Enable packet capture on PC's NIC and CVK’s vSwitch0. Initiate an SSH request on the PC, and then analyze captured packet, as follows:
The request packet on the PC:
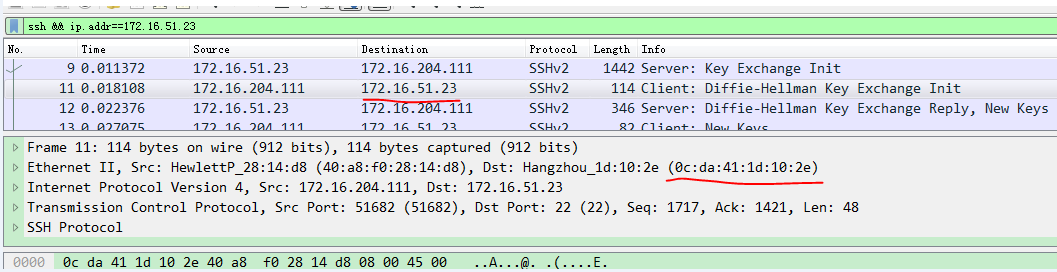
The packet shows that the MAC address for 172.16.51.23 is 0c:da:41:1d:10:2e.
No request packet is captured on CVK. The MAC address for vSwitch0 on CVK is 0c:da:41:1d:43:79 and the IP address is 172.16.51.23.
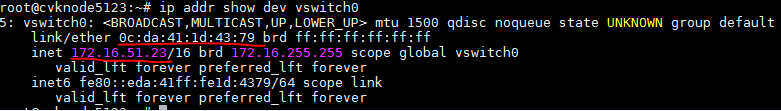
The previous analysis revealed that two devices in the local area network were configured with the same IP address (172.16.51.23), resulting in an IP address conflict.
Packet loss issues caused by LLDP
Symptom
At a site using the CAS platform, it was found that ping from the server (192.168.12.19) to the switch (192.168.12.254) was normal, but ping from the switch (192.168.12.254) to the server (192.168.12.19) was sometimes unsuccessful.
Networking
The on-site network setup is as follows:
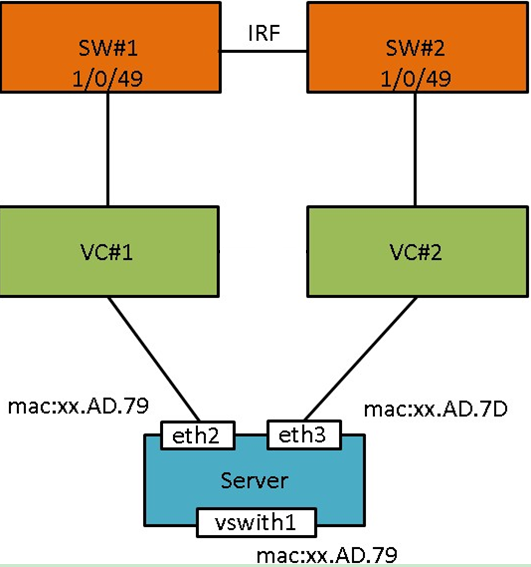
A UIS blade server was used on site, with VC devices as the network interconnecting modules. Eth2 and eth3 of the blade server were connected to VC#1 and VC#2 respectively, which were then connected to switches SW#1 and SW#2. SW#1 and SW#2 were stacked using IRF.
Install a CAS system on the blade server, bind vSwitch1 to eth2 and eth3, and configure static link aggregation with active/standby load balancing. Enable LLDP on both eth2 and eth3.
The IP address of vSwitch1 is 192.168.12.19, with a gateway of 192.168.12.254 configured on the physical switch.
The server (192.168.12.19) can ping the switch (192.168.12.254) successfully, but there is an intermittent connection issue when the switch (192.168.12.254) pings the server (192.168.12.19).
Analysis
Further testing at the site shows that when eth2 acts as the primary NIC, both the CVK host (192.168.12.19) to gateway (192.168.12.254) ping and the gateway to CVK host ping are successful. The gateway to host ping will experience packet loss only when the primary link is eth3.
So, the focal point is analyzing the packet forwarding situation of eth3 as the primary link:
The flow of the packet from the CVK host (192.168.12.19) to the gateway (192.168.12.254) is vSwitch1 > eth3 > VC#2 > SW#2.
The vSwitch1’s MAC address FC:15:B4:1C:AD:79 will be recorded on the downlink ports of VC#2 and SW#2.
The gateway (192.168.12.254) forwards packets to the CVK host (192.168.12.19) based on the MAC address entries on the SW#2 and VC#2 The flow is SW#2 > VC#2 > eth3 > vSwitch1.
Execute tcpdump commands to capture packets on NIC eth2 and save the packets:
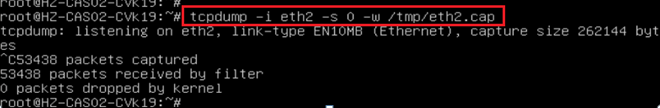
Save the packets to the local PC, and then analyze the packets by using Wireshark. Wireshark finds out that despite eth2 being the backup link, it keeps transmitting LLDP_multicast packets (as LLDP is enabled on eth2). Packet information is as follows:
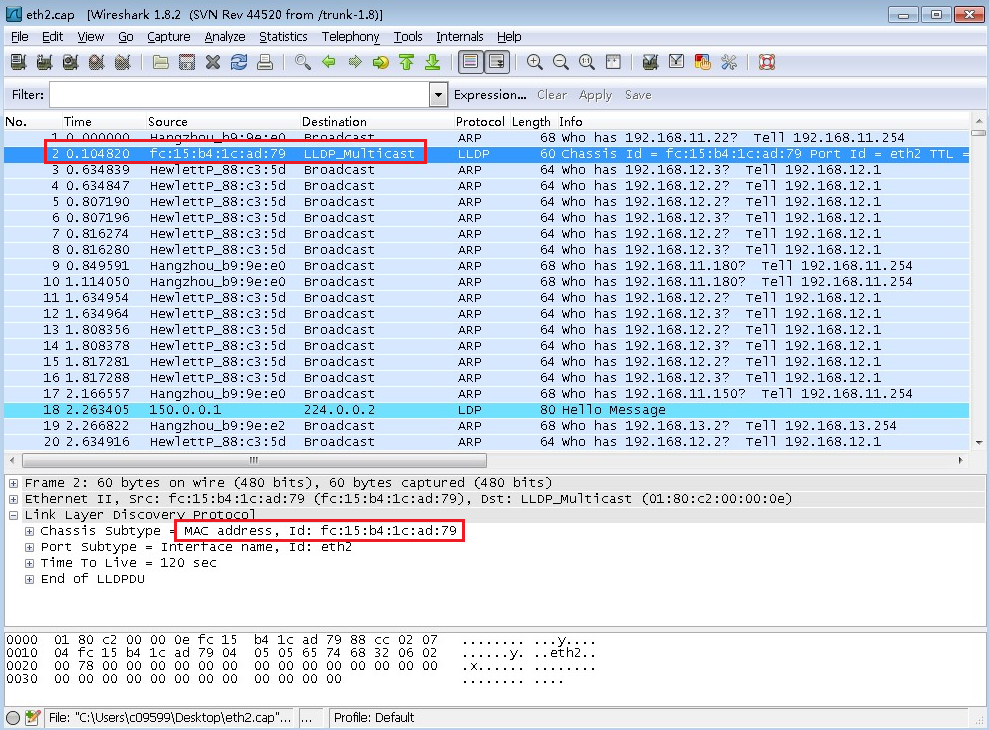
The MAC address of the LLDP multicast packet is FC:15:B4:1C:AD:79.
When eth3 is the primary link, the MAC address of sSwitch1 (FC:15:B4:1C:AD:79) should be learned by SW#2 and VC#2. However, eth2 (also with MAC FC:15:B4:1C:AD:79) sends LLDP_multicast packets periodically, affecting the MAC table entries on VC#1, causing MAC FC:15:B4:1C:AD:79 to move to VC#1 and SW#1. When the gateway pings the host, the packet passes through SW#1 > VC#1 > eth2, where eth2 is in standby state and does not process the packet. As a result, OVS discards the packet, making the ping fail.
Solution
Disable LLDP on the physical NIC. The environment restores to normal.
The related restriction has been added to subsequent versions of the CAS.
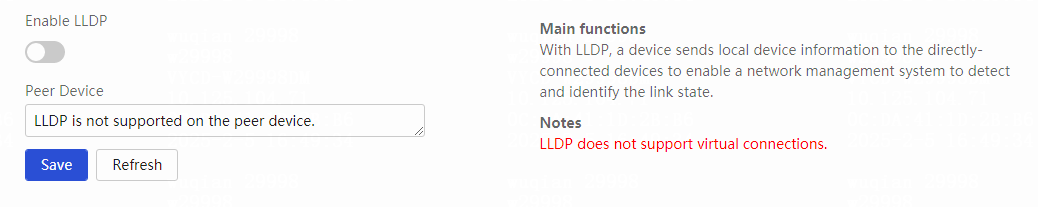
ACL packets discarding
Symptom
At a certain site that uses the CAS platform, VMs can access other addresses, but cannot access the gateway address (172.16.51.6).
Analysis
Packet forwarding: VM internal NIC > vnet > Ethernet > switch.
Capture packets on vnet and physical NIC eth0. It is found that:
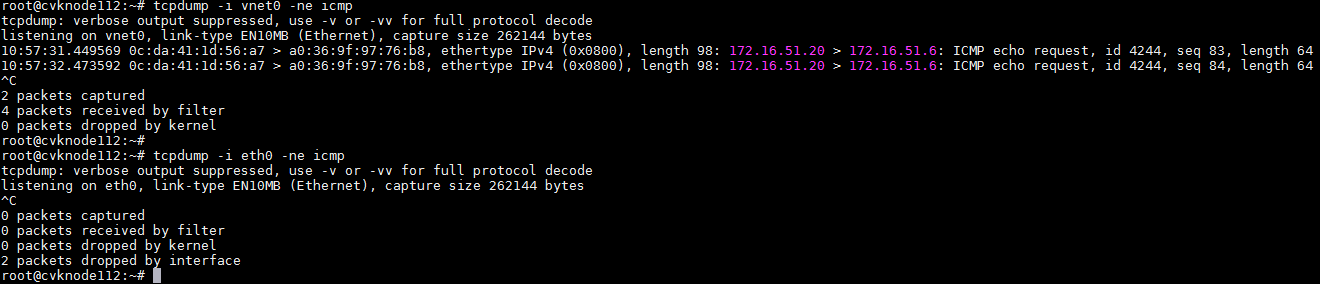
The vnet has received an ICMP request packet, but the packet was not captured on ETH."
You can view the ACL configuration on vnet by following these steps:
1. Use the command ovs_dbg_listports to view the VMs that belong to vnet.
2. Use virsh dumpxml vm_name to view the XML of a VM. Within the XML, locate the interface node to view the following information:
<interface type='bridge'>
<mac address='0c:da:41:1d:56:a7'/>
<source bridge='vswitch0'/>
<vlan>
<tag id='1'/>
</vlan>
<virtualport type='openvswitch'>
<parameters interfaceid='bfcd8333-2282-4d08-a0bb-cc14a37ff1e9'/>
</virtualport>
<target dev='vnet0'/>
<model type='virtio'/>
<driver name='vhost'/>
<hotpluggable state='on'/>
<filterref filter='acl-test'/>
<priority type='low'/>
<mtu size='1500'/>
<alias name='net0'/>
<address type='pci' domain='0x0000' bus='0x00' slot='0x03' function='0x0'/>
</interface>
The value of the filter is the name of the ACL.
3. You can view the contents of the ACL by using the virsh nwfilter-dumpxml acl_name command.
root@cvknode112:~# virsh nwfilter-dumpxml acl-test
<filter name='acl-test' chain='root'> //The ACL name is acl-test.
<uuid>41f62fca-275b-4a72-8ad8-515d9e9589c1</uuid>
<rule action='accept' direction='in' priority='4' statematch='false'> //The rule permits incoming traffic by default.
<all/>
</rule>
<rule action='accept' direction='out' priority='5' statematch='false'> //The rule permits outgoing traffic by default.
<all/>
</rule>
<rule action='accept' direction='in' priority='6' statematch='false'>//The rule permits incoming traffic by default.
<all-ipv6/>
</rule>
<rule action='accept' direction='out' priority='7' statematch='false'> //The rule permits outgoing traffic by default.
<all-ipv6/>
</rule>
<rule action='drop' direction='in' priority='10' statematch='false'>
<icmp dstipaddr='172.16.51.6' dstipmask='32'/> //Discard ICMP packets with destination IP of 172.16.51.6.
</rule>
</filter>
Analyze the ACL rules and you can see that OVS's ACL discards packets.
root@cvknode112:~# ovs-appctl dpif/dump-flows vswitch0 | grep "172.16.51.6"
recirc_id(0),in_port(8),eth_type(0x0800),ipv4(dst=172.16.51.6,proto=1,tos=0/0xfc,frag=no), packets:10426, bytes:1021748, used:0.369s, actions:drop
Packet drop information can also been found in OVS kernel flow entries.
Solution: Modify the ACL configuration of the VM.
CVK launching external attacks
Symptom
A virus in CVK is attempting to establish numerous non-connections outside, resulting in the depletion of network resources.
Analysis
1. To detect anomalies in the environment, use tcpdump to capture packets. Anomalous traffic might exhibit the following characteristics:
¡ Initiate DNS resolution requests.
¡ Initiate TCP SYN requests, but usually not establish connections.
¡ The destination IP addresses are not within the user environment, but belong to some data centers.
¡ Large quantity.
2. Use the netstat -atunp command to check for any anomalous processes attempting to establish network connections. Anomalous processes might exhibit the following characteristics:
¡ The IP used for a connection is an external IP rather than an IP in the user environment.
¡ Disguise process names as commonly used program names such as cd, ls, echo, and sh.
¡ If CVK is disconnected from the external network, the connection status might remain in SYN_SENT.
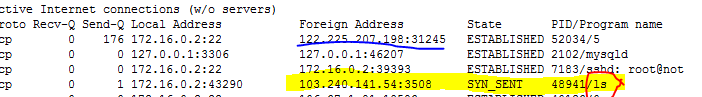
3. Use the top -c command to check for any anomalous processes. An abnomal process might have the following characteristics:
¡ The CPU or memory usage is high.
¡ The process disguises itself as a commonly used program name.
4. Check the /etc/crontab file to see if any abnormal scheduled tasks have been added. CVK has the following scheduled tasks and any tasks outside this scope can be considered tampered by someone.
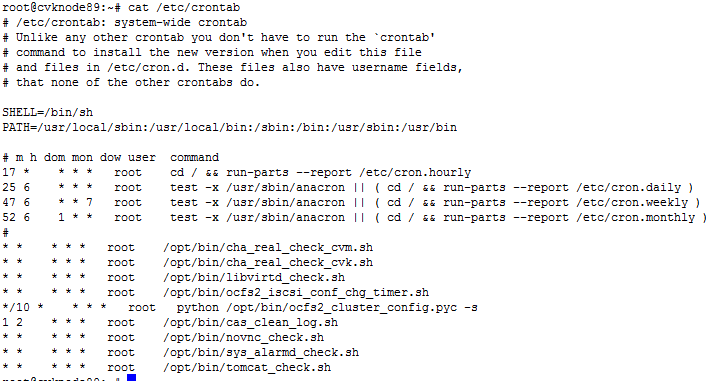
Solution
5. Change the password, delete anomalous processes and executable files on the disk, and remove anomalous tasks in /etc/crontab.
6. Reinstall CVK and change the password.
Troubleshooting common stateful failover issues
Common inspection items for stateful failover
The deployment of stateful failover is done through the Web interface. If the deployment fails, the interface will prompt with appropriate error messages.
Stateful failover deployment checklist:
· The management networks between the two CVM hosts must be interconnected and connected to the arbitration host.
· During deployment, the backup host or high-level arbitration host password must be correctly input.
· The time difference between the two CVM hosts shall not exceed 5 minutes. If inconsistent, please manually synchronize the server time. It is prohibited to modify time in the past.
· The disk partition table types of the two CVM hosts are the same, either msdos or gpt.
· The two CVM hosts must have the same version and component (CVM/CIC/SSV) installed.
· The deployment should not have duplicate IP addresses or conflict with the address on a host's NIC.
· The two CVM hosts require installation of a new system. They have never been used as CVK hosts and are not managed in the management platform.
· The two CVM hosts cannot have defined VMs or other storage pools aside from the default.
· The /vms partition of the two CVM hosts should have enough space to allocate to the database partitions.
· As a best practice, use CVK in the same cloud platform as the high-level arbitration host. The high-level arbitration host cannot be used by other hot-standby hosts.
· The standby CVM service needs to be executable, meaning that /etc/init.d/tomcat8 exists and can be executed.
· In the deployment, all configured IP addresses should be either IPv4 or IPv6.
· The host names of the two CVM hosts cannot be the same.
Common stateful failover issues
Inconsistent CAS components installed on the primary and backup hosts for stateful failover deployment
Symptom
The deployment interface prompts that the CAS components (CVM/CIC/SSV) installed on the primary and backup hosts are inconsistent, and stateful failover configuration is not allowed.
Solution
Use the cat /etc/cas_component_info command to check if the components on both CVM hosts are consistent. If they are inconsistent, reinstall the same CAS components on the two hosts.
Inconsistent system boot-up methods on the primary and backup hosts for stateful failover deployment
Symptom
The deployment interface prompts that the boot-up modes of the primary and backup hosts are inconsistent, and stateful failover configuration is not allowed.
Solution
CAS supports both BIOS and UEFI installation modes and uses MSDOS and GPT partitioning methods. MSDOS and GPT modes cannot be mixed to set up CVM stateful failover. If the issue is caused by the usage of different partitioning methods, reinstall CAS.
If the primary and backup systems are installed on different drives, for example, one on sda and the other on sdb, CVM stateful failover configuration is not allowed. If the issue is caused by system installation on different drives, reinstall CAS.
You can use the parted -l command to determine the partitioning mode, as shown in the following figure:
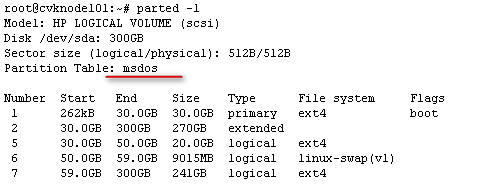
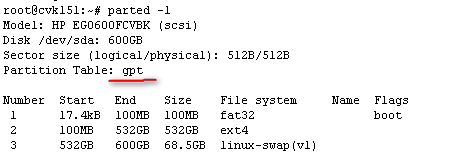
False prompt of incorrect password during stateful failover deployment
Symptom
During stateful failover deployment, a message of incorrect password is prompted even though the password is correct, resulting in the prevention of stateful failover configuration.
Solution
The host information has changed, causing leftover SSH information. In this case, if you attempt to connect to the backup host's IP address via SSH from the primary CVM, you will receive the following warning message: REMOTE HOST IDENTIFICATION HAS CHANGED! Clear the leftover information according to the prompted command (the screenshot only shows the location of the clear command, do not copy). After clearing, redeploy stateful failover. If a high-level arbitration host has a similar warning, process it in the same way.
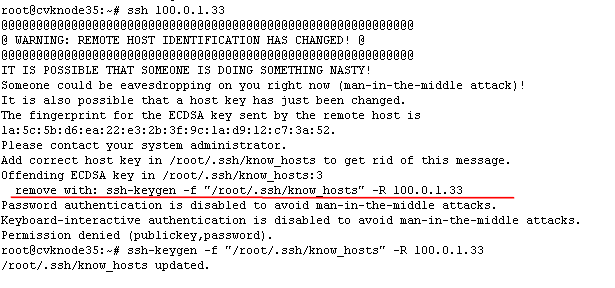
Prompt of configuration failure during stateful failover deployment
Symptom
During stateful failover deployment, in the stateful failover service detection phase, a configuration failure prompt appears, suggesting to re-login and reconfigure.
Solution
View log information at /var/log/cvm_master_slave.log. The log shows that the failure occurred in the partitioning stage with the error cvknode36,umount /dev/vda7 error!
You can manually try to execute the umount /vms command. If the unmounting fails, it indicates that the vms directory is open in the background or occupied by another process. You need to exit the vms directory or close the process occupying vms before deployment. (If the unmounting succeeds, remember to remount vms.)
Failure to access Space Console after deployment if time was modified before deployment
Symptom
Before stateful failover deployment, the system time was changed forward on the primary and backup CVM hosts, causing MySQL close failure during deployment. After deployment, the Space Console cannot be accessed instantly or after a switchover.
Solution
View the datadir loaded by the MySQL process. If the datadir is /var/lib/mysql, restart MySQL.
If you cannot restart MySQL by executing service mysql restart, restart the host. CAS does not allow changing the timestamp forward.
![]()
Unable to access Space Console through VIP after deployment, but can access it through real IP
Symptom
After setup of the stateful failover system, users unable to log in or access Space Console by using the VIP. Access through real IP is allowed.
Solution
1. If the stateful failover system is set up using VMs, check if the IP/MAC is bound, which might limit traffic to the bound IP. If necessary, release the binding. Additionally, the serial port of the VM needs to be opened.
2. Check for IP address conflicts by using arp -n to see if the MAC addresses in the ARP table match the NIC addresses.
3. Check if a gateway has been passed through but the gateway's ARP table hasn't been updated.
Unable to access Space Console after a period of time following deployment
Symptom: After the stateful failover system is set up and run about 90 days, users cannot access Space Console, while other services like tomcat are functioning normally.
Solution:
View /var/log/.cvm_master/cvm_status.info. The original log has been deleted and the following information is added:
****Thu Feb 14 12:30:49 CST 2019,regularly clean up, the log kept more than 90 was cleared by cas_clear_log.sh***
Both primary and backup CVMs should execute the rm –rf /var/log/.cvm_master/cvm_status.info command to delete the cvm_status.info file.
CVM access failure after a successful primary/backup switchover
Symptom
After successful stateful failover deployment, CVM can be accessed. However, after a successful primary/backup switchover, CVM cannot be accessed and reports a 404 error or continuously mounts the CVM login interface.
Solution
1. Refer to the following for initial troubleshooting:
Failure to access Space Console after deployment if time was modified before deployment
Unable to access Space Console through VIP after deployment, but can access it through real IP
Unable to access Space Console after a period of time following deployment
2. In a converged VDI environment, you can troubleshoot this issue by referring to Unable to access Space Console after switchover in converged environment.
3. If no problems are found during the previous troubleshooting, it is possible that one of the two servers had this issue before the stateful failover deployment. This could have been caused by CAS installation where certain foreground services or war decompression encountered anomalies.
Execute the following commands on the primary host to check if the foreground services are running smoothly.
If one of the service process numbers keeps changing or does not exist, it means there is an issue with the foreground service. Contact the foreground development team to locate the problem.
root@cvknode112:/# service tomcat8 status
* Tomcat servlet engine is running with pid 57338
root@cvknode112:/# service casserver status
* casserver is running with pid 33079.
Execute the following command on the problematic primary host to resolve the war package issue:
If there is a problem with CIC, simply replace cas with cic.
service tomcat8 stop ; rm -r /var/lib/tomcat8/webapps/cas ; service tomcat8 start
Unable to access Space Console after switchover in converged environment
Symptom
In stateful failover and VDI converged version E526H01 environment, Space Console cannot be opened after a switchover. The mysqld loaded directory /var/lib/mysql-share does not include the vservice directory, so it did not load the actual database.
![]()
The directory ls /var/lib/mysql-share/vservice does not exist.
The VDI will modify MySQL configuration in this version, and it will restart the MySQL service on the backup host as well.
Solution
Execute cvm_resource_restart.sh to restart the stateful failover service or perform a switchover again to resolve the issue. We have fixed the issue in the next upgrade version of VDI.
Failure to execute switchover after a period of time following deployment
Symptom
The stateful failover system is set up using a local synchronization partition. After the system runs for about 90 days, the front-end fails to execute switchovers.
Solution
View /var/log/.cvm_master/cvm_add_sync_partition_status.info. The original log has been deleted and the following information is added:
****Thu Feb 14 12:30:49 CST 2019,regularly clean up, the log kept more than 90 was cleared by cas_clear_log.sh****
Execute rm -rf /var/log/.cvm_master/cvm_add_sync_partition_status.info to delete file cvm_add_sync_partition_status.info if it exists on the primary or backup host.
Repetitive primary/backup switchover
Symptom
The stateful failover system has two synchronization partitions. The primary and backup hosts perform switchovers repeatedly.
Solution
When monitoring services, the new stateful failover service will test the readability and writability of the partitions. If it fails to write, it results in a switchover.
If the write failure is caused by the RAID card, restart the host and this issue might be able to be resolved.
If the write failure is due to full usage of the synchronization partition, release the space first, and then execute cvm_resource_restart.sh on the primary host to restore the stateful failover environment.
As shown in the figure below, we need to release space of the /vms/template synchronization partition.
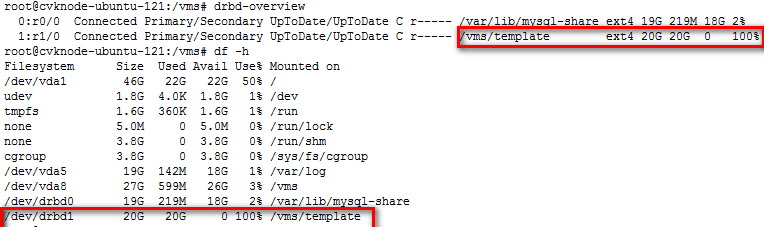
VDI virtual address removal after primary/backup switchover
Symptom
In new stateful failover and VDI converged environment, a primary/backup switchover leads to the removal of the VDI virtual address.
Solution
This is because the old version removes all IPs except for the management network addresses. The current new version has resolved this issue by using a new script that only removes the stateful failover virtual IP.
CVM login failure because of prolonged external storage error
Symptom
CAS CVM connects to ONEStor storage and uses the block devices provided by ONEStor as storage volumes.
When the storage is faulty for a long time, API-related queries on the Web interface cause the libvirt service to get stuck. As a result, the tomcat service cannot respond, the cluster becomes unmanageable, and the system prompts a network communication error when you log in to CVM.
Cause
When the storage side is faulty for a long time, libvirt-related command accumulation causes services to get stuck. As a result, the tomcat service also gets stuck, causing communication failure and CVM login failure.
Solution
To resolve the issue:
1. Access the CLI of the management node.
2. Execute the service libvirtd restart command to restart the libvirt service.
3. Execute the service tomcat8 stop and service tomcat8 start commands in sequence to restart the tomcat service.
A VM migration task gets stuck at 95% when you migrate a VM by changing the host and storage
Symptom
When you migrate a VM by changing the host and storage, the migration task gets stuck at 95%. All related tasks for the VM are affected and the VM cannot provide services correctly.
Cause
During data storage migration, the storage space is full, which interrupts the migration.
Solution
To resolve the issue:
1. Access the CLI of the management node.
2. Execute the service tomcat8 stop and service tomcat8 start commands in sequence to restart the tomcat service.
USB issues
This section describes how to resolve issues that a newly-added USB device cannot be recognized and that a USB device can be recognized but is disconnected after being used for a period of time.
USB device types
Common USB devices include USB flash drives, external USB hard drives, USB encryption dongles, USB keys, and USB GSM modems.
Examples
After a USB device is plugged into a CVK host, the host cannot recognize the USB device
Symptom
After a USB device is plugged into a CVK host, you cannot find the USB device when you attempt to add a USB device on the CAS system.
Solution
To resolve the issue:
1. Connect the USB device to another USB connector. If you use a USB extension cable, connect the USB device directly to a built-in USB connector and try again. If the server provides multiple types of USB slots, make sure the USB device is connected to a correct connector. To identify whether a USB device is installed correctly, execute the lsusb –t command.
root@cvk-163:~# lsusb -t
/: Bus 04.Port 1: Dev 1, Class=root_hub, Driver=xhci_hcd/6p, 5000M
/: Bus 03.Port 1: Dev 1, Class=root_hub, Driver=xhci_hcd/15p, 480M
/: Bus 02.Port 1: Dev 1, Class=root_hub, Driver=ehci-pci/2p, 480M
|__ Port 1: Dev 2, If 0, Class=hub, Driver=hub/8p, 480M
/: Bus 01.Port 1: Dev 1, Class=root_hub, Driver=ehci-pci/2p, 480M
|__ Port 1: Dev 2, If 0, Class=hub, Driver=hub/6p, 480M
uhci represents USB 1.1, ehci represents USB 2.0, and xhci represents USB 3.0. Typically, the maximum transmission rate is 12 Mbps for USB 1.1, 480 Mbps for USB 2.0, and 5 Gbps for USB 3.0.
For example, for a server that supports multiple USB bus standards, a USB device is added to the USB 2.0 (ehci-pci) bus after a USB 2.0 device is added to the server. This indicates that the USB device is correctly inserted into the slot.
2. USB devices USB devices come in versions USB 3.0, USB 2.0, and USB 1.0 and are backward compatible. However, some USB devices might have poor compatibility. For example, USB keys are typically USB 1.0 devices. As a best practice, disable USB 3.0 on the BIOS if you plug a USB key into a USB 3.0 slot on the server.
3. If the host still cannot recognize the USB device, proceed to the next step.
4. At the CLI of the CVK host, use the lsusb command before and after you plug the USB device into the host. Compare the outputs to identify whether a new USB device is added.
root@ CVK:~# lsusb
Bus 001 Device 001: ID 1d6b:0002 Linux Foundation 2.0 root hub
Bus 005 Device 001: ID 1d6b:0001 Linux Foundation 1.1 root hub
Bus 004 Device 001: ID 1d6b:0001 Linux Foundation 1.1 root hub
Bus 003 Device 001: ID 1d6b:0001 Linux Foundation 1.1 root hub
Bus 002 Device 001: ID 1d6b:0001 Linux Foundation 1.1 root hub
Bus 006 Device 002: ID 03f0:7029 Hewlett-Packard
Bus 006 Device 001: ID 1d6b:0001 Linux Foundation 1.1 root hub
5. If no new USB device is added, the Ubuntu operating system cannot recognize the USB device. In this situation, the USB device might be faulty because Linux operating systems support most of the USB devices on the market. To identify whether the USB device operates correctly, plug the USB device into a PC. If the USB device can operate correctly on the PC, it is normal. Perform the following tasks to identify whether the CAS system is faulty or the server is incompatible with the USB device.
a. Install the operating system of the PC on the server by using bare-metal installation. Plug the USB device into the server, and then identify whether the system can recognize the USB device.
- If the system cannot recognize the USB device, the server is incompatible with the USB device.
- If the system can recognize the USB device, the server is compatible with the USB device.
b. Install a native Ubuntu system on the server by using bare-metal installation. Plug the USB device into the server, and then identify whether the system can recognize the USB device.
- If the system cannot recognize the USB device, the Ubuntu system does not support the USB device. CAS also does not support the USB device because it works based on the Ubuntu system.
- If the system can recognize the USB device, the CAS system has an error. Please contact Technical Support.
6. If a new USB device is added, the Ubuntu operating system recognizes the USB device. Proceed to the next step.
7. Execute the virsh nodedev-list usb_device command to view the name of the newly-added USB device.
root@ CVK:~# virsh nodedev-list usb_device
usb_2_1_5
usb_usb1
usb_usb2
usb_usb3
usb_usb4
In this example, the name of the newly-added USB device is usb_2_1_5.
8. Execute the virsh nodedev-dumpxml xxx command to view the XML information for the newly-added USB device. xxx represents the name of the newly-added USB device in the output from the virsh nodedev-list usb_device command.
root@CVK:~# virsh nodedev-dumpxml usb_2_1_5
<device>
<name>usb_2_1_5</name>
<path>/sys/devices/pci0000:00/0000:00:1d.0/usb2/2-1/2-1.5</path>
<parent>usb_2_1</parent>
<driver>
<name>usb</name>
</driver>
<capability type='usb_device'>
<bus>2</bus>
<device>70</device>
<product id='0x6545'>DataTraveler G2 </product>
<vendor id='0x0930'>Kingston</vendor>
</capability>
</device>
Identify whether the bus ID, device ID, product ID, and vendor ID are correct. If these IDs are all correct and you still cannot find the USB device on the Web interface, contact Technical Support.
USB device loading failure
Symptom
After a USB device is mounted to a VM, the device manager of the VM cannot recognize the USB device, the USB device disappears very quickly, or the USB device has an exclamation mark.
Solution
To resolve the issue:
1. Connect the USB device to another USB connector. If you use a USB extension cable, connect the USB device directly to a built-in USB connector and try again. If the server provides multiple types of USB slots, make sure the USB device is connected to a correct connector. To identify whether a USB device is installed correctly, execute the lsusb –t command.
root@cvk-163:~# lsusb -t
/: Bus 04.Port 1: Dev 1, Class=root_hub, Driver=xhci_hcd/6p, 5000M
/: Bus 03.Port 1: Dev 1, Class=root_hub, Driver=xhci_hcd/15p, 480M
/: Bus 02.Port 1: Dev 1, Class=root_hub, Driver=ehci-pci/2p, 480M
|__ Port 1: Dev 2, If 0, Class=hub, Driver=hub/8p, 480M
/: Bus 01.Port 1: Dev 1, Class=root_hub, Driver=ehci-pci/2p, 480M
|__ Port 1: Dev 2, If 0, Class=hub, Driver=hub/6p, 480M
uhci represents USB 1.1, ehci represents USB 2.0, and xhci represents USB 3.0. Typically, the maximum transmission rate is 12 Mbps for USB 1.1, 480 Mbps for USB 2.0, and 5 Gbps for USB 3.0.
For example, for a server that supports multiple USB bus standards, a USB device is added to the USB 2.0 (ehci-pci) bus after a USB 2.0 device is added to the server. This indicates that the USB device is correctly inserted into the slot.
2. USB keys, encryption dongles, and SMS modems are typically USB 1.0 devices. As a best practice, disable USB 3.0 on the BIOS if you plug such a USB device into a server that has only USB 3.0 slots.
3. To identify whether the CVK host can recognize the USB device, unplug and plug the USB device, and then execute the virsh nodedev-list usb_device command to identify whether a new USB device is added.
¡ If no new USB device is added, troubleshoot the issue as described in "After a USB device is plugged into a CVK host, the host cannot recognize the USB device."
¡ If a new USB device is added, proceed to the next step.
4. When you add the USB device to a VM, make sure you select a correct USB controller for the USB device. Typically, select a USB 1.0 controller for a USB Key, encryption dongle, or SMS modem.
5. Identify whether the driver is normal and its version is compatible with the operation system of the VM.
¡ Install the same operating system on a physical device and identify whether the driver operates correctly.
¡ Contact the USB device vendor.
¡ Create a similar VM on the VMware vCenter platform, install the same driver, and load the USB device to see if it can be recognized by the VM. If the driver is normal but the VM still cannot recognize the USB device, proceed to the next step.
6. Execute the virsh nodedev-dumpxml xxx command to view the XML information for the newly-added USB device. xxx represents the name of the newly-added USB device in the output from the virsh nodedev-list usb_device command.
root@ CVK:~# virsh nodedev-list usb_device
usb_2_1_5
usb_usb1
usb_usb2
usb_usb3
usb_usb4
In this example, the name of the newly-added USB device is usb_2_1_5.
root@CVK:~# virsh nodedev-dumpxml usb_2_1_5
<device>
<name>usb_2_1_5</name>
<path>/sys/devices/pci0000:00/0000:00:1d.0/usb2/2-1/2-1.5</path>
<parent>usb_2_1</parent>
<driver>
<name>usb</name>
</driver>
<capability type='usb_device'>
<bus>2</bus>
<device>70</device>
<product id='0x6545'>DataTraveler G2 </product>
<vendor id='0x0930'>Kingston</vendor>
</capability>
</device>
After you mount the USB device to the VM, execute the virsh nodedev-dumpxml xxx command again to check the device ID, product ID, and vendor ID. If a value changes, the server might be incompatible with the USB device. After you make sure the USB device is functional, install the same operating system used by the VM on the server by using bare-metal installation and see if the USB device can be used correctly. Examine the system logs for any errors. If the USB device operates correctly, contact Technical Support.
Use of USB3.0 devices
Symptom
After you select the USB 3.0 controller on the Web interface when you add a USB 3.0 device to a VM, the USB device cannot be found in the VM.
Cause
The VM lacks the USB 3.0 driver. A resolved issue is that a VM installed with the Windows Server 2008 R2 Enterprise operating system failed to recognize the newly-added USB 3.0 external hard drive. The reason was that the operating system lacked the USB 3.0 driver. USB 3.0 is a relatively new protocol. Some old operating systems do not have the corresponding driver, which must be downloaded.
· The USB 3.0 device is incompatible with the server. After you plug the USB 3.0 device into the server installed with CAS, log in through an SSH terminal, and then execute the lsusb –t command. No new USB device is displayed. Troubleshoot the issue as described in "After a USB device is plugged into a CVK host, the host cannot recognize the USB device.”
Use of USB-to-serial devices
After you plug in a USB-to-serial device into a server installed with CAS, log in through an SSH terminal, and then execute the lsusb -t command to identify whether the new USB device is added. Check the transmission rate of the newly-added USB device. If the transmission rate is 12 Mbps, select the USB 1.0 controller when you add the USB device to a VM. If the transmission rate is 480 Mbps, select the USB 2.0 controller.
The following shows some resolved issues.
· After you load a USB-to-serial device to a VM, no newly-added USB-to-serial device can be found on the VM. After you install the USB-to-serial driver on the VM, the device still cannot be displayed. The reason is that the selected USB 2.0 controller does not match the device transmission rate. The issue is resolved after you select the USB 1.0 controller.
· Four USB-to-serial cables connect four switches on one end and a server installed with CAS on the other end. After you log in through an SSH terminal and execute the lsusb -t command to view new devices, not all of the four newly-added devices can be displayed. If you unplug and then plug the cables repeatedly, only one, two, or three devices can be displayed. When an unrecognized USB connector is plugged in, a syslog message is generated as shown in the figure.
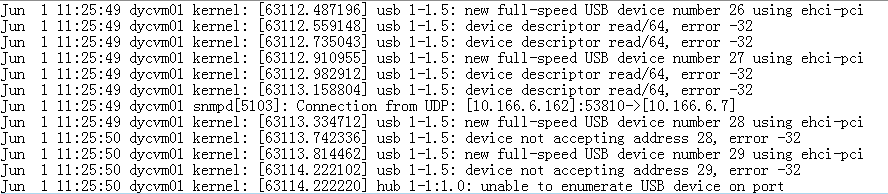
The log message is generated because a bus negotiation error occurred during connection establishment between the USB device and server. As a best practice, identify whether the server supports this USB-to-serial connection method. In this example, the server does not support this method. After you replace the HP FlexServer R390 server with an R590 server, all the four new devices can be correctly recognized.
USB controller passthrough
If the USB device still cannot be recognized after you configure USB passthrough and verify that its transmission rate matches the USB controller and the driver operates correctly, configure USB controller passthrough. However, this causes all USB devices connected to the server to be recognized by the VM, making them unavailable for the server.
To configure USB controller passthrough:
1. Enable IOMMU for the CVK host.
a. Execute the vim /boot/grub/grub.cfg command.
b. Add intel_iommu=on iommu=pt as shown in the figure.
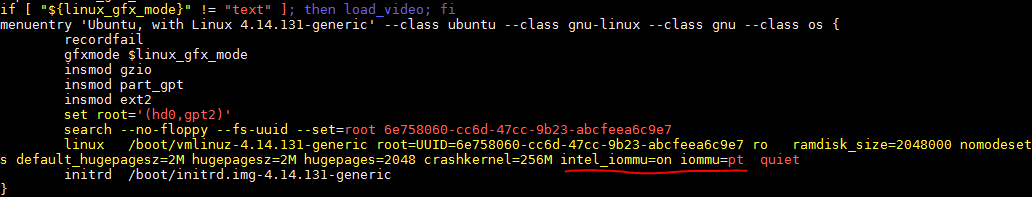
c. Save the configuration and exit grub.
|
|
IMPORTANT: To have the configuration take effect, restart the server. |
2. Execute the lsusb command.
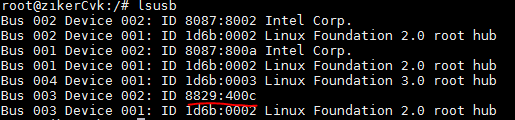
As shown in the figure, the bus ID is 003, device ID is 0002, vendor ID is 8829, and product ID is 400c for the USB device.
3. Execute the lspci | grep –i usb command.
![]()
Typically, the first line displays the required bus ID for the USB controller, which is 00:14.0 in the example.
4. Execute the cd /sys/bus/pci/devices/0000:00:14.0/usb3/3-11 command.

If the product ID and vendor ID in the /sys/bus/pci/devices/0000:00:14.0/ directory are the same as those obtained by using the lsusb command, the USB device belongs to the controller.
5. Configure passthrough for the PCI device.
a. Execute the virsh list command to obtain the name of the VM to be edited. Execute the virsh edit command to edit the configuration file of the VM.
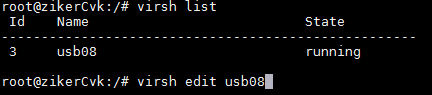
b. Add the content in the red box to the configuration file in the position as shown in the figure. Save the configuration and exit editing.
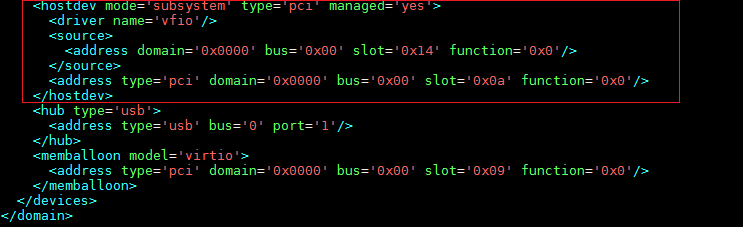
AsiaInfo/360 compatibility issues
Checking the running status of AsiaInfo on the CAS system
Make sure anti-virus is operating correctly and configure rules on the AsiaInfo platform as appropriate.
AsiaInfo anti-virus state
· CAS Ubuntu version.
a. Execute the dpkg –l |grep dsva command to verify that the version is compatible with the CAS version.
b. Execute the following commands to view the service state:
status ds_am
status ds_agent
status ds_filter
The following command output shows that the services are running correctly.
root@cvk28-uefi-pure:~# status ds_am
ds_am start/running, process 6128
root@cvk28-uefi-pure:~# status ds_agent
ds_agent start/running, process 6141
root@cvk28-uefi-pure:~# status ds_filter
ds_filter start/running, process 2653
c. Execute the cat /sys/kernel/debug/openvswitch/feature_mask command. Value 1 indicates that anti-virus is operating correctly.
· CAS CentOS version.
d. Execute the rpm -qa | grep ds_ command to verify that the version is compatible with the CAS version.
e. Execute the service xxx status command to view the service state. Verify that the command output contains Active: active (running).
Replace xxx with ds_am, ds_agent, and ds_filter, respectively.
f. Execute the cat /sys/kernel/debug/openvswitch/feature_mask command. Value 1 indicates that anti-virus is operating correctly.
Viewing the anti-virus state on the VM
Verify that the /etc/libvirt/qemu/VM.xml file of the host where the VM resides contains the <shmen> field.
<shmem name='shmem_server'>
<model type='ivshmem-doorbell'/>
<server path='/tmp/kvmsec'/>
<msi vectors='2' ioeventfd='on'/>
<address type='pci' domain='0x0000' bus='0x00' slot='0x1f' function='0x0'/>
</shmem>
Checking the anti-virus state on a Windows system
Make sure the VM is installed with CAStools. Anti-virus takes effect about 5 minutes after you enable it on CVM. To check the state of AsiaInfo anti-virus:
1. Verify that an anti-virus device exists on Device Manager.
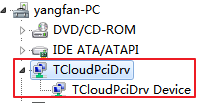
2. Execute the sc query kfileflt command to view the running state of the service. If the service is running correctly, the command output is as shown in the figure.
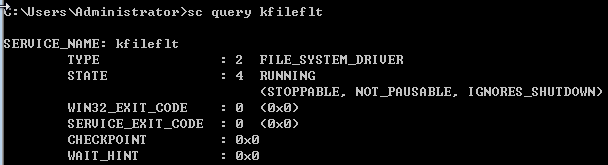
Checking the anti-virus state on a Linux system
1. Execute the systemctl status ds_filefilter.service command to verify that the service is in running state.
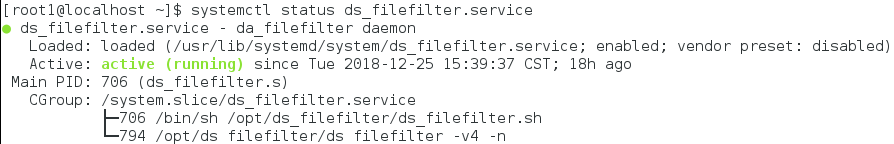
2. Verify that shared memory exists.
![]()
AsiaInfo uninstallation residuals
If VM startup or migration fails and the system has a prompt that contains the -device ivshmem,id=shmem0,size=8m,chardev=charshmem0,msi=on fields after the system is upgraded, the VM is enabled with anti-virus.
Identify whether the CAS kernel supports upgrading. If the CAS kernel supports upgrading, identify whether AsiaInfo anti-virus is uninstalled correctly before upgrade.
To upgrade CAS:
1. Shut down the VM enabled with anti-virus. To disable anti-virus, make sure the VM is shut down.
2. Disable anti-virus.
3. Uninstall AsiaInfo anti-virus. To uninstall AsiaInfo anti-virus successfully, make sure anti-virus is disabled for all VMs on the host. After uninstallation, verify that anti-virus is uninstalled correctly on the page for configuring the anti-virus service.
VM network failure
When a VM is configured with network information but the network is faulty, check the security configuration file assigned to the VM on the DSM and the DPI rules and firewall configuration. Identify whether the related configuration blocks network communication.
Checking the running status of 360 on the CAS system (CAS 7.0 is incompatible with 360)
1. Execute the dpkg -l|grep vmsec command to view the installed security components.
root@cvknode:~# dpkg -l|grep vmsec
ii vmsec-host-common
ii vmsec-host-kvm-file-bkd
ii vmsec-host-lkm-cas-3.0e0306
ii vmsec-host-net
2. Execute the dpkg -P security-component-name command to uninstall the security components.
dpkg -P vmsec-host-kvm-file-bkd
dpkg -P vmsec-host-net
dpkg -P vmsec-host-lkm-cas-3.0e0306
dpkg -P vmsec-host-common
|
|
IMPORTANT: As a best practice, uninstall security components in the above sequence. |
3. Execute the dpkg -l|grep vmsec command to verify that the security components are uninstalled successfully.
4. Execute the rm -rf /opt/nubosh/ command to delete the /opt/nubosh/ directory.
5. Execute the commands as shown in the figure. The VM has residual 360 configuration. Restart the VM.

Common host and VM infection treatment
For more information, contact Technical Support.
VM startup failure
This section describes the handling methods and analysis for different error messages in scenarios where the system reports error code 38 and the VM cannot start because of other reasons.
To resolve the issue, view the configuration in the cat /etc/libvirt/qemu/VM.xml configuration file or view the VM logs in the /var/log/libvirt/qemu/VM.log directory and Libvirt logs in the /var/log/libvirt/libvirtd.log directory. VM represents the name of the VM at the CLI, which can be found in the advanced settings of the VM summary on the Web interface. The following provides some common reasons for VM startup failure.
Insufficient resources
Resource check on the Web interface
If you enable the host memory reservation feature on the CAS system, a VM cannot start if the sum of the host memory and VM memory exceeds 80%.
Resource check performed by Libvirt
A Libvirt log records the VM startup failure. You can configure the memory threshold for Libvirt in the cpu_mem_threshold.conf configuration file.
# cat /etc/cvk/cpu_mem_threshold.conf
CpuUsePercent 85 MemUsePercent 85
Using a percentage-based limit can waste memory, because the memory of servers gets larger. The memory threshold in the new software version is changed to a numerical value. For example, memory threshold 10 represents that you reserve 10 GB memory for the server.
root@lc-cvk232:~# cat /etc/cvk/cpu_mem_threshold.conf
CpuUsePercent 85 MemSysReserved 10
If the CPU or memory resource reaches the limit configured on the Web interface or by Libvirt, manually release CPU or memory resources. If the issue is caused by overcommitment, you can shut down or migrate unused VMs to release resources.
Configuration issues
Symptom
After you uninstall AsiaInfo anti-virus, configuration file residuals causes VM startup failure.
Solution
1. View the VM log.
2017-05-18
11:01:52.617+0000: 29917: error : qemuProcessWaitForMonitor:1852 : internal
error process exited while connecting to monitor:
2017-05-18 11:01:52.414+0000: domain pid 32504, created by libvirtd pid 2974
char device redirected to /dev/pts/8 (label
charserial0)
kvm: -chardev socket,id=charshmem0,path=/tmp/kvmsec:
Failed to connect to socket: No such file or directory
kvm: -chardev socket,id=charshmem0,path=/tmp/kvmsec:
chardev: opening backend "socket" failed
2. Verify that the VM has the following configuration:
<shmem
name='nu_fsec-4af99204-6623-45e9-afbf-d852746bf187'>
<size
unit='M'>8</size>
<server path='/tmp/kvmsec'/>
<address type='pci'
domain='0x0000' bus='0x00' slot='0x09' function='0x0'/>
</shmem>
3. Delete the above xml tag and restart the VM.
Internal error
Example 1
Symptom
The system might report an error with error code 38 but does not show the detailed reason for a VM startup failure.
CAS 5.0 and later versions support detailed error messages. This issue might occur for CAS in versions earlier than 5.0.
Solution
Analyze and resolve the issue based on the detailed failure causes in the VM logs and Libvirt logs.
Example 2
Symptom
The VM cannot start correctly and the system prompts "Could not read snapshots: File too large".
Solution
1. View the VM log.
error: Failed to start
domain centos
error: internal error process exited while connecting to monitor: 2016-08-02 19:52:42.707+0000: domain pid
31971, created by libvirtd pid 3434
char device redirected to /dev/pts/5 (label
charserial0)
kvm: -drive
file=/vms/share/Centos6.5-tf.5-tf,if=none,id=drive-virtio-disk0,format=qcow2,cache=directsync: could not open disk image /vms/share/Centos6.5-tf.5-tf:
Could not read snapshots: File too large
The log shows that the image snapshot is damaged.
2. Execute the following commands to use the qcow2.py tool to set the number of snapshots in the qcow2 header file to 0.
qcow2.py dump-header
qcow2.py set-header nb_snapshots 0
qcow2.py set-header snapshot_offset 0x0
The tool is integrated in CAS E0520 and later versions.
root@mi-service:~# qcow2.py /vms/share/Centos6.5-tf.5-tf
dump-header
magic
0x514649fb
version
3
backing_file_offset
0x0
backing_file_size
0x0
cluster_bits
21
size
26843545600
crypt_method 0
l1_size
1
l1_table_offset
0x600000
refcount_table_offset
0x200000
refcount_table_clusters 1
nb_snapshots
4
snapshot_offset
0x130600000
incompatible_features 0x0
compatible_features
0x0
autoclear_features
0x0
refcount_order
4
header_length
104
root@mi-service:~# qcow2.py /vms/share/Centos6.5-tf.5-tf set-header nb_snapshots 0
root@mi-service:~# qcow2.py /vms/share/Centos6.5-tf.5-tf set-header snapshot_offset 0x0
root@mi-service:~# qcow2.py /vms/share/Centos6.5-tf.5-tf dump-header
magic
0x514649fb
version
3
backing_file_offset
0x0
backing_file_size
0x0
cluster_bits
21
size
26843545600
crypt_method
0
l1_size
1
l1_table_offset
0x600000
refcount_table_offset
0x200000
refcount_table_clusters 1
nb_snapshots
0
snapshot_offset
0x0
incompatible_features 0x0
compatible_features
0x0
autoclear_features
0x0
refcount_order
4
header_length 104
Example 3
Symptom
A VM fails to start after it migrates to another host when the CVK host it belongs automatically restarts in CAS E0526H05.
The VM migrates from host 08 to host 11 but cannot start after migration. As shown in the figure, the system prompts that the disk file of the VM cannot be opened.
Log in to host 08. The host crashed at the time when the VM failed to start and generated a crash file.
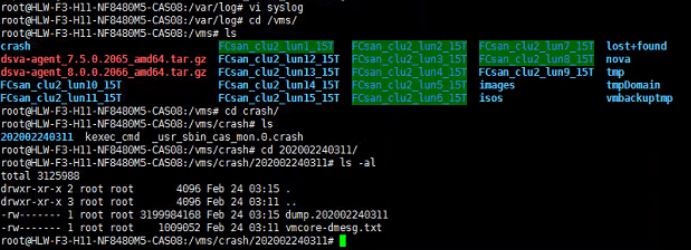
Analysis
Remotely access the CVK host. An error has occurred to the disk file of the VM and the system prompts “74 leaked cluster were found on the image” and “This means waste of disk space, but no harm to data”.
The qemu log shows that the error is not caused by the CVK host crash. On November 2nd, 2019, the disk was faulty. As a result, the disk cannot be opened when the VM starts.
HLW-F3-H11-NF8480M5-CAS08:
2019-11-01 01:21:24.400124 : resume_all_vcpus(1849): vm is resumed.
qcow2: Marking image as corrupt: Cluster allocation offset 0xc08ed0bc007c00 unaligned (L2 offset: 0x140000, L2 index: 0); further corruption events will be suppressed
2019-11-02 04:00:18.822216 : do_vm_stop(1017): vm is suspended, state=4.
Solution
Back up the disk file, and then execute the qemu-img check –r al xxxxx command to repair the disk. After repair, the VM starts correctly.
|
|
IMPORTANT: Before repair, back up the disk file for future use. |
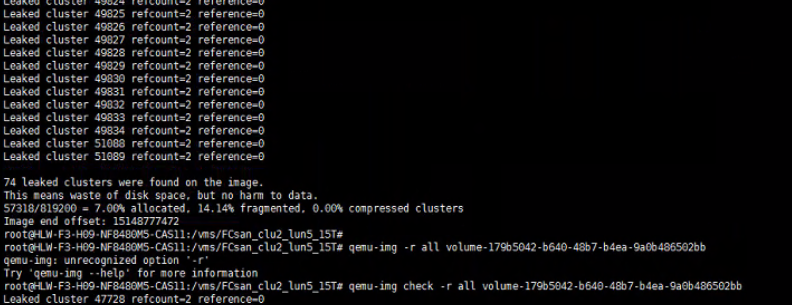
System startup failure
Symptom
A VM cannot start. The portal website cannot be opened because of VM image file error. After the VM is restarted, the system reports an error that the boot disk cannot be found.
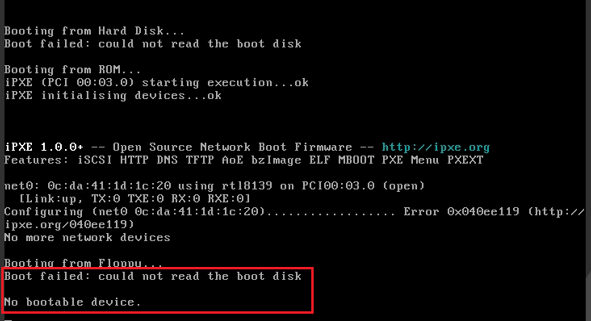
Solution
1. View the VM log.
qcow2: Preventing invalid write on metadata (overlaps with snapshot table); image marked as corrupt.
2. Execute the qemu-img check XXX command (XXX represents the disk image file). The disk image has an error, as shown in the figure.
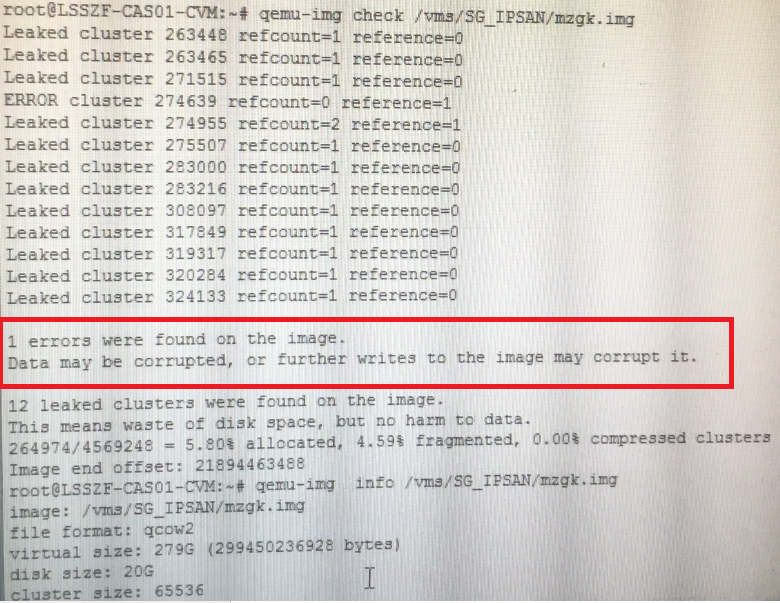
3. Execute the qemu-img check -r all xxx (xxx represents the disk image file) to repair the image file. After repair, start the VM again.
|
|
IMPORTANT: Before repair, back up the image file for future use. |
Password recovery
CVM console password
To recover the CVM console password, click Forgot Password on the Web interface, and then enter the login name and email address.
CVK root password
The password recovery methods are different for Ubuntu and CentOS operating systems.
· CentOS—On the boot screen, press E. Log in with SSO, edit the root password, and then reboot CentOS.
· Ubuntu—During booting, select the Recovery mode. Input quiet splash rw init=/bin/bash to edit the root password.
Insufficient disk space
To resolve this issue, determine files that can be deleted to release disk space in directories such as the root and /var/log directories.
Execute the find command to locate large files. Identify whether the large files are useful. If the large files are useful, back up the large files, and then delete them. If the large files are no longer useful, delete them directly.
The figure shows the files larger than 10 MB in the /var/log directory.
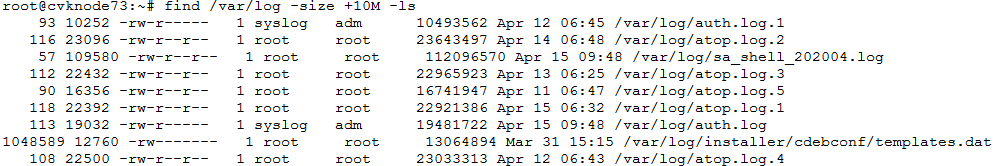
Common hardware failures
Common hardware failures
Common hardware failures include CPU, memory, main board, disk, NIC, HBA card, fiber, network cable, and RAID controller failures.
Impact
Hardware failures might cause service interruption, server hanging, crashes, frequent link flappings, and degradation of communication quality. In extreme cases, they can cause the CAS system to be unresponsive.
Analysis
1. Check the MCE logs and syslogs for errors. Typically, hardware failures are recorded in MCE logs or syslogs.
2. Check the hardware status on the server iLO port. Collect necessary IML logs on the iLO port and send the logs to the engineers from the server vendor for help.
3. To troubleshoot RAID controller failures, collect related logs, firmware and driver version information of the RAID controller and send them to the engineers from the research and development department and server manufacturer for help.
4. To troubleshoot NIC, HBA card, or fiber failures, check the dropped packets or optical power on the upstream switch. For more information, see the troubleshooting methods described in the documents that come with the switch.
Solution
When a hardware failure occurs, replace the hardware immediately to minimize the impact on services. Review the alarms in time and take timely actions when a hardware alarm occurs. If the server supports hardware alarm configuration, configure alarms immediately.
Some hardware components such as fibers are consumable and require regular inspection. If a hardware component is faulty, replace it immediately.
FCoE issues
For more information, contact Technical Support.
Storage link and multipath issues
For more information, contact Technical Support.
Common VNC configuration issues
Common issues
VNC is inaccessible, VNC client cannot open the console, and the Java VNC console cannot be opened.
Common troubleshooting workflow
Typically, first analyze the corresponding log file to check for anomalies, and then troubleshoot the various network and VNC settings and port availability.
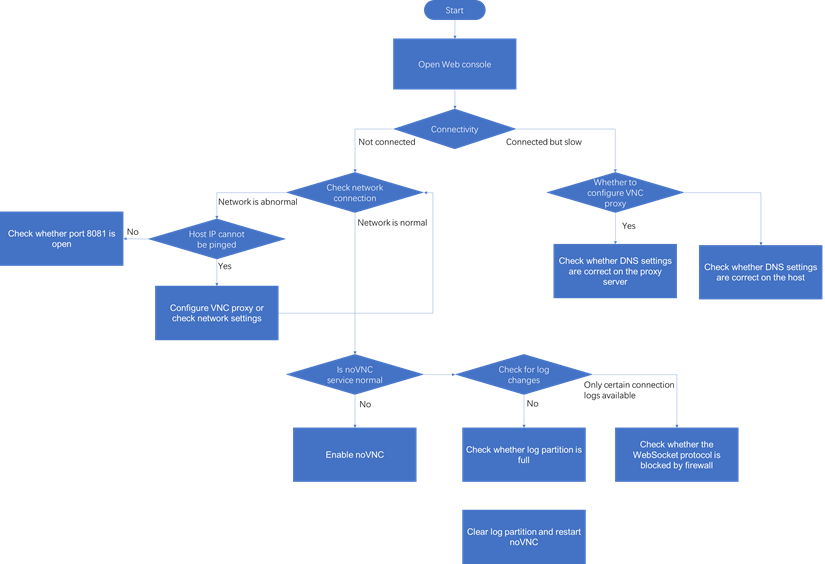
Common VNC configuration issues in the NAT environment
In the CAS virtualization environment of the current user, the administrator might access the CAS system from the public network. Due to the isolation between the internal and external network routes, devices on the public network cannot access the CAS system in the internal network. It is required that, without modifying the routing configuration, public network devices can access the CAS system in the internal network through a designated address and connect the internal VMs for operations through the console. The requirement is implemented by configuring NAT on a router. If firewalls are deployed in some scenarios, improper configuration might result in access failure. This document describes the service packet procedure in the single and dual CVM scenarios selected from the lab environment, providing a reference for configuring VM access through a VNC proxy in a NAT environment.
Configuration procedure in the single CVM environment
Network diagram:
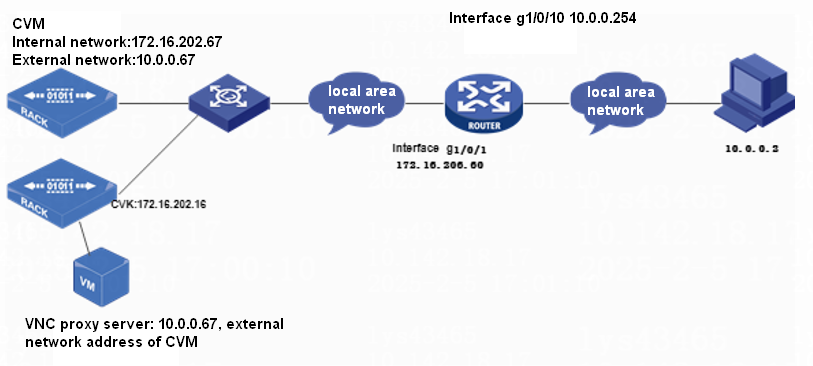
NAT configuration on the router:
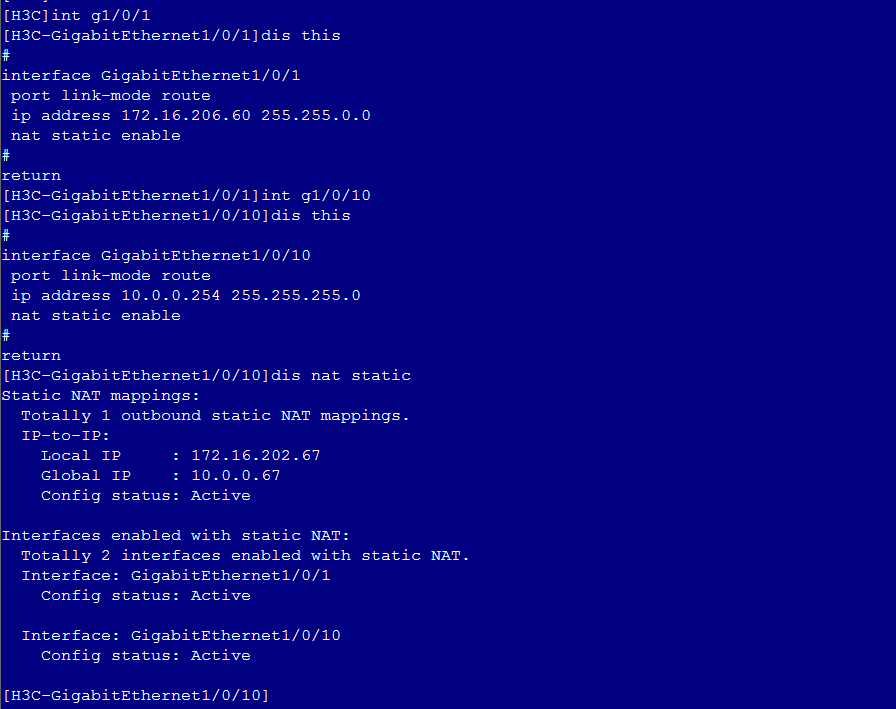
Route configuration on the CVM:
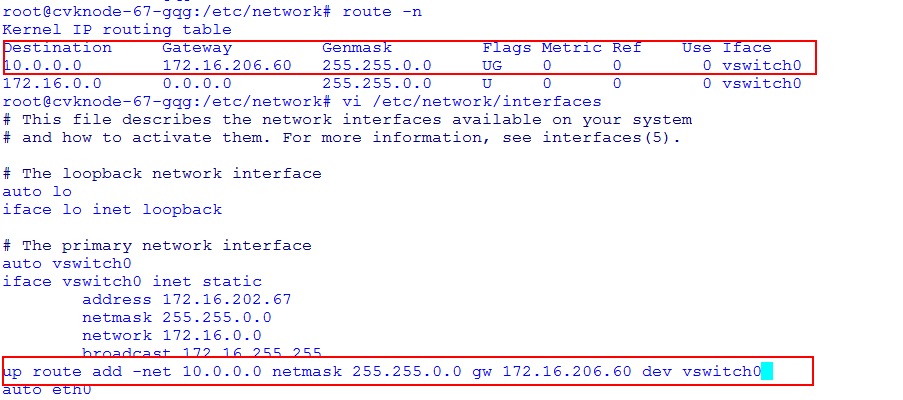
Configuration of the VM enabled with VNC proxy server:
Interaction process for opening the VM Web console
1. Enter http://10.0.0.67:8080/cas on the PC, and you can see the following NAT session information on the NAT router.
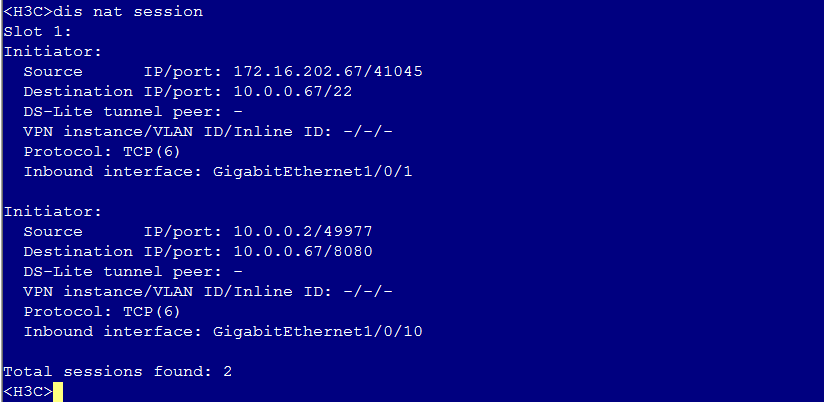
You can see that the following TCP connection is successfully established on the CVM.

2. Click the VM, and click the Web console on the console interface.
3. First, the CVM initiates an SSH connection to the VNC server at the IP address 10.0.0.67 (in this example, the VNC server and the CVM are on the same host, but the CVM does not know that 10.0.0.67 is its own external network address). After the SSH packet is translated by the NAT router, you can see the following TCP connection on the CVM, and a new NAT session added to the router. After the CVM establishes an SSH connection with the VNC server, it executes a script to inform the VNC server of the host IP address and VNC port number for this VM.

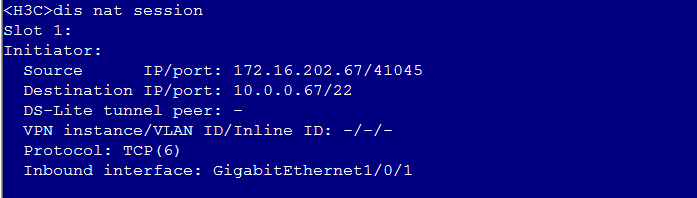
4. Initiate a TCP connection from the PC to the VNC server 10.0.0.67:8081.
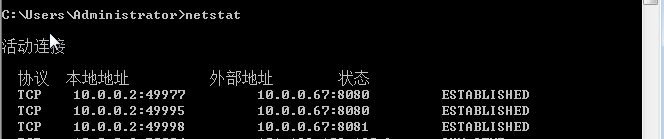
5. The VNC server knows that the VM is at 172.16.202.16 with the VNC port number 5917 based on the content of the packet from the PC and the CVM settings. It then initiates a TCP connection to 172.16.202.16:5917, starting the VNC proxy service. The PC connects to the VNC proxy server. The VNC proxy server connects to the VM through the CVK internal network IP and the VNC port number of the VM, and returns the content to the PC. The corresponding TCP connection on the CVM is as follows:
![]()
A new NAT session with port 8081 has also been created on the router.
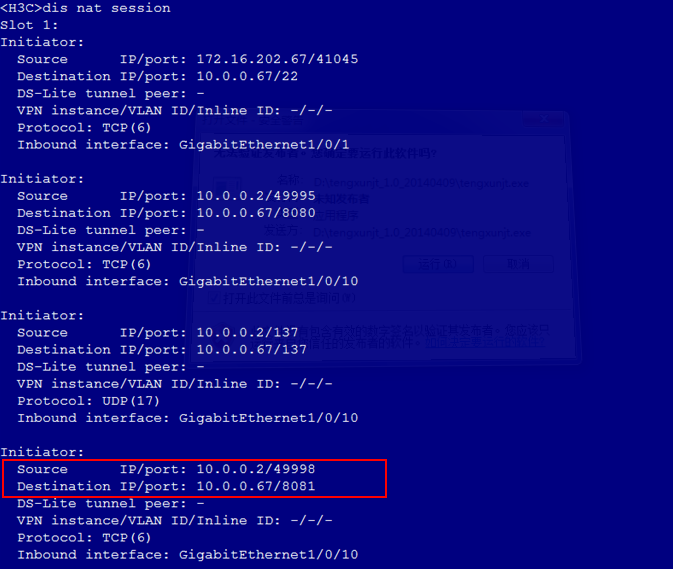
6. The Web console of the VM can now be opened correctly.

Interaction process for opening the VM Java console
If the Java console is selected:
1. The CVM initiates an SSH connection to the VNC server first (this step remains unchanged).
![]()
2. The PC initiates a TCP connection to the VNC server 10.0.0.67:6000. The port number varies depending on the virtual machine selected on the Web page. The system automatically allocates port numbers starting from 6000.
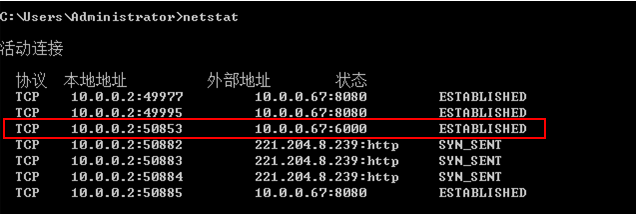
3. This step remains unchanged. After receiving the packet from the PC, the VNC proxy server initiates a connection to the target CVK 172.16.202.16:5917 based on the internal IP and VM VNC port number obtained from the CVM. The connection is as follows:
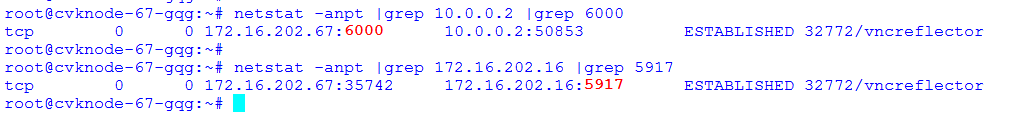
The NAT sessions on the router are as follows:

4. The Java console for the VM can be opened correctly.

|
|
NOTE: If a firewall is deployed in the path, allow port 8081 used by the Web console or the port used by the Java console to pass through. In addition, allow the SSH packets between the CVM and VNC server to pass through. |
Dual CVM environment
Network diagram
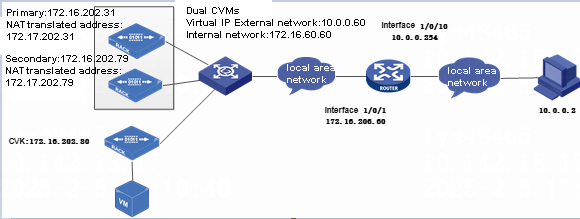
NAT configuration on the router
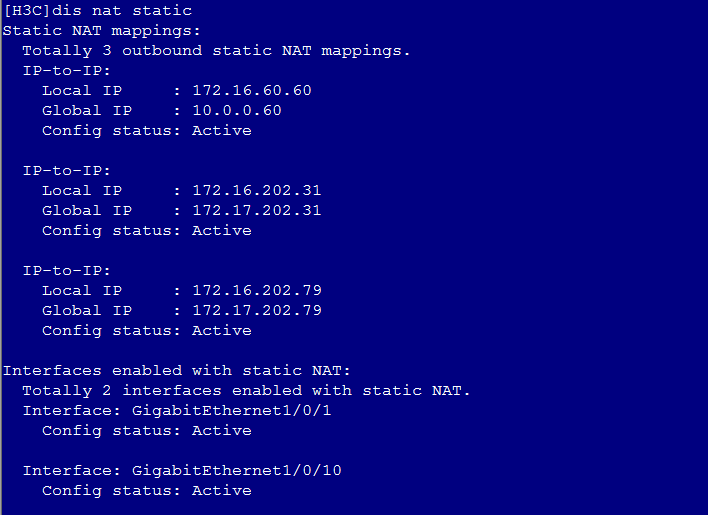
Route configuration on the primary CVM

Configuration of the VM enabled with VNC proxy
Interaction process for opening the VM Web console
1. Enter http://10.0.0.60:8080/cas on the PC, and you can see the following NAT session on the NAT device.
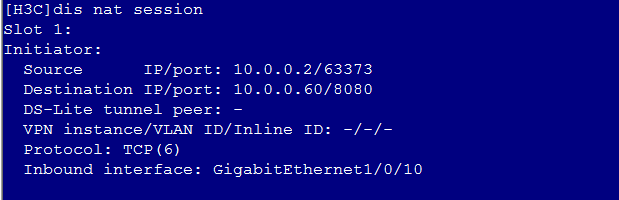
You can see that the following TCP connection is successfully established on the CVM.

2. Click the VM, and click the Web console on the console interface.
3. First, the CVM initiates an SSH connection to the VNC server at 10.0.0.60 (in this example, the VNC server and CVM are on the same server, but the CVM does not know that 10.0.0.60 is its own external network address). Unlike the SSH connection establishment process in the single CVM environment, the source address of SSH packets in the dual CVM environment is the real IP address of the primary CVM, rather than a virtual IP address. NAT translation is required on the router to translate the primary CVM's IP address from 172.16.202.31 to 172.17.202.31 (the IP address might not be an external IP address, but it must not be in the same network segment as the management network). After NAT translation for SSH packets, you can see the following TCP connection on the CVM. After the CVM establishes an SSH connection with the VNC server, it executes a script to inform the VNC server of the host IP address and VNC port number for this VM.
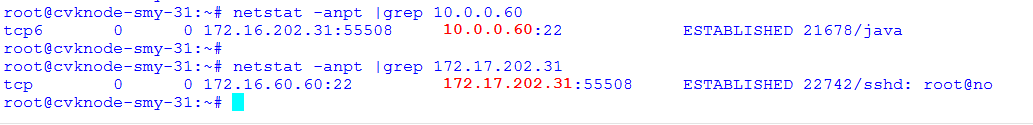
At the same time, a corresponding NAT session has been added to the router.

4. Initiate a TCP connection to the VNC server 10.0.0.60:8081 on the PC.
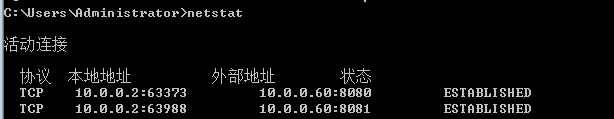
5. After receiving the packet from the PC, the VNC proxy server connects to the destination CVK 172.16.202.80:5900 based on the CVK internal network IP and VM VNC port number obtained from the CVM. The connection is as follows.
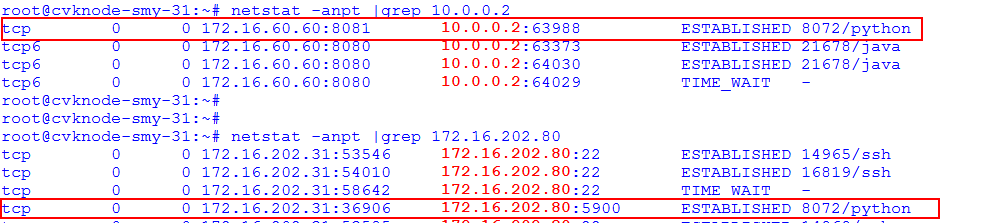
6. The VM Web console can be opened correctly.
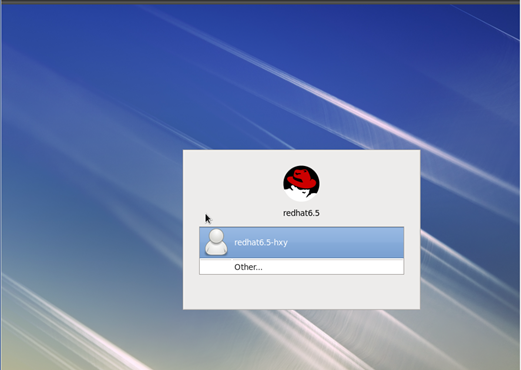
Interaction process for opening the VM Java console
The Java console in a dual CVM environment is similar to that in the single CVM environment. (Details not shown.) The difference is that the connection port number is randomly allocated starting from 6000.
|
|
NOTE: If a firewall is deployed in the path, allow port 8081 used by the Web console between PC and CVM or the port used by the Java console to pass through. In addition, allow the SSH packets between the CVM real IP address and VNC server to pass through. |
Handling common issues with plug-ins
For more information, contact H3C Support.
Common CAStools issues
In the current software version, CAStools typically includes the libguestfs tool running on CVK, castools.py and sysprep.py on CVK for importing data by invoking the libguestfs interface and relevant scripts, and the qemu-ga program running inside the VM and relevant scripts.
Libgtestfs
Libguestfs started to be used since CASE506. It has relatively few issues. So far, no major problems related to this module have been encountered. If an issue occurs, you can first check the integrity and version of the package.
Ubuntu:
root@cvknode:/var/log# dpkg -l |grep guestfs
ii libguestfs-dev 1:1.36.3-1 guest disk image management system - development headers
ii libguestfs-tools 1:1.36.3-1 guest disk image management system - tools
ii libguestfs0 1:1.36.3-1 guest disk image management system - shared library
ii python-guestfs 1:1.36.3-1 guest disk image management system - Python bindings
root@cvknode:/var/log#
CentOS:
[root@cvknode1 ~]# rpm -qa |grep guestfs
python-libguestfs-1.36.10-6.el7.centos.x86_64
libguestfs-1.36.10-6.el7.centos.x86_64
libguestfs-tools-c-1.36.10-6.el7.centos.x86_64
libguestfs-devel-1.36.10-6.el7.centos.x86_64
[root@cvknode1 ~]#
ARM CentOS:
[root@cvknode44 home]# rpm -qa|grep guestfs
libguestfs-1.36.10-6.el7.aarch64
libguestfs-tools-c-1.36.10-6.el7.aarch64
python-libguestfs-1.36.10-6.el7.aarch64
libguestfs-devel-1.36.10-6.el7.aarch64
[root@cvknode44 home]#
In addition, libguestfs relies on an appliance file, with all CVKs located in the same path.
root@cvknode:/usr/local/lib/guestfs/appliance# ls -al
total 451080
drwxr-xr-x 2 root root 4096 Apr 22 18:20 .
drwxr-xr-x 3 root root 4096 Apr 22 18:20 ..
-rwxr-xr-x 1 root root 2888192 Apr 22 18:20 initrd
-rwxr-xr-x 1 root root 7616784 Apr 22 18:20 kernel
-rwxr-xr-x 1 root root 978 Apr 22 18:20 README.fixed
-rwxr-xr-x 1 root root 4294967296 Apr 22 18:20 root
Enabling CAStools and qemu-ga debug logging
This section typically involves invoking the libguestfs interface to import data in /opt/bin/castools.py. If libguestfs is not installed correctly, the Python script might return an anomaly.
Enable the debug mode, and edit the following settings in /opt/bin/castools.conf.
[handler_LogHandler]
class=FileHandler
level=DEBUG
formatter=LogFormatter
args=('/var/log/castools.log',)
Enable debug logging for qemu-ga:
Linux: /etc/qemu-ga/qemu-ga.conf
Edit the line with #verbose=true, remove the # in front to activate it, and then save the modification and restart the qemu-ga service.
Windows: C:\program files\cas tools\qemu-ga.conf
Edit the settings in the same way as in Linux.
Full initialization and quick initialization
Description
In the CAS interface, deploy a VM and select operating system configuration. Then, the quick initialization and full initialization options are provided. In this section, CAStools is mainly used to perform offline data import by writing data to the VM disk file. Previously, an issue has occurred where a Windows VM using sysprep encapsulation for the template imported data using CAStools, and then the template failed to start. The template built by using the sysprep method does not allow system image modification before startup. CAStools also has a sysprep method. The differences are described in details below.
During VM template deployment of CAS, the operating system configuration option is enabled. Full initialization initializes the system by using the sysprep method. Quick initialization directly writes a configuration file (qemu-ga.runonce) to the VM by using castools.py.
The full CAS initialization process involves invoking sysprep.py to write a sysprep.xml file (known as the sysprep response file) into the VM. It also writes a command to invoke the system's sysprep tool to start. The principle of offline writing here is also to invoke the libguestfs interface for writing.
After the VM starts correctly, the qemu-ga program executes the command to invoke the sysprep tool. Then the system takes over the subsequent operations. The VM’s sysprep tool then shuts down and restarts. After restart, the sysprep tool initializes the system and reads the contents of sysprep.xml for configuration. After the configuration is completed, it restarts and displays the system’s welcome interface.
Sysprep is a tool provided by Microsoft, offering a function similar to resetting a computer.
Note that CAStools no longer makes any changes for the image after sysprep startup. Microsoft likely has a verification mechanism. Editing the system after sysprep will result in a failure. This is the cause of the issue.
Exhausted sysprep usages
The VM has not initiated the sysprep shutdown or restart process for a long time after startup.
A possible reason is that the qemu-ga anomaly within the VM. The command for invoking sysprep is not executed.
One possibility is that the number of sysprep usages has been exhausted. Microsoft sets the sysprep usage limit to three times in Windows 7. After using it three times, invoking sysprep will fail. In Windows 10, the usage limit is a much greater value. You can use the slmgr /dlv command to obtain the usage limit.
If the number of times becomes 0, you cannot continue to use sysprep. You can change the count by modifying the registry.
Change the value of HKEY_LOCAL_MACHINE\SOFTWARE\Microsoft\Windows NT\CurrentVersion\SoftwareProtectionPlatform\SkipRearm key to 1.
Change the GeneralizationState key value next to HKEY_LOCAL_MACHINE\System\Setup\Status\SysprepStatus\ to 7.
The quick initialization deployment process is relatively simple. It writes the corresponding configuration to the VM. After the VM starts, the qemu-ga service starts and then reads the configuration file to configure the system. That is, if the VM starts up and qemu-ga encounters an anomaly, the initialization will also fail.
Partially successful VM deployment (error code: 7501)
The frontend VM deployment shows partial deployment success, with error code 7501. Alternatively, VM information modification fails when the VM is in shutdown state.
Error code 7501 typically indicates that the execution of castools.py fails. You can check the integrity of libguestfs and look for any obvious prompt information in the /var/log/castools.log on the associated CVK.
Currently, some common reasons include:
The VM disk is damaged. Libguestfs checks disk partition information. A damaged disk cannot be mounted.
The VM is not installed with CAStools. Although libguestfs does not care about this issue, castools.py will forcefully check if the VM has CAStools installed (specifically, the qemu-ga module).
In the current software version, Libguestfs does not support the FreeBSD file system, and cannot perform associated offline data import.
When other modules or components invoke castools.pyc for VM deployment, some modules might input parameters that the castools.pyc script cannot resolve. As a result, a deployment failure occurs, and the castools.log reports an error. For more specific details, view the log.
Issues with qemu-nbd
In versions before CAS E0506, the offline modification of VMs used the qemu-nbd tool. This tool might probably fail to mount the VM disk after repeatedly mounting it. The general log is as follows:
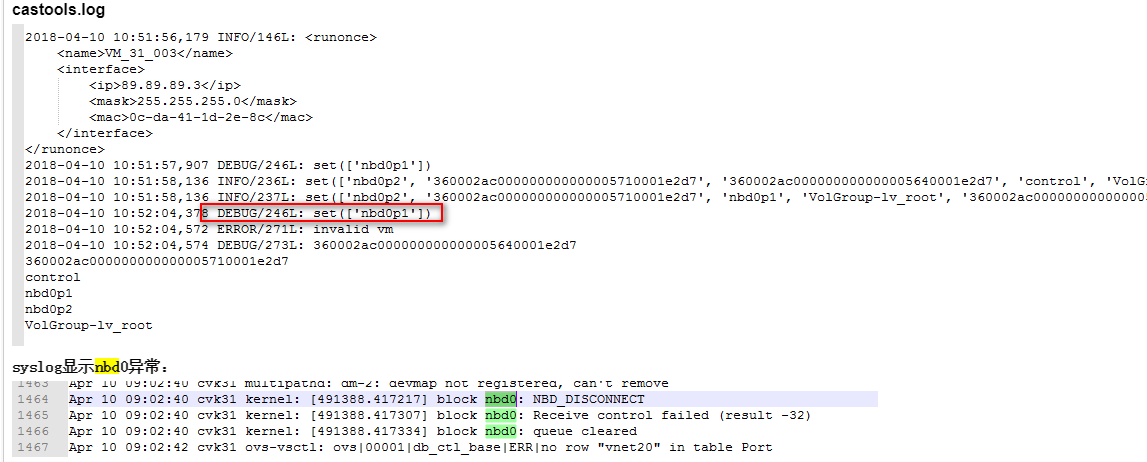
For more information, see bug ticket 201804100670. This is a known issue and the reason for using libguestfs instead of qemu-nbd later.
This issue can be temporarily resolved by migrating the VM and restarting the CVK. However, the same issue might occur again after some time. The recommended solution is to upgrade CAS to version 506 that uses libguestfs.
CAStools (qemu-ga) installation and upgrade failure
Linux system VM
The upgrading and installation of qemu-ga typically involve invoking the upgrade script CAS_tools_upgrade.sh and the installation script CAS_tools_install.sh for processing. The log is recorded in /var/log/qga-install.log. Common reasons are:
1. Previously, the optical drive of the VM system was not properly unmounted, causing the castools.iso to be mounted on the optical drive later. After it is mounted within the system, an I/O error occurs or the path after mounting is empty. This anomaly is usually resolved by restarting the VM.
2. Before installing the qemu-ga package on certain versions of the SUSE and FreeBSD systems, you need to install the dependencies. Manually install the corresponding qemu-ga package, and install the dependency packages according to the prompts.
3. The VM has installed some monitoring programs, which might cause the execution of software package installation commands to get stuck. For example, you might see that the rpm command gets stuck. The log records that the rpm lock is occupied. A log of corruption in the rpm package database might also be provided. As a best practice, temporarily enable the installation permissions for the monitoring software.
Windows system VM
A Windows VM contains the QEMU Guest Agent and the QEMU Guest Agent VSS Provider CAStools services. Make sure both services are in enabled status.
If an issue occurs during execution of the setup installation for Windows, Windows typically returns relevant information. You can generally obtain the error reason by searching online.
The main reasons are as follows:
1. Typically, if manual installation of the Windows package fails, the package has been decompressed in the CAStools path. You can check the service status by using the sc query qemu-ga command in the command window. The common reason for this installation failure is uninstalled service. You can manually change the directory to the CAStools path in the command window and run qemu-ga.exe -s install to install the service. If the installation still fails, obtain the relevant error code by searching online.
2. The installation fails because the previous uninstallation was incomplete. In this situation, after you enter the sc query qemu-ga command in step 1, the system returns that one of the two CAStools services is not uninstalled. First, manually stop the service that is not uninstalled, and then uninstall it.
To stop the service, use sc stop qemu-ga (or sc stop "QEMU Guest Agent VSS Provider”)
To uninstall the service, use qemu-ga.exe -s uninstall (or qemu-ga.exe -s vss-uninstall).
Then, proceed with the normal installation.
3. The Qemu-ga service depends on Windows services Windows Management Instrumentation, Windows update, and Volume Shadow Copy. If these services are not running, the installation will fail. To resolve this issue, you need to manually start the services in Windows Services.
4. During the installation process, The js script or bat script cannot be opened. This is typically caused by default executable script modification with some text editors installed in the system, such as UltraEdit. To resolve this issue, set the text editor content in the default opening method for js or bat files to the default value in the Windows registry. To do so, open the registry editor, locate HKEY_CLASSES_ROOT > .js, double-click the default value and change the value to JSFile. Modify other default values in the same way.
Auto upgrade
CAStools automatically performs upgrades at 1:00 a.m (Beijing time). in the morning upon VM startup. If the time zone has been changed in the VM, the time needs to be converted. Typically VM startup is when the qemu-ga service starts. The previous information can explain a few issues. Sometimes, a VM does not restart, but an unexpected reboot of the internal qemu-ga causes CAStools to restart automatically.
CAStools auto upgrade depends on the following conditions: 1. Turn on the relevant VM switch in CAS. 2. Make sure the libvirtd and virtagent (available in E0520 and later versions) services on CVK are running correctly. 3. The qemu-ga service is running correctly within the VM. 4. The optical drive of the VM does not have any anomalies.
CAStools operation
Many issues can lead to this result at the front end of CAS. The main causes are: 1. Qemu-ga anomaly within the VM. 2. An anomaly in the communication channel between the VM and CAS.
If a qemu-ga anomaly occurs within the VM, first check if the VM is normal through the console. If the VM is abnormal, the qemu-ga acting as a user program is definitely abnormal.
If the VM does not have any anomalies, verify that CAStools is installed. If CAStools is not installed, it is shown as not running at the front end.
You must also troubleshoot viruses in the VM system.
Linux system qemu-ga issue
Currently, no major issues have been found in qemu-ga of Linux. However, you need to pay attention to the following information:
1. Some Linux distributions come with the pre-installed, open-source version of the qemu-ga program. Running both programs might result in anomalies, such as CAStools is not running. You can check the version with the qemu-ga --version command, and locate the path with which qemu-ga. Typically the open-source path is /usr/bin/qemu-ga, and our path is /usr/sbin/qemu-ga. Then uninstall the open-source version and restart the qemu-ga service for the service to run correctly.
2. The VM contains vmtools or open-vm-tools. These tools conflict with qemu-ga and typically need to be uninstalled.
Windows system qemu-ga issue
Although the Windows system is relatively stable, troubleshooting can be difficult due to the complex operations within the VM. Most issues are caused by the Windows environment.
1. If the Windows system experiences an anomaly with qemu-ga operation, qemu-ga has a mechanism to generate a dump file named qemu-ga.dmp in the CAStools installation path. You can obtain the error cause by debugging this file with WinDbg.
2. The VM antivirus software restricts or deletes qemu-ga. You can set qemu-ga to be trusted when select the processing method for it. If you do not trust it, you can add qemu-ga to the associated allowlist in the antivirus software.
VM and CAS communication failure
The qemu-ga in the VM communicates with the qemu on the CVK through a specific channel.

This channel is a socket on the CVK and a serial port within the VM. The serial port types include virtio-serial and standard serial port isa-serial. By default, the virtio serial port is used. It is a dedicated communication channel between qemu and qga. For some Linux VM kernels of older versions that lack virtio serial drivers, a standard serial channel must be used instead. The main issue with using a standard serial channel is that it is typically shared with the VM system. A significant amount of data interference might exist. The Windows system currently installs the virtio driver upon installing CAStools, so this issue does not exist.
Common issues:
1. No solution is available for the common serial port issue with the Linux kernel. Typically after the VM runs stably, qemu-ga can communicate correctly.
2. The VM name is too long. As a result, the CAS-side socket name is also too long, and libvirt cannot open the socket. This issue has been restricted at the front end, but some older CAS versions might use Chinese VM names. The English name cannot exceed 80 characters, and the Chinese name cannot exceed 26 characters. In addition, the name does not support ampersand (&), less than signs (<), or greater than signs (>).
3. The VM serial port has an anomaly, which has occurred in the Windows environment. In device management, you can see a yellow exclamation mark next to the virtio serial port, and the properties show that this device is faulty. In this situation, you can manually choose to update driver on the device, and select the CAStools installation path for the driver path.
When this issue last occurred, the cause was error in graphics card driver loaded by VDI for the vGPU in the vGPU environment, leading to anomalies in some devices in device management. The issue was resolved by vGPU driver modification.
The Qemu-ga log shows error opening channel.
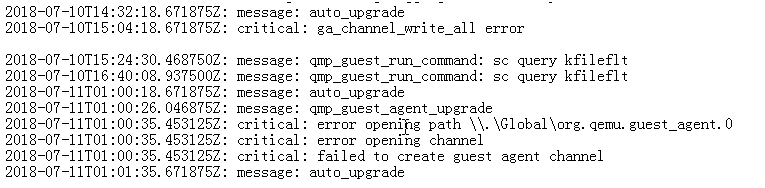
This issue occurs with a certain probability in versions prior to E0526. The solution is to restart the qemu-ga service within the VM. The reason for this issue is that qemu-ga opens the serial port while the virtio serial port initialization is not yet completed within the VM. After E0526, waiting and retrying were added to the code to basically mitigate this issue. The open-source version also has this issue.
Performance monitoring data anomaly
Performance data not displayed
The performance monitoring and process service monitoring data at the CAS frontend interface is obtained through the qemu-ga command. You can use guest-info to obtain more supported qga commands.
Performance monitoring data is obtained by HA invoking the qga command to query VM-related information. Then, HA processes the return value, and the front end retrieves data from HA. The frontend data exception might be related to the frontend, HA, and qga commands.
First, make sure qga is installed and running correctly. Troubleshoot the qga command by verifying that you can obtain data directly through the command at the backend.
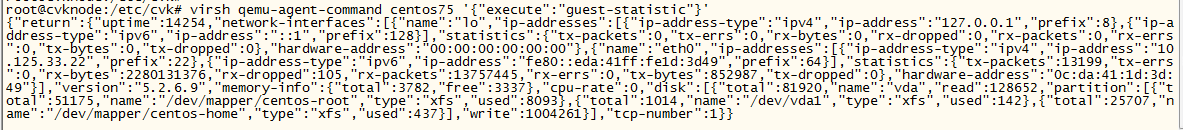
This command returns almost all the information on the performance monitoring interface.
The old CAS version, such as E0306, cannot obtain data because timeout for the command return is considered an execution error. Later, with a timeout timer added, this issue is resolved. The timeout timer is set to 10 seconds.
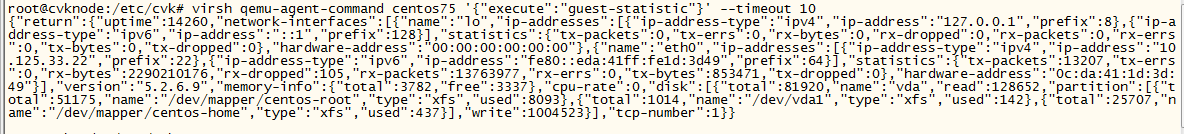
Some commands require setting a timeout timer, because a long internal processing time in the VM might cause an error value returned. For example, execute the ping command inside the VM by using "guest-run-command".
The process service monitoring is similar to the previous process except that "guest-get-process-info" is executed.
If the backend data is normal, contact the HA personnel to proceed with the analysis. If the data is abnormal, see issue 5.
Inaccurate performance data
Inaccurate performance data is typically due to incorrect memory usage and disk usage. You can display data on the frontend interface as follows: If the VM is installed with CAStools that is running correctly, data is obtained through the qga command. If CAStools is not installed or qga has an anomaly, the displayed data is obtained through the backend libvirt command. The obtained data and the actual data within the VM might be different.
Additionally, the older qemu-ga version has some issues with data statistics.
1. An issue with calculating the memory usage within VMs also exists. The issue has been fixed in the new version, mainly addressing the inaccurate remaining memory size in the Linux system.
2. The Windows VM monitors process service data. If a single process occupies over 4 GB of memory, an overflow issue occurs, causing an anomaly in the display. The new version has fixed this issue.
3. If a VM is running correctly and a hard disk or partition is added, old qga versions might not immediately identify it unless you restarting qga. The new version has fixed this issue.
4. In addition, in certain cases, CAS uses the libvirt back end to obtain the usage information. For example, edit disk usage for the VM. The data is also related to disk pre-allocation.
VM template creation issues
Initialization failure for VM template deployment is typically due to issues with template creation. When creating a template, make sure the VM is shut down normally. You can either shut down the VM or use the security shutdown option on the CAS interface. Powering down the VM is similar to unplugging the power cord on a PC, which can cause unexpected issues.
A common symptom to the template after you directly power off the VM is that Windows will pause for 30 seconds during startup, asking you to select normal start or disk check. The Windows VM syslog will display a message that the system was unexpectedly shut down last time.
Additionally, when creating a new template version from an older version, as a best practice, restart the system after installing CAStools. This is because the virtio driver is updated for some versions, and the driver takes effect upon system restart. As a best practice, upon a restart, make sure qemu-ga is operating correctly before creating a template through secure shutdown.
When creating a template, before shutting down, first refresh the CAS front end to check if CAStools is running correctly. If it is prompted as not running, the subsequent templates that require CAStools for initialization-related functions will definitely have problems.
Additionally, in specific scenarios, creating a template requires the Windows system to set the network to DHCP mode. For more information, see the associated CAS manual.
Windows CAStools (qemu-ga) domain joining issues
The domain joining issues currently refer to the issues of domain joining for Windows systems currently supported by CAS.
The issues encountered upon joining a Windows domain, in most cases, are caused by template creation. Directly powering down might cause various unpredictable issues, making troubleshooting difficult. Typically, in the Windows syslog on the template VM, you can see messages like Windows was unexpectedly shut down last time. In such cases, recreate the template. If the sysprep method is used, the log is generated during VM deployment. It disappears upon system initialization, which makes it even more troublesome.
Domain joining is achieved through full initialization or quick initialization. Full initialization invokes the built-in system tool sysprep for domain joining (Windows XP requires manual copying of this tool into the system), and CAStools only imports the sysprep response file. Quick initialization uses qemu-ga to invoke Windows API for domain joining. The sysprep response file template is located at /etc/cvk/win7_x64_sysprep.xml.tmpl on the CVK. For more information about sysprep, see the official Microsoft documentation at https://msdn.microsoft.com/zh-tw/library/windows/hardware/dn938331(v=vs.85).aspx.
The major difference is that the sysprep tool regenerates the system SID (Security Identifiers) after deploying a VM, while the quick initialization method does not do the same. The SIDs are used to uniquely identify computer accounts. In certain scenarios, make sure the uniqueness of the SIDs.
If the domain joining failure is not related with the template, perform the following analysis:
1. Check if the VM can ping the domain name server, DNS resolution is normal, and the domain name can be pinged.
2. Check the domain controller settings for duplicate computer names or computers with the same SPN. Alternatively, during testing, avoid repeatedly using the same computer name to adding and deleting it from the domain.
3. Check for errors in the syslog. If errors exist, examine the return code. Check the return value of the domain joining function in C:\\program file\\CAS tools\\qemu-ga.log. Then, check the error code. For issues with the Windows system, check Microsoft documents online.
4. Analyze the Windows domain joining log. The log C:\\windows\\debug\\NetSetup.LOG is critical and contains detailed records. As a best practice, compare it with the related logs in the normal environment for analysis.
Anomaly on a Windows VM triggers a dump
When a Windows VM anomaly occurs, qemu-ga might be considered as the cause, because the Windows VM environment is complex and is installed with qemu-ga.
In fact, qemu-ga is just a user-level program. It has little impact on the system, even if it crashes upon an anomaly. In most cases, Windows VM anomaly is caused by system anomalies, and qemu-ga is also a victim. Currently, only the old qemu-ga version has a memory leak issue. This issue will be triggered only in special scenarios and will cause qemu-ga to occupy more and more memory. As a result, the system will restart qemu-ga. Strictly speaking, such issue will not cause system anomalies.
The term dump in this section refers to dump the abnormal VM. It collects information about the VM memory system and is not related to qemu-ga.dmp. Please pay attention to the difference.
Configure the VM
Go to Computer > Properties > Advanced System Settings > Startup and Recovery, and enable the kernel memory dump service.
If the memory size of the VM is large, the remaining space on the C drive should also be large, approximately 1.5 times the memory. Otherwise, the configuration might fail. The dmp file is stored at C:\windows\minidump\memory.dmp.
Operations in the CVK background
Execute the root@cvknode:/etc/cvk# virsh inject-nmi VMName command. The VMName argument represents the name of the desired VM.
Then, you can see the VM’s screen becomes blue, collect information about the memory system. After information collection, analyze the dmp file with WinDbg.
VM initialization fails after template deployment
When you deploy a VM or edit its configuration offline, everything seems normal. However, when the VM starts, qemu-ga reads the configuration file and encounters mistakes during configuration, such as IP configuration error and user adding error. There are two major causes for this issue:
1. The VM is a Linux VM with old-version kernel, so it doesn't support virtio serial ports and can only work with regular serial ports. When the system writes data to serial ports after the VM starts, qemu-ga also reads data from the serial ports. This causes the data content and format read by qemu-ga to be disrupted, leading to a failure in parsing JSON data in the background and finally resulting in a configuration failure. In this case, there will be numerous parsing errors related to JSON data format in the qemu-ga.log file. Currently, there is no solution to this issue. As a best practice to avoid this issue, configure network settings and other corresponding settings on the Web CAS management interface after the VM starts up normally and qemu-ga works properly. The FreeBSD system also experiences this issue.
2. Old-version Windows might have exceptions during initialization. The initialization fails if the operating system restarts unexpectedly. Roughly speaking, when qemu-ga is reading data for configuration, this process is interrupted because of system restarting. After the system completes restarting, qemu-ga cannot continue the configuration. This issue occurs rarely and is already processed. Its probability of occurrence gets much lower after processing. If this issue occurs, delete the failed VM and redeploy a VM, or create a new template.
Failure to obtain MAC address information after login to the CAS management interface
Install CAS on two VMs separately to implement nested virtualization and set up a dual-VM scenario. CAStools synchronizes MAC address information from CAS installed on the host to CAS on the VM. After obtaining MAC address information, the VM runs the following scripts:
· host_run_command.pyc, which runs on CAS of the host server.
· get_host_mac.pyc, which runs on CAS of the VM. To install CAS on a VM, enable serial port debugging for the VM on the corresponding host.
One common issue is that the CAS login interface of the VM gets stuck. This issues mostly because serial port debugging is disabled for the VM.
Another issue is that the login interface prompts a failure to obtain MAC address information from the host. In most cases, this issue occurs if the host_run_command script stops running on the host after the VM fails to obtain MAC address information from the host by executing the get_host_mac command. The main log is saved on the host at /var/log/dev_pts_x.log, where x represents the TTY port number. For example, after serial port listening is enabled and the VM CAS is logged in, CAS starts obtaining MAC address information by execute the get_host_mac script. (For illustration only. No manual execution is required on the background.)
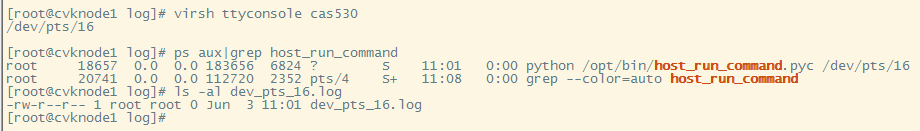
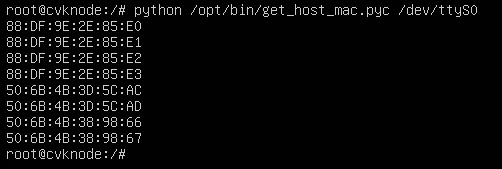
This issue occurred once before: VM ttyS0 was occupied and CAS login on the Web page failed. After VM ttyS1 was used in the background, this issue was resolved.
Antivirus proxy
Antivirus proxy services are all provided by third-party vendors. During CAStools installation on a VM, CAStools just places the antivirus software inside the VM, but the software is not installed by default. Only after the antivirus service is enabled on the CAS interface, the foreground uses the qga command to call the background script or command to install the antivirus proxy service.
Currently, the antivirus proxy service of AsiaInfo is used in most cases. This service is compatible with Windows systems and Linux systems (including 64-bit CentOS 7.1, CentOS 7.2, and Ubuntu 16.04).
Other common issues and operations related with CASTools
Activate Sysprep
For Windows, you can use one key to activate only one device. Therefore, templates created with genuine keys still require activation after deployment. You cannot use one key to activate multiple devices through a template, except for OEM keys. Some device templates activated by KMS seem to be deployable. When CAS uses Sysprep for deployment, there is an interface for entering the activation key.
IP-MAC binding
Configuring the IP-MAC binding function on the CAS interface does not cause CAStools to configure the network. This function only binds IP addresses to MAC addresses, without configuring the intra-VM network.
View the version of qemu-ga
To view the qemu-ga version (and the CAStools version) on a VM, use one of the following methods: Linux: Use the qemu-ga --version command.
Windows: Right click the qemu-ga.exe file, select Properties > Details. The file version represents the version number.
Windows error codes
Currently, you can troubleshoot a Windows qemu-ga issue as follows:
1. View the error code prompted by the system.
2. Look up Microsoft's official documentation for possible causes.
3. Search for a solution.
Troubleshooting common SRM issues
After the storage array manager is configured, synchronization of device replication relationships fails on the site management page
This issue occurs if no CVK hosts are added to the primary or secondary site. Identify whether the primary and secondary sites have SRA-capable CVK hosts. You can perform this check by executing the SRA command on CVK hosts to access Macrosan storage.
If no SRA-capable hosts exist, all SRA operations will fail.
After the SRM configuration completes, two LUNs are created on the storage servers of the primary and secondary sites and they form a replication pair. However, the two LUNs cannot be found when you configure storage mappings for a protection group
To resolve this issue, verify that synchronization of device replication relationships has been performed on the site management page. If the synchronization has been performed, identify whether the storage array manager list contains the newly-added LUNs on the site management page.
After executing a reverse recovery task, a non-SRA storage program executes another scheduled recovery task. However, the execution fails and an error message is prompted
Non-SRA storage programs do not automatically synchronize LUN information. Before each recovery task, manually synchronize LUN information. If you do not manually synchronize LUN information before a reverse recovery task, the task will fail to be executed.
During the execution of a scheduled recovery task, the system prompts a failure to increase LUNs
· Verify that the snapshot feature is enabled for all LUNs related with the primary and backup sites on the storage server.
· Verify that the number of LUN snapshots created for the primary and backup sites has not reach the upper limit on the storage server.
· Verify that the automatic saving time is enabled for all LUNs related with the primary and backup sites on the storage server.
· Identify whether manual LUN information synchronization was performed before.
· Verify that the secondary site has a minimum of one CVK host that can access the storage device configured for the protection group. You can check whether the storage adapter ID used by the CVK host in the backup site exists on the initiator associated with the target client of the storage server.
After a recovery task is complete, some VMs fail to be restored
For non-SRA storage, this issue might occur if LUN information is not synchronized before the recovery task is executed.
When the system restores multiple VMs synchronously, some of them might fail to start because CVK is busy. To resolve this issue, restore the affected VMs again in the recovery wizard.
If disaster recovery is performed shortly after some VMs in the protected group are migrated, VM recovery will fail because LUN information has not been synchronized from the migrated VMs to the backup site.
When a recovery task is executed, a storage task pauses and fails
If storage resources are occupied by an
active process, storage tasks will pause and fail. For example:
Outside the protected group storage, an active optical drive of a VM uses files
within the protected group storage. An operator establishes an SSH session to
the storage directory and does not exit.
A VM meets the mapping requirements of the protection group, but cannot join the protection group
To resolve this issue:
· Check for a VM with the same name in the recovery site.
· Verify that the VM does not use any of the following: USB devices, PCI devices, pass-through NICs, TPM devices, optical drives, floppy drives, or physical CPUs.
· If the VM uses multi-level storage, verify that all its files are placed in the storage resources of the protection group.
· Verify that the VM is deployed by neither a fixed desktop pool in protection mode nor a floating desktop pool. If a VM is deployed by a fixed desktop pool in protection mode or a floating desktop pool, it cannot join the protection group.
Troubleshooting issues caused by LUN ID modification
Symptom
Before the CAS cloud platform uses a storage array device, you need to configure multiple LUNs on the storage array and map them to CVK hosts on CAS. A CVK host scans the storage adapter to obtain information about these LUNs. The LUN information is then mounted as shared files on the CVK host or as block devices on VMs. If you create LUNs on a storage device, a globally unique identifier (wwid) is automatically assigned. It is not easy to change the wwid of a LUN on the storage device, so wwid changes rarely occur.
When the storage array associates a LUN with a host, a LUN ID is automatically generated. By default, the LUN ID cannot exceed 254 on the host-side. This LUN ID is crucial for SCSI block devices that run the Linux system because those devices need to identify different LUNs by LUN ID.
An inexperienced or careless storage operator might cancel the host mapping permissions of in-use LUNs, and then assign permissions to them again. In such situation, the storage system will automatically assign LUN IDs to those LUNs. As a result, the IDs of the affected LUNs might change, causing disk data overwriting, file system damage, or data corruption.
For example, the initial LUN ID of LUN 360002ac0000000000000000d0001301e is 0. After a misoperation on the storage device, the LUN ID of LUN 360002ac000000000000000420001301e is changed to 0, and the LUN ID of LUN 360002ac0000000000000000d0001301e is changed to 5.
If the host side does not notice this change, data destined for LUN 360002ac0000000000000000d0001301e might be written to LUN 360002ac000000000000000420001301e. As a result, the original data of LUN 360002ac000000000000000420001301e will be overwritten and corrupted.
Detailed analysis is as follows: After execute the following command, you can find that multipath device 360002ac0000000000000000d0001301e stores data at LUN 0.
root@dqq-cvk14:~# multipath -ll /dev/dm-1
360002ac0000000000000000d0001301e dm-1 3PARdata,VV
size=100G features='1 queue_if_no_path' hwhandler='0' wp=rw
`-+- policy='round-robin 0' prio=1 status=active
|- 2:0:3:0 sddm 71:64 active ready running
|- 4:0:3:0 sddo 71:96 active ready running
|- 2:0:0:0 sdd 8:48 active ready running
|- 4:0:0:0 sdc 8:32 active ready running
|- 2:0:1:0 sdaq 66:160 active ready running
|- 4:0:1:0 sdao 66:128 active ready running
|- 2:0:2:0 sdca 68:224 active ready running
`- 4:0:2:0 sdcc 69:0 active ready running
However, an inconsistency exists when you use the commands below to view the wwid corresponding to the actual drive letter of the SDD drive.
The following command retrieves the actual wwid of the storage device.
root@dqq-cvk14:~# /lib/udev/scsi_id -g -u /dev/sdd
360002ac000000000000000420001301e
The following wwid recorded by udev is incorrect, possibly because the storage device does not trigger automatic udev wwid update on the host side.
root@dqq-cvk14:~# udevadm info --query=all --name=/dev/sdd
P: /devices/pci0000:00/0000:00:1c.0/0000:0a:00.0/host2/rport-2:0-4/target2:0:0/2:0:0:0/block/sdd
N: sdd
S: disk/by-id/scsi-360002ac0000000000000000d0001301e
S: disk/by-id/wwn-0x60002ac0000000000000000d0001301e
S: disk/by-label/o20170107111847
S: disk/by-path/pci-0000:0a:00.0-fc-0x21110002ac01301e-lun-0
S: disk/by-uuid/a4249f29-f8ac-413b-a05b-790cc98acd16
E: DEVLINKS=/dev/disk/by-id/scsi-360002ac0000000000000000d0001301e /dev/disk/by-id/wwn-0x60002ac0000000000000000d0001301e /dev/disk/by-label/o20170107111847 /dev/disk/by-path/pci-0000:0a:00.0-fc-0x21110002ac01301e-lun-0 /dev/disk/by-uuid/a4249f29-f8ac-413b-a05b-790cc98acd16
E: DEVNAME=/dev/sdd
E: DEVPATH=/devices/pci0000:00/0000:00:1c.0/0000:0a:00.0/host2/rport-2:0-4/target2:0:0/2:0:0:0/block/sdd
E: DEVTYPE=disk
E: ID_BUS=scsi
E: ID_FS_LABEL=o20170107111847
E: ID_FS_LABEL_ENC=o20170107111847
E: ID_FS_TYPE=ocfs2
E: ID_FS_USAGE=filesystem
E: ID_FS_UUID=a4249f29-f8ac-413b-a05b-790cc98acd16
E: ID_FS_UUID_ENC=a4249f29-f8ac-413b-a05b-790cc98acd16
E: ID_FS_VERSION=0.90
E: ID_MODEL=VV
E: ID_MODEL_ENC=VV\x20\x20\x20\x20\x20\x20\x20\x20\x20\x20\x20\x20\x20\x20
E: ID_PATH=pci-0000:0a:00.0-fc-0x21110002ac01301e-lun-0
E: ID_PATH_TAG=pci-0000_0a_00_0-fc-0x21110002ac01301e-lun-0
E: ID_REVISION=3213
E: ID_SCSI=1
E: ID_SCSI_SERIAL=1677854
E: ID_SERIAL=360002ac0000000000000000d0001301e
E: ID_SERIAL_SHORT=60002ac0000000000000000d0001301e
E: ID_TYPE=disk
E: ID_VENDOR=3PARdata
E: ID_VENDOR_ENC=3PARdata
E: ID_WWN=0x60002ac000000000
E: ID_WWN_VENDOR_EXTENSION=0x0000000d0001301e
E: ID_WWN_WITH_EXTENSION=0x60002ac0000000000000000d0001301e
E: MAJOR=8
E: MINOR=48
E: MPATH_SBIN_PATH=/sbin
E: SUBSYSTEM=block
E: UDEV_LOG=3
E: USEC_INITIALIZED=10795620
Restrictions and guidelines
For CAS and other Linux systems, if LUNs of a storage device are in use by hosts and you attempt to perform a storage operation, make sure the operation will not cause LUN ID changes to the host side. CAS does not delete drive letter information for corresponding LUNs when a storage pool is suspended. Therefore, LUN ID modification is not supported for a storage pool when the storage pool is suspended.
Changing the LUN ID of an in-use LUN will result in data corruption. Be cautious when you perform storage operations.
Solutions
The new CAS version uses the following mechanisms to prevent severe data damage:
· When a file system error occurs, the system automatically enters read-only state to prevent further data corruption.
· Under certain conditions, the multipath feature automatically changes the state of the drive letter path to fail if it finds that the wwid of the drive letter path and the drive letter of dm are different. The prerequisite for this action is that storage device changes must trigger udev wwid updates on the host side.
Scenario 1: Before LUN ID modification on a storage device, what operations are required by the hosts on CAS?
1. On CAS, delete the storage pools that need LUN ID modification.
2. Modify the LUN Ids as needed on the storage device.
3. When you add storage pools on CAS again, CAS automatically scans the storage adapters to obtain new drive letter information from storage device.
Scenario 2: Before LUN deletion on a storage device, what operations are required by the hosts on CAS?
1. On CAS, identify whether the storage pools corresponding to the LUNs that need to be deleted. If some data in those storage pools are necessary, have a data backup.
2. Determine the LUNs to be deleted from the storage device, and cancel their host mappings. Record the hosts associated with those LUNs, and verify that no service interruption will occur after lUN deletion. After confirmation, delete the LUNs from the storage device.
3. As best practice, perform a normal scan on the storage adapter management page of each associated host on CAS. This operation eliminates remaining disk letter path information and thus avoids unnecessary log generation for invalid disk letters. Otherwise, you can clear remaining disk letter path information only when the system performs a new storage adapter scan, for example, when a new LUN is added.
Commonly used commands
CAS commands
HA commands
H3C CAS provides HA features. The following are the commonly used HA commands.
All the following commands, except for the cha -k set-loglevel level command run on a node CVM is deployed. The cha -k set-loglevel level command runs on a CVK host.
Obtaining the clusters managed by the HA process
cha cluster-list
Example:
root@UIS-UISManager:~# cha cluster-list
------------------------------------------------------------
HA database info:
Cluster list:
cluster:1, name:Cluster
HA memory info:
Cluster list:
cluster ID: 1
Obtaining state statistics for a cluster
You can obtain information for hosts and VMs in a cluster.
cha cluster-status cluster-id
Example:
root@UIS-UISManager:~# cha cluster-status 1
------------------------------------------------------------
HA database info:
Cluster 1 information:
Is HA enabled: 1
Cluster priority: 1
2 nodes configured
6 VM configured
host and vm list:
Host:UIS-CVK01, vm:windows2008
Host:UIS-CVK02, vm:win2008
Host:UIS-CVK02, vm:rhce-lab
Host:UIS-CVK02, vm:Linux-RedHat5.9
Host:UIS-CVK02, vm:fundation1
Host:UIS-CVK02, vm:win7
HA memory info:
Cluster 1, Least_host_number(MIN_HOST_NUM) is 1.
Obtaining information for hosts in cluster
You can obtain information for hosts and VMs in a cluster.
cha node-list cluster-id
Example:
root@UIS-UISManager:~# cha node-list 1
------------------------------------------------------------
HA database info:
In cluster 1, node list :
host: UIS-CVK01, in cluster: 1, IP: 192.168.11.1
host: UIS-CVK02, in cluster: 1, IP: 192.168.11.2
HA memory info:
Cluster 1, Least_host_number(PermitNum) is 1. hosts list:
host: UIS-CVK02 ID: 4
host: UIS-CVK01 ID: 3
Total host num in this cluster is: 2
Obtaining information for a host in a cluster
cha node-status host-name
Example:
root@UIS-UISManager:~# cha node-status UIS-CVK01
------------------------------------------------------------
HA database info:
Node UIS-CVK01 :
in cluster: 1
ip address: 192.168.11.1
VM count: 1
HA memory info:
Host: UIS-CVK01, ID: 3, IP address: 192.168.11.1
status: CONNECT
heart beat num: 101
storage total num: 1
storage fail num: 0
heartbeat fail num: 0
recv packet: 1
host model(maintain): 0
time statmp: Fri Jan 30 15:34:04 2015
Storage info:
storage name:sharefile path:/vms/sharefile
storage status:STORAGE_NORMAL
time stamp:0
update flag:0
last send flag:0
fail num:0
Obtaining information for a VM on a host
cha vm-list host-name
Example:
root@UIS-CVK03:~# cha vm-list UIS-CVK01
------------------------------------------------------------
HA database info:
1 vms in host UIS-CVK01 :
vm: windows2008 ID: 11 HA-managed: 1 Target-role: 1
Obtaining information for a VM in a cluster
cha vm-status vm-name
Example:
root@UIS-CVK03:~# cha vm-status windows2008
------------------------------------------------------------
HA database info:
vm ID: 11 name: windows2008
at node ID: 3
target-role: 1
is-managed: 1
prority: 1
storage name: sharefile
storage psth: /vms/sharefile
Setting the log level
cha set-loglevel module level
Parameters:
· cmd|UIS managerd—Sets the log level for the cmd or UIS Manager process.
· level—Specifies the log level, including debug, info, trace, warning, error, and fatal.
Example:
root@UIS-UIS Manager:~# cha set-loglevel info
Setting the log level for a CVK host
cha -k set-loglevel level
Parameters:
· level—Specifies the log level, including debug, info, trace, warning, error, and fatal.
Example:
root@UIS-CVK01:/vms/sharefile# cha -k set-loglevel debug
Set cvk log level success.
root@UIS-CVK01:/vms/sharefile#
vSwitch commands
The following are the basic commands for vSwitches in CAS.
Obtaining the internal version number of a vSwitch
root@hz-cvknode2:~# ovs-vsctl -V
ovs-vsctl (Open vSwitch) 2.9.1
DB Schema 7.15.1
Displaying status of processes related to a vSwitch
Execute the ps aux | grep ovs command on a CVK host, where ovs_workq is an OVS kernel process, and ovsdb-server and ovs-vswitchd represent a monitor process and service process, respectively.
root@UIS-CVK01:~# ps aux | grep ovs
root 2207 0.0 0.0 0 0 ? S Dec07 0:00 [ovs_workq]
root 3411 0.0 0.0 23228 772 ? Ss Dec07 6:44 ovsdb-server: monitoring pid 3412 (healthy)
root 3412 0.0 0.0 23888 2656 ? S Dec07 6:15 /usr/sbin/ovsdb-server /etc/openvswitch/conf.db --verbose=ANY:console:emer --verbose=ANY:syslog:err --log-file=/var/log/openvswitch/ovsdb-server.log --detach --no-chdir --pidfile --monitor --remote punix:/var/run/openvswitch/db.sock --remote db:Open_vSwitch,Open_vSwitch,manager_options --remote ptcp:6632 --private-key=db:Open_vSwitch,SSL,private_key --certificate=db:Open_vSwitch,SSL,certificate --bootstrap-ca-cert=db:Open_vSwitch,SSL,ca_cert
root 3421 0.0 0.0 23972 804 ? Ss Dec07 7:23 ovs-vswitchd: monitoring pid 3422 (healthy)
root 3422 0.4 0.0 1721128 9364 ? Sl Dec07 55:24 /usr/sbin/ovs-vswitchd --verbose=ANY:console:emer --verbose=ANY:syslog:err --log-file=/var/log/openvswitch/ovs-vswitchd.log --detach --no-chdir --pidfile --monitor unix:/var/run/openvswitch/db.sock
root 23503 0.0 0.0 8112 936 pts/10 S+ 10:43 0:00 grep --color=auto ovs
Restarting a vSwitch
root@UIS-CVK01:~# service openvswitch-switch restart
Adding a vSwitch
root@UIS-CVK01:~# ovs-vsctl add-br vswitch-app
After a vSwitch is added successfully, you can see the vSwitch on UIS Manager after connecting all hosts on UIS Manager.
Deleting a vSwitch
root@UIS-CVK01:~# ovs-vsctl del-br vswitch-app
A vSwitch cannot be deleted from UIS Manager after it is deleted from the CVK host.
Adding a port for a vSwitch
root@UIS-CVK01:~# ovs-vsctl add-port vswitch-app eth2
Deleting a port from a vSwitch
root@UIS-CVK01:~# ovs-vsctl del-port vswitch-app eth2
The port on a vSwitch cannot be deleted from UIS Manager after it is deleted from the CVK host.
Displaying vSwitch and port information
vswitch0 is an internal port (or local port), eth0 is a physical port, and vnet0 is a vSwitch port.
root@UIS-CVK01:~# ovs-vsctl show
ba390c40-8826-4a7a-8e17-f8834dab6eb3
Bridge "vswitch0"
Port "eth0"
Interface "eth0"
Port "vswitch0"
Interface "vswitch0"
type: internal
Port "vnet0"
Interface "vnet0"
root@UIS-CVK01:~#
Displaying the configuration on a vSwitch
root@UIS-CVK01:~# ovs-vsctl list br vswitch0
_uuid : 3500114d-5619-460e-ada7-d1b97f63c93c
br_mode : 【0】
controller : 【】
datapath_id : "0000ac162d88c35c"
datapath_type : ""
drop_unknown_uniUISt: 【】
external_ids : {}
fail_mode : 【】
firewall_port : 【】
flood_vlans : 【】
flow_tables : {}
ipfix : 【】
mirrors : 【】
name : "vswitch0"
netflow : 【】
other_config : {}
ports : 【16a48463-f90b-42fe-9a12-ceacfd256235, 5495812e-29e0-4364-a89f-b54ea52dd344, dec98186-2c83-447d-9215-28f99750a410】
protocols : 【】
sflow : 【】
status : {}
stp_enable : false
Displaying port configuration
root@UIS-CVK01:~# ovs-vsctl list port vnet0
_uuid : bc0b1e57-2d72-4fae-97b4-0bbca5d17ba1
TOS : routine
bond_downdelay : 0
bond_fake_iface : false
bond_mode : []
bond_updelay : 0
dynamic_acl_enable : false
external_ids : {}
fake_bridge : false
interfaces : [5495133f-7e81-4047-a0bd-734fae81f6f3]
lacp : []
lan_acl_list : []
lan_addr : []
mac : []
name : "vnet0"
other_config : {}
qbg_mode : [4]
qos : []
statistics : {}
status : {}
tag : [4]
tcp_syn_forbid : false
trunks : []
vlan_mode : []
vm_ip : []
vm_mac : "0cda411dad80"
wan_acl_list : []
wan_addr : []
Displaying the port number for a port in user mode and kernel mode
root@UIS-CVK01:~# ovs-appctl dpif/show
system@ovs-system: hit:10133796 missed:181938
flows: cur: 11, avg: 12, max: 23, life span: 79639399ms
hourly avg: add rate: 26.506/min, del rate: 26.462/min
daily avg: add rate: 24.205/min, del rate: 24.210/min
overall avg: add rate: 24.356/min, del rate: 24.354/min
vswitch0: hit:6478229 missed:39021
eth0 1/5: (system)
vnet1 2/8: (system)
vswitch0 65534/6: (internal)
For example, the port number of ether0 is 2 in user mode (OpenFlow port number) and 5 in kernel mode.
Displaying the MAC addresses on a vSwitch
root@UIS-CVK01:~# ovs-appctl fdb/show vswitch0
port VLAN MAC Age
1 0 00:0f:e2:5a:6a:20 134
2 0 0c:da:41:1d:3d:18 95
1 0 ac:16:2d:6f:3f:4a 6
1 0 a0:d3:c1:f0:a6:ca 6
1 0 c4:ca:d9:d4:c2:ff 2
4 0 0c:da:41:1d:6d:94 2
LOCAL 0 2c:76:8a:5d:df:a2 2
3 0 0c:da:41:1d:80:03 0
Displaying port binding information on a vSwitch
root@UIS-CVK02:~# ovs-appctl bond/show
---- vswitch-bond_bond ----
bond_mode: active-backup
bond-hash-basis: 0
updelay: 0 ms
downdelay: 0 ms
lacp_status: off
slave eth2: enabled
active slave
may_enable: true
slave eth3: disabled
may_enable: false
Displaying flow entry information
root@UIS-CVK01:~# ovs-ofctl dump-flows vswitch0
NXST_FLOW reply (xid=0x4):
cookie=0x0, duration=752218.541s, table=0, n_packets=15106363, n_bytes=3556156038, idle_age=0, hard_age=65534, priority=0 actions=NORMAL
Displaying kernel flow entry information on a vSwitch
root@UIS-CVK01:~# ovs-appctl dpif/dump-flows vswitch0
skb_priority(0),in_port(5),eth(src=74:25:8a:36:d8:9b,dst=ff:ff:ff:ff:ff:ff),eth_type(0x0806),arp(sip=10.88.8.1/255.255.255.255,tip=10.88.8.206/255.255.255.255,op=1/0xff,sha=74:25:8a:36:d8:9b/00:00:00:00:00:00,tha=00:00:00:00:00:00/00:00:00:00:00:00), packets:2, bytes:120, used:3.018s, actions:6
skb_priority(0),in_port(5),eth(src=38:63:bb:b7:ed:6c,dst=01:00:5e:00:00:fc),eth_type(0x0800),ipv4(src=10.88.8.140/0.0.0.0,dst=224.0.0.252/0.0.0.0,proto=17/0,tos=0/0,ttl=1/0,frag=no/0xff), packets:1, bytes:66, used:1.139s, actions:6
skb_priority(0),in_port(5),eth(src=c4:34:6b:6c:ef:a8,dst=ff:ff:ff:ff:ff:ff),eth_type(0x0800),ipv4(src=10.88.8.200/0.0.0.0,dst=10.88.9.255/0.0.0.0,proto=17/0,tos=0/0,ttl=128/0,frag=no/0xff), packets:17, bytes:1564, used:3.370s, actions:6
skb_priority(0),in_port(5),eth(src=14:58:d0:b7:24:07,dst=ff:ff:ff:ff:ff:ff),eth_type(0x0800),ipv4(src=10.88.8.229/0.0.0.0,dst=10.88.9.255/0.0.0.0,proto=17/0,tos=0/0,ttl=64/0,frag=no/0xff), packets:6, bytes:692, used:0.771s, actions:6
skb_priority(0),in_port(5),eth(src=14:58:d0:b7:53:f6,dst=01:00:5e:7f:ff:fa),eth_type(0x0800),ipv4(src=10.88.8.146/0.0.0.0,dst=239.255.255.250/0.0.0.0,proto=17/0,tos=0/0,ttl=1/0,frag=no/0xff), packets:1, bytes:175, used:0.739s, actions:6
Displaying all kernel flow entries
root@UIS-CVK01:~# ovs-dpctl dump-flows
skb_priority(0),in_port(4),eth(src=c4:34:6b:6c:f5:ab,dst=ff:ff:ff:ff:ff:ff),eth_type(0x0800),ipv4(src=10.88.8.159/0.0.0.0,dst=10.88.9.255/0.0.0.0,proto=17/0,tos=0/0,ttl=128/0,frag=no/0xff), packets:25, bytes:2300, used:0.080s, actions:3
skb_priority(0),in_port(5),eth(src=14:58:d0:b7:53:f6,dst=33:33:00:01:00:02),eth_type(0x86dd),ipv6(src=fe80::288d:70d6:36ce:60f3/::,dst=ff02::1:2/::,label=0/0,proto=17/0,tclass=0/0,hlimit=1/0,frag=no/0xff), packets:0, bytes:0, used:never, actions:6
skb_priority(0),in_port(13),eth(src=0c:da:41:1d:80:03,dst=c4:ca:d9:d4:c2:ff),eth_type(0x0800),ipv4(src=192.168.2.15/255.255.255.255,dst=192.168.2.121/0.0.0.0,proto=6/0,tos=0/0,ttl=128/0,frag=no/0xff), packets:1, bytes:54, used:2.924s, actions:2
skb_priority(0),in_port(4),eth(src=c4:34:6b:68:9b:78,dst=33:33:00:00:00:02),eth_type(0x86dd),ipv6(src=fe80::85b7:25a0:d116:907a/::,dst=ff08::2/::,label=0/0,proto=17/0,tclass=0/0,hlimit=128/0,frag=no/0xff), packets:0, bytes:0, used:never, actions:3
skb_priority(0),in_port(4),eth(src=5c:dd:70:b0:39:3d,dst=ff:ff:ff:ff:ff:ff),eth_type(0x0806),arp(sip=192.168.11.149/255.255.255.255,tip=192.168.11.150/255.255.255.255,op=1/0xff,sha=5c:dd:70:b0:39:3d/00:00:00:00:00:00,tha=00:00:00:00:00:00/00:00:00:00:00:00), packets:1, bytes:60, used:0.264s, actions:3
Capturing packets on a port
Use Linux command tcpdump to capture packets on the port corresponding to the vSwitch. For more information about the tcpdump command, see "_Ref139120162" in "Linux commands."
tcpdump -i vnet1 -s 0 -w /tmp/test.pcap host 200.1.1.1 &
iSCSI commands
The CAS system uses the open-source open-iscsi software as the client to connect to IP SAN/iSCSI storage. Common commands involve the use of iscsiadm. To access IP SAN/iSCSI storage, a CAS server must be reachable to the storage server, and appropriate access permissions must be configured on the storage server for CVK to have or to not have read and write permissions to configured LUNs.
Commonly used commands include discovery, login, logout, and session. You can also try other iscsiadm commands.
Discovering a target
~# iscsiadm -m discovery -t st -p 192.168.0.42
192.168.0.42:3260,1 iqn.2003-10.com.lefthandnetworks:group-4330-2:16908:cas-001
192.168.0.42:3260,1 iqn.2003-10.com.lefthandnetworks:group-4330-2:16486:cas-002
192.168.0.42:3260,1 iqn.2003-10.com.lefthandnetworks:group-4330-2:16484:cas-003
192.168.0.42: IP address of the storage device
Logging in to a target
~# iscsiadm -m node -T iqn.2003-10.com.lefthandnetworks:group-4330-2:16486:cas-002 -p 192.168.0.42 -l
Logging in to [iface: default, target: iqn.2003-10.com.lefthandnetworks:group-4330-2: 16486:cas-002, portal: 192.168.0.42,3260] (multiple)
Login to [iface: default, target: iqn.2003-10.com.lefthandnetworks:group-4330-2: 16486:cas-002, portal: 192.168.0.42,3260] successful.
· iqn.2003-10.com.lefthandnetworks:group-4330-2:16486:cas-002—Name of the target discovered through the discovery command.
· 192.168.0.42—IP address of the storage device.
Displaying the active iSCSI sessions and their corresponding disk information
~# iscsiadm -m session
tcp: [2] 192.168.0.42:3260,1 iqn.2003-10.com.lefthandnetworks:group-4330-2:16486: cas-002
The name of the device generated in the /dev/disk/by-path directory is in the ip-ip_address:port- target_name-lun-# format.
~# ls -al /dev/disk/by-path/*cas-002*
lrwxrwxrwx 1 root root 9 Nov 6 15:56 /dev/disk/by-path/ip-192.168.0.42:3260- iscsi-iqn.2003-10.com.lefthandnetworks:group-4330-2:16486:cas-002-lun-0 -> ../../sdb
~# fdisk -l /dev/sdb
Disk /dev/sdb: 10.7 GB, 10737418240 bytes
64 heads, 32 sectors/track, 10240 cylinders, total 20971520 sectors
Units = sectors of 1 * 512 = 512 bytes
Sector size (logical/physical): 512 bytes / 512 bytes
I/O size (minimum/optimal): 512 bytes / 512 bytes
Disk identifier: 0x02020202
Disk /dev/sdb doesn't contain a valid partition table
Device name after target login, which might have multiple instances
Setting the startup attribute
The following command updates the iSCSI node settings to automatically connect to the specified iSCSI target when the system starts up.
~# iscsiadm -m node -T iqn.2003-10.com.lefthandnetworks:group-4330-2:16486:cas-002 -p 192.168.0.42 --op update -n node.startup -v automatic
To disable automatic connection, set the value to manual.
~# iscsiadm -m node -T iqn.2003-10.com.lefthandnetworks:group-4330-2:16486:cas-002 -p 192.168.0.42 --op update -n node.startup -v manual
· iqn.2003-10.com.lefthandnetworks:group-4330-2:16486:cas-002—Name of the logged-in target.
· 192.168.0.42—IP address of the storage device
Refreshing a session
If you add or delete LUNs under the target in the storage device, you must manually refresh them on the CAS system to discover the changes.
~# iscsiadm -m session -R
Rescanning session [sid: 2, target: iqn.2003-10.com.lefthandnetworks:group-4330-2: 16486:cas-002, portal: 192.168.0.42,3260]
Logging out of a target
~# iscsiadm -m node -T iqn.2003-10.com.lefthandnetworks:group-4330-2:16486:fence-opt-002 -p 192.168.0.42 -u
Logging out of session [sid: 2, target: iqn.2003-10.com.lefthandnetworks: group-4330-2:16486:cas-002, portal: 192.168.0.42,3260]
Logout of [sid: 2, target: iqn.2003-10.com.lefthandnetworks:group-4330-2:16486:cas-002, portal: 192.168.0.42,3260] successful.
· iqn.2003-10.com.lefthandnetworks:group-4330-2:16486:cas-002—Name of the logged-in target.
· 192.168.0.42—IP address of the storage device
Mounting FC storage
Obtaining the HBA card information
· Method 1: Log in to the CVM system, access the storage management page, and then click a storage adapter to view HBA card information. If the card is in active state, storage access is available.
· Method 2: Display driver information. If the driver is loaded correctly for the HBA card, HBA information will be displayed in the /sys/class/fc_host/host* directory.
[root@cvknode2-158 /]#ls /sys/class/fc_host/
host0 host2 host3 host4
[root@cvknode2-158 /]#ls /sys/class/fc_host/host0
device issue_lip npiv_vports_inuse port_state speed supported_classes system_hostname vport_create
dev_loss_tmo max_npiv_vports port_id port_type statistics supported_speeds tgtid_bind_type vport_delete
fabric_name node_name port_name power subsystem symbolic_name uevent
Connecting to the FC storage
Execute the echo hba_channel target_id target_lun > /sys/class/scsi_host/host*/scan command.
Hba_channel represents the HBA card channel, target_id represents the target ID, and target_lun represents the LUN. To obtain the information, execute the /sys/class/fc_transport/ command.
[root@cvknode2-158 /]#ls /sys/class/fc_transport/
target0:0:0
[root@cvknode2-158 /]# echo 0 0 0 > /sys/class/scsi_host/host0/scan
Disconnecting the FC storage
Execute the echo 1 > /sys/block/sdX/device/delete command.
sdX represents the SD corresponding to the FC storage device. To obtain the SD ID, execute the ll command.
[root@cvknode2-158 /]# ll /dev/disk/by-path
lrwxrwxrwx 1 root root 9 Oct 12 09:48 pci-0000:05:00.0-fc-0x21020002ac01e2d7-lun-0 -> ../../sdb
[root@cvknode2-158 /]# echo 1 > /sys/block/sdb/device/delete
Obtaining the connection status between an HBA card and storage controller on a CVK host
You can view the status of an HBA card on the Storage Adapters tab or use the following command from the CLI of the CVK host.
fc_san_get_wwn_info.sh
root@cvknode73:~# fc_san_get_wwn_info.sh
<list><HbaInfo><localNodeName>2000b4b52f54efc1</localNodeName><localPortName>1000b4b52f54efc1</localPortName><status>Online</status><capacity>10 Gbit</capacity><remoteNodeName>10005cdd70d94290 500b342001303700 500b34200121a000 2000fc15b40c36d9 2000fc15b40b7d21 1000a81122334455 2000b4b52f54cf29 20008c7cff65943f 2000b4b52f54afa9 2000fc15b40b1bd1 20009cb654854409 5001438011397750 5001438021e2c74d 5001438021e2cf65</remoteNodeName><remotePortName>20d4aa112233445c 500b342001303706 500b34200121a005 1000fc15b40c36d9 1000fc15b40b7d21 2ffca81122334455 1000b4b52f54cf29 10008c7cff65943f 1000b4b52f54afa9 1000fc15b40b1bd1 10009cb654854409 5001438011397758 5001438021e2c74c 5001438021e2cf64</remotePortName></HbaInfo><HbaInfo><localNodeName>2000b4b52f54efc5</localNodeName><localPortName>1000b4b52f54efc5</localPortName><status>Online</status><capacity>10 Gbit</capacity><remoteNodeName>100000e0dc001200 5001438021e2c74f 500b3420014aad00 500b3420014aab00 2000fc15b40c36dd 2000fc15b40b7d25 100000e0dc001200 2000b4b52f54cf2d 2000b4b52f54afad 20008c7cff6594b7 2000fc15b40b1bd5 20009cb65485440d 20000090fa1a5d14 20008c7cff655c4f 5001438011397750</remoteNodeName><remotePortName>20d400e0dc001207 5001438021e2c74e 500b3420014aad05 500b3420014aab05 1000fc15b40c36dd 1000fc15b40b7d25 2ffc00e0dc001200 1000b4b52f54cf2d 1000b4b52f54afad 10008c7cff6594b7 1000fc15b40b1bd5 10009cb65485440d 10000090fa1a5d14 10008c7cff655c4f 500143801139775d</remotePortName></HbaInfo></list>
This command can obtain the status of both a local HBA card and an HBA card on the peer storage device.
The output shows that both HBA cards are in connected state.
To list all the Fibre Channel (FC) connected storage devices and their World Wide Name (WWN) numbers.
root@cvknode73:~# ls -a /dev/disk/by-path/*fc*
/dev/disk/by-path/pci-0000:02:00.2-fc-0x5001438011397758-lun-1 /dev/disk/by-path/pci-0000:02:00.3-fc-0x500143801139775d-lun-1
/dev/disk/by-path/pci-0000:02:00.2-fc-0x5001438011397758-lun-2 /dev/disk/by-path/pci-0000:02:00.3-fc-0x500143801139775d-lun-2
/dev/disk/by-path/pci-0000:02:00.2-fc-0x5001438011397758-lun-3 /dev/disk/by-path/pci-0000:02:00.3-fc-0x500143801139775d-lun-3
The output shows that the WWN numbers are 5001438011397758 and 500143801139775, respectively for HBA cards on cvknode73 that is connected to the storage controller.
To list all the FC HBA cards on the system and their detailed information and attributes:
root@cvknode73:/sys/class/fc_host# ls -al
total 0
drwxr-xr-x 2 root root 0 Nov 6 14:29 .
drwxr-xr-x 61 root root 0 Nov 6 14:29 ..
lrwxrwxrwx 1 root root 0 Nov 6 14:29 host1 -> ../../devices/pci0000:00/0000:00:03.0/0000:02:00.2/host1/fc_host/host1
lrwxrwxrwx 1 root root 0 Nov 6 14:29 host2 -> ../../devices/pci0000:00/0000:00:03.0/0000:02:00.3/host2/fc_host/host2
root@cvknode73:/sys/class/fc_host# cd host1/
root@cvknode73:/sys/class/fc_host/host1# ls
active_fc4s fabric_name max_npiv_vports port_id port_type statistics supported_fc4s tgtid_bind_type vport_delete
device issue_lip node_name port_name power subsystem supported_speeds uevent
dev_loss_tmo maxframe_size npiv_vports_inuse port_state speed supported_classes symbolic_name vport_create
root@cvknode73:/sys/class/fc_host/host1# cat port_name
0x1000b4b52f54efc1
The output shows that HBA card 0x1000b4b52f54efc1 connects to HBA card 5001438011397758 on the storage device, and the other HBA card establishes an FC channel with a different controller, resulting in two separate paths.
Obtaining NAA information for the LUNs that the CVK host can access
Use the fc_san_get_naa_wwid.sh command to obtain the LUNs that the local CVK node can access.
root@cvknode73:/sys/class/fc_host/host1# fc_san_get_naa_wwid.sh
<source><lun_info><naa>36001438009b051b90000a000017a0000</naa><capacity>24696061952</capacity><vendor>HP</vendor><model>HSV340</model></lun_info><lun_info><naa>36001438009b051b90000600000970000</naa><capacity>354334801920</capacity><vendor>HP</vendor><model>HSV340</model></lun_info><lun_info><naa>36001438009b051b90000600002780000</naa><capacity>322122547200</capacity><vendor>HP</vendor><model>HSV340</model></lun_info></source>
The output shows the NAAs, capacity, storage model, and vendor for the LUNs.
Updating local HBA information
You can scan for HBA information from the Web interface or execute the following command from the CLI.
fc_san_hba_scan.sh -h
NAME
/opt/bin/fc_san_hba_scan.sh.x - Cause the HBA rescan
SYNOPSIS
/opt/bin/fc_san_hba_scan.sh.x [ -h ] [0|1] [hba_name]
DESCRIPTION
-h Help
refresh_type: Optional. 0 --- normal refresh, 1 --- forcely_refresh, default 0.
hba_name: Optional. The WWPN of the HBA, if not specified, refresh all.
After you change the association between the LUN and the host on the storage device, execute the refresh command to rescan the LUN information on the storage device. The command depends on the storage model. Some models might not support this command.
If you cannot add a LUN to the shared storage pool from the Web interface, check the storage configuration and rescan to discover the newly added LUN.
Obtaining the connection status to the controller
root@cvknode73:~# ls -al /dev/disk/by-path/*fc*
lrwxrwxrwx 1 root root 9 Oct 27 10:55 /dev/disk/by-path/pci-0000:02:00.2-fc-0x5001438011397758-lun-1 -> ../../sdb
lrwxrwxrwx 1 root root 9 Oct 27 10:55 /dev/disk/by-path/pci-0000:02:00.2-fc-0x5001438011397758-lun-2 -> ../../sdc
lrwxrwxrwx 1 root root 9 Oct 27 10:55 /dev/disk/by-path/pci-0000:02:00.2-fc-0x5001438011397758-lun-3 -> ../../sdd
lrwxrwxrwx 1 root root 9 Oct 27 10:55 /dev/disk/by-path/pci-0000:02:00.3-fc-0x500143801139775d-lun-1 -> ../../sde
lrwxrwxrwx 1 root root 9 Oct 27 10:55 /dev/disk/by-path/pci-0000:02:00.3-fc-0x500143801139775d-lun-2 -> ../../sdf
lrwxrwxrwx 1 root root 9 Oct 27 10:55 /dev/disk/by-path/pci-0000:02:00.3-fc-0x500143801139775d-lun-3 -> ../../sdg
By querying the directory under /dev/disk/by-path/*fc* and the HBA PCI information in the /sys/class/fc_host directory, you can deduce which HBA card is currently connected between the CVK and the storage.
Collecting FC configuration and connectivity information
Execute the fc_san_info_collector.sh command to collect FC configuration and connectivity information. The fc_san_info.tar.gz file will be generated automatically.
Tomcat commands
H3C UIS Manager provides the Tomcat service. When an exception occurs, you can restart the Tomcat service.
Viewing the Tomcat service status
root@HZ-UIS01-CVK01:~# service tomcat8 status
* Tomcat servlet engine is running with pid 3362
Stopping the Tomcat service
root@HZ-UIS01-CVK01:~# service tomcat8 stop
* Stopping Tomcat servlet engine tomcat8
...done.
Starting the Tomcat service
root@HZ-UIS01-CVK01:~# service tomcat8 start
* Starting Tomcat servlet engine tomcat8
...done.
Restarting the Tomcat service
root@ HZ-UIS01-CVK01:~# service tomcat8 restart
* Stopping Tomcat servlet engine tomcat8
...done.
* Starting Tomcat servlet engine tomcat8
...done.
root@ HZ-UIS01-CVK01:~#
MySQL database commands
H3C UIS Manager uses MySQL to provide database service.
To view the MySQL service status:
root@HZ-UIS01-CVK01:~# service mysql status
mysql start/running, process 3039
To stop the MySQL service:
root@HZ-UIS01-CVK01:~#
root@HZ-UIS01-CVK01:~# service mysql stop
mysql stop/waiting
To start the MySQL service:
root@HZ-UIS01-CVK01:~# service mysql start
mysql start/running, process 4821
virsh commands
virsh commands allow you to obtain VMs attached to a CVK host and the VM status. In addition, you can start and shut down the VMs by using the commands.
Displaying the VM status from a CVK host
Execute the virsh list --all command to view the status of all VMs on the host.
root@UIS-CVK01:/vms# virsh list --all
Id Name State
----------------------------------------------------
4 windows2008 running
- Linux-RedHat5.9 shut off
Starting a VM from a CVK host
Execute the virsh start VM name command.
root@UIS-CVK01:/vms# virsh start Linux-RedHat5.9
Domain Linux-RedHat5.9 started
root@UIS-CVK01:/vms#
Shutting down a VM from a CVK host
Execute the virsh shutdown VM name command.
root@UIS-CVK01:/vms# virsh shutdown Linux-RedHat5.9
Domain Linux-RedHat5.9 is being shutdown
casserver commands
The casserver service collects statistics such as disk usage and alarm information. When an exception occurs on the casserver service, you can use the service casserver restart command to restart the casserver service.
qemu commands
Use qemu commands to display image file information and convert disk file formats.
Displaying image file information for a VM
On UIS Manager, you can view the image file path for A VM. As shown in the following figure, the path for the image file for VM A_048 is /vms/defaultShareFileSystem0/A_048.
To display basic information for an image file, for example, file format, file size, and used file size, execute the qemu-img info command. For a three-level image file, the level-2 image file name will also be displayed.
root@ZJ-UIS-001:~# qemu-img info /vms/defaultShareFileSystem0/A_048
image: /vms/defaultShareFileSystem0/A_048
file format: qcow2
virtual size: 30G (32212254720 bytes)
disk size: 1.3G
cluster_size: 262144
backing file: /vms/defaultShareFileSystem0/A_048_base_1
backing file format: qcow2
Format specific information:
compat: 0.10
refcount bits: 16
If you display level-2 image file information, you can see information for the level-1 image file (base image file).
root@ZJ-UIS-001:~# qemu-img info /vms/defaultShareFileSystem0/A_048_base_1
image: /vms/defaultShareFileSystem0/A_048_base_1
file format: qcow2
virtual size: 30G (32212254720 bytes)
disk size: 1.0M
cluster_size: 262144
backing file: /vms/defaultShareFileSystem0/fio-cent-autorun_UIS-e0602fio-cent-autorun_UIS-e0602
backing file format: qcow2
Format specific information:
compat: 0.10
refcount bits: 16
If you display information for the base image file, you cannot see information for image files of other levels.
root@ZJ-UIS-001:~# qemu-img info /vms/defaultShareFileSystem0/fio-cent-autorun_UIS-e0602fio-cent-autorun_UIS-e0602
image: /vms/defaultShareFileSystem0/fio-cent-autorun_UIS-e0602fio-cent-autorun_UIS-e0602
file format: qcow2
virtual size: 30G (32212254720 bytes)
disk size: 5.5G
cluster_size: 262144
Format specific information:
compat: 1.1
lazy refcounts: false
refcount bits: 16
corrupt: false
Consolidating image files
If a VM uses a multi-level image file, you can use the qemu-img convert command to consolidate the image file.
root@UIS-CVK01:/vms/sharefile# qemu-img convert -O qcow2 -f qcow2 windows2008 windows2008-test
root@ZJ-UIS-001:/vms/defaultShareFileSystem0# qemu-img convert -O qcow2 -f qcow2 A_048 A048-test
The consolidated image file is not a multi-level image file.
root@ZJ-UIS-001:~# qemu-img info /vms/defaultShareFileSystem0/A048-test
image: /vms/defaultShareFileSystem0/A048-test
file format: qcow2
virtual size: 30G (32212254720 bytes)
disk size: 1.4G
cluster_size: 262144
Format specific information:
compat: 1.1
lazy refcounts: false
refcount bits: 16
corrupt: false
IO commands
iostat
Use the iostat command to monitor system input/output (I/O) devices that are loaded and the length of time it takes for the system to process the I/O requests. This command is useful for analyzing whether there is a bottleneck in the IO process during the interaction between the process and the operating system. When executed without any parameters specified, this command displays statistical information from the time the system was started to the current time when the command was executed.
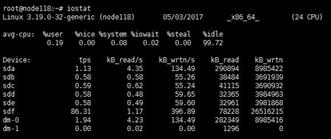
The following are the descriptions for the items:
· The first line displays the system version, host name, and date.
· avg-cpu—CPU usage statistics. For a multi-core CPU, this value is the average value of all cores.
For the CPU statistics, the value for iowait is important. It indicates the percentage of time that the CPU (or CPUs) were idle during which the system had pending disk I/O requests.
· Device—IO statistics for each disk.
Disk names are displayed in the sdX
format.
|
Item |
Description |
|
tps |
Number of IO read and write requests per second that were issued by the process. |
|
kB_read/s |
The amount of data read from the device expressed in kilobytes per second. One sector has a size of 512 bytes. |
|
kB_wrtn/s |
The amount of data written to the device expressed in kilobytes per second. |
|
kB_read |
Total number of kilobytes read. |
|
kB_wrtn |
Total number of kilobytes written. |
The iostat -x 1 command displays real-time IO device statistics. Specify the -x option when you analyze IO usage statistics.
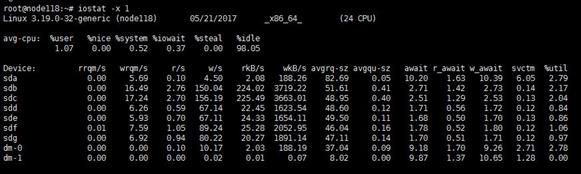
The iostat -x 1 command displays real-time information about the disk usage for a node. If the %util ratio of a single disk is high or close to 100%, a single disk might have an issue. If the overall disk %util ratio of the cluster is over 80% or close to 100%, the cluster's disk IO usage has reached its limit. In such a case, you can add more disks or reduce the services provided by the cluster.
The following are the descriptions for the
items:
|
Item |
Description |
|
rrqm/s |
Number of read requests merged per second that were queued to the device. |
|
wrqm/s |
Number of write requests merged per second that were queued to the device. |
|
r/s |
Number of read requests completed per second for the device. |
|
w/s |
Number of write requests completed per second for the device. |
|
rkB/s |
Number of kilobytes read from the device per second. |
|
wkB/s |
Number of kilobytes written to the device per second. |
|
avgrq-sz |
Average size (in sectors) of the requests that were issued to the device. |
|
avgqu-sz |
Average queue length of the requests that were issued to the device. |
|
await |
Average time (in milliseconds) for I/O requests issued to the device to be served. The time includes the time spent by the requests in queue and the time spent servicing them. |
|
svctm |
Average service time (in milliseconds) for I/O requests that were issued to the device. |
|
%util |
Percentage of CPU time during which I/O requests were issued to the device. |
top
The top command provides real-time monitoring of resource usage for different processes in the system. This command can sort tasks based on CPU usage, memory usage, and execution time.
The following are the items that need to be focused on:
· Load average
· Tasks
· CPU usage
· Sorting processes by CPU or memory usage can help identify which processes are causing system issues. To do this, press either the uppercase F or O key and choose either k or n when you execute the top command.
The following is the output from the top command.

The following are the descriptions for the items:
· The first line is task queue information. This line shows the current time, system uptime, the number of currently logged-in users, and the system load, which is the average length of the task queue, displayed as three values for the past 1 minute, 5 minutes, and 15 minutes, respectively.
· The second and third lines display information about processes and CPUs. If multiple CPUs exist, these contents might exceed two lines. The content in memory is swapped out to the swap area, and then swapped back to memory, but the unused swap area has not been overwritten. This value is the size of the swap area that already exists in memory. When the corresponding memory is swapped out again, there is no need to write to the swap area again.
The area below system information displays
detailed information for each process.
|
Item |
Description |
|
PID |
Process ID |
|
RUSER |
Username of the owner of the process |
|
UID |
User ID of the owner of the process |
|
USER |
Username of the owner of the process |
|
VIRT |
Total virtual memory used by the process. |
|
RES |
The amount of actual physical memory a process is consuming in kb. |
|
SHR |
Shared memory size (kb) used by the process. |
|
%MEM |
Memory usage of the process. |
|
%CPU |
CPU usage of the process. |
You can press the uppercase F or O key, and then press a-z to sort the processes according to the corresponding column. The uppercase R key can reverse the current sorting.
You can use the following commands during
the execution of the top command.
|
Item |
Description |
|
q /Ctrl+C |
Quits the program. |
|
m |
Displays memory information. |
|
t |
Displays process and CPU information. |
|
c |
Displays command name and complete command. |
|
M |
Sorts processes by available memory. |
|
P |
Sorts processes by CPU usage. |
|
T |
Sorts processes by time/accumulated time. |
Other query commands
· lsblk
Use the lsblk command to view information about hard drive capacity, partition, usage, and mounting.

In the above figure, the NAME column lists all hard drives and partitions, SIZE displays the total capacity of the hard drive and partition size, TYPE displays the type of hard drive and partition, and MOUNTPOINT displays the file system mount point. The sda disk is the system disk with a size of 279.4G. Six hard disks with a size of 558.9G each are mounted as OSDs, and the size of the log partition is 10G.
· mount
Use the mount command to display all mounted file systems in a cluster and their types.
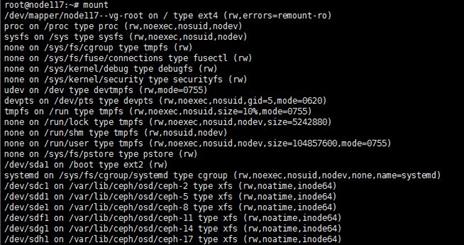
· df -h
Use the df -h command to list all mounted file systems, and display the total capacity, used capacity, available capacity, usage, and mount point for each mounted file system.

The output shows that 6 OSDs have been mounted, each with a capacity of 549G and a usage of 1%.
· fdisk -l
Use the fdisk -l command to display the hard drives, partitions, sizes, and usage of the nodes.
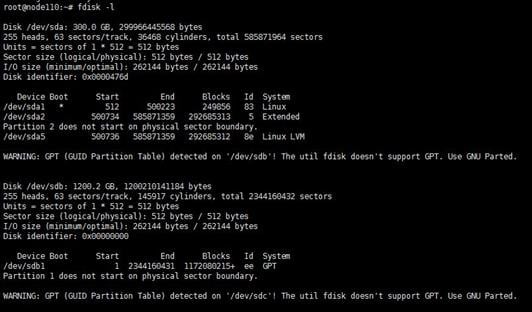
· free
Use the free command to display the total memory, used memory, buffer, cache, and swap usage of a node.
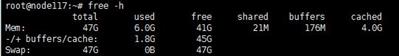
Linux commands
vi
To create or edit a file in the Linux operating system, you must use commands such as vi and vim.
The Vi editor has two modes: Command and Insert.
The following uses the test.txt file as an example.
1. Executing the vi command.
Enter the vi test.txt command in the command line window of Linux. If the test.text file already Existent use the vi command to edit its content. If the file does not exist, this command creates the file.
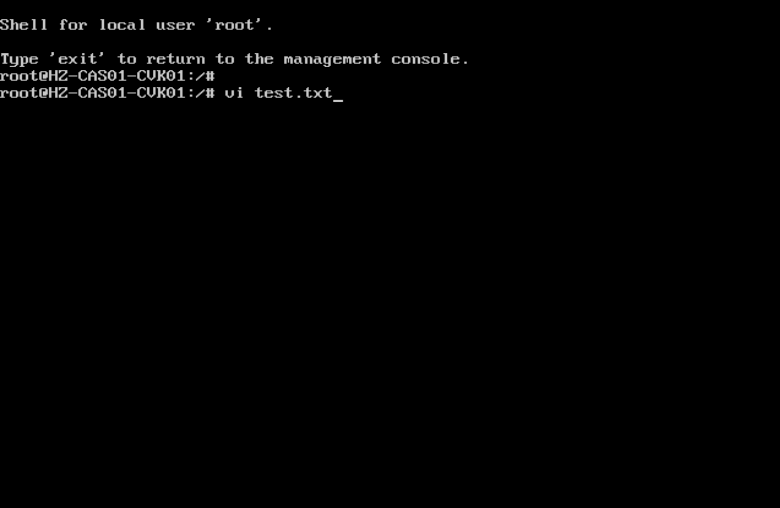
When you first open a file with Vi, you are in Command mode. The file does not contain any information.
In Command mode, you can use keyboard keys to navigate, delete, copy, paste except entering text.
To enter Insert mode, press i, o, or a.
![]()
4. Editing a file
Enter the file content.
To return to Command mode, press ESC.

6. Save & Exit
After you return to Command mode, enter a colon (:), and then enter the wq command to save the file and exit the vi editor.


7. To view the created file, execute the ls command.

Basic commands
Displaying the current directory
Use the pwd command to print the current working directory.
root@HZ-UIS01-CVK01:~# pwd
/root
Displaying file information
Use the ls command to display file information in the current directory.
# ls [-aAdfFhilnrRSt] directory name
Options and parameters:
# ls [-aAdfFhilnrRSt] directory name
Options and parameters:
-a: Lists all files including those that begin with .
-A: Lists all files except for . and ..
-d: Lists directory entries instead of contents
-h: when used with -l (long list), prints sizes in human readable format, for example GB, KB
-i: Prints the index number of each file
-r: Reverses order while sorting
-R: Lists all subdirectories recursively
-S: Displays entries sorted by file size
-t: Sorts by modification time
Example:
root@HZ-UIS01-UIS Manager:~# ls -al
total 44
drwx------ 5 root root 4096 May 23 15:33 .
drwxr-xr-x 24 root root 4096 May 13 09:47 ..
-rw------- 1 root root 847 Jan 1 12:35 .bash_history
-rw-r--r-- 1 root root 3106 Apr 19 2012 .bashrc
drwx------ 2 root root 4096 May 17 17:23 .cache
-rw-r--r-- 1 root root 8 May 23 15:33 UIS.conf
drwxr-xr-x 2 root root 4096 May 23 15:32 h3c
-rw-r--r-- 1 root root 140 Apr 19 2012 .profile
drwxr-xr-x 2 root root 4096 May 22 09:50 .ssh
-rw------- 1 root root 4962 May 23 15:33 .viminfo
Changing the working directory
Use the cd command to change the working directory.
.: The current directory.
..: One level up from the current directory.
-: Previous working directory
~: Home directory for the current user
For example, ~account represents the home directory for the account user.
Example:
root@HZ-UIS01-CVK01:/# cd ~root
# Enter the home directory for the root user.
root@HZ-UIS01-CVK01:~# cd ~
# Return to the home directory for the current user.
root@HZ-UIS01-CVK01:~# cd
# Return to the home directory for the current user.
root@HZ-UIS01-CVK01:~# cd ..
# Enter the directory one level up from the current directory.
root@HZ-UIS01-CVK01:/# cd -
# Return to the previous directory.
root@HZ-UIS01-CVK01:~# cd /root
# Enter the /root directory.
root@HZ-UIS01-CVK01:~# cd ../root
# Enter the root directory under the previous directory.
Creating a new directory
Use the mkdir (make directory) command to create a new directory.
# mkdir [-mp] directory name
Options and parameters:
-m: Sets access privilege.
-p: Adds a directory including its sub directory.
Example:
root@HZ-UIS01-UIS Manager:~# ls
root@HZ-UIS01-UIS Manager:~# mkdir h3c
root@HZ-UIS01-UIS Manager:~# ls
h3c
root@HZ-UIS01-UIS Manager:~#
Copying a file or directory
Use the cp (copy) command to copy a file or directory.
# cp [-adfilprsu] source destination
# cp [options] source1 source2 source3 .... destination directory
Options and parameters:
-a: Same as -pdr
-f: If any existing destination file can't be opened, delete it and attempt again
-i: Asks for confirmation before overwriting the destination file.
-p: Preserves the file attributes of the original file in the copy.
-r: Copies files recursively. All files and subdirectories in the specified source directory are copied to the destination.
If more than two source files exist, the last destination file must be a directory.
If more than two source files exist, the last destination file must be a directory.
Example:
# Copy a file.
root@HZ-UIS01-UIS Manager:~# ls
UIS.conf
root@HZ-UIS01-UIS Manager:~# cp UIS.conf UIS.conf.bak
root@HZ-UIS01-UIS Manager:~# ls
UIS.conf UIS.conf.bak
root@HZ-UIS01-UIS Manager:~#
# Copy a directory.
root@HZ-UIS01-UIS Manager:~# ls
h3c
root@HZ-UIS01-UIS Manager:~# cp -rf h3c h3c.bak
root@HZ-UIS01-UIS Manager:~# ls
h3c h3c.bak
root@HZ-UIS01-UIS Manager:~#
Securely copying a file
scp (secure copy) allows you to securely copy files and directories between two locations. The protocol ensures that the transmission of files is encrypted. It is a safer option for the cp (copy) command.
#scp [option] [source directory] [destination directory]
Options and parameters:
-1: Protocol 1 will be used.
-2: Protocol 2 will be used.
-4: Only IPv4 addresses will be used.
-6: Only IPv6 addresses will be used.
-B: Executes in batch mode, deactivating every query for user input.
-C: Enable compression. Compression will be activated, and transfer speed will be enhanced while copying with this option.
-p: Preserves file permissions, access time, and modifications while copying.
-q: Execute SCP in quiet mode. This option will not display the transfer process.
-r: Copies the directories and files recursively.
-v: Activates verbose mode. It will display the SCP command execution progress step-by-step on the terminal window. It is useful in debugging.
-c: Cipher. choose the cipher for the process of data encryption. This option is passed directly to SSH.
-F ssh_config: For SSH, describe a replacement configuration file. This option is passed directly to SSH.
-i identity_file: File through which to read the status for public key authentication. This option is passed directly to SSH.
-l limit: Restricts the bandwidth in Kbit/s.
-o ssh_option: Arranged options in the ssh_configure format to SSH.
-P port: Port to which to link.
-S program: Applies a specified function for encryption connection. This program must be able to understand the SSH(1) option.
Example:
root@HZ-UIS01-CVK01:~# scp UIS-E0218H06-Upgrade.tar.gz HZ-UIS01-CVK02:/root
UIS-E0218H06-Upgrade.tar.gz 100% 545MB 90.8MB/s 00:06
root@HZ-UIS01-CVK01:~#
Removing a file or directory
Use the rm (remove) command to remove a file or directory.
# rm [-fir] file or directory name
Options and parameters:
-f: Removes a directory forcefully.
-i: Removes a file interactively.
-r: Removes a directory recursively. Use this option with caution.
Example:
root@HZ-UIS01-UIS Manager:~# ls
h3c
root@HZ-UIS01-UIS Manager:~# rm -rf h3c
root@HZ-UIS01-UIS Manager:~# ls
root@HZ-UIS01-UIS Manager:~#
Moving files and directories or renaming a file or directory
Use the mv (move) command to move files and directories from one directory to another or rename a file or directory.
# mv [-fiu] source destination
# mv [options] source1 source2 source3 .... directory
Options and parameters:
-f: Overwrites the destination file or directory without asking for permission.
-i: Asks for permission to overwrite.
-u: Only moves those files that do not exist.
Example:
root@HZ-UIS01-UIS Manager:~# ls
UIS.conf
root@HZ-UIS01-UIS Manager:~# mv UIS.conf UIS.conf.bak
root@HZ-UIS01-UIS Manager:~# ls
UIS.conf.bak
root@HZ-UIS01-UIS Manager:~#
Creating an archive and extracting the archive files
# tar [-j|-z] [cv] [-f file name] filename... archive
# tar [-j|-z] [xv] [-f file name] [-C directory] extracting
Options and parameters:
-c: Creates the archive.
-t: Displays or lists files inside the archived file.
-x: Extracts archives. This option can be used together with the -C option.
The -c, -t, and -x option cannot be used in the same command.
-j: Filters archive tar files with the help of tbzip. As a best practice, use *.tar.bz2 as the archive name.
-z: A zip file and informs the tar command that makes a tar file with the help of gzip. As a best practice, use *.tar.gz as the archive name.
-v: Displays verbose information.
-f filename: Creates an archive along with the provided name of the file.
-C directory: Use this option to extract files in a specific directory.
Example:
# Create an archive.
root@HZ-UIS01-UIS Manager:~# ls
UIS.conf UIS.conf-01 UIS.conf-02
root@HZ-UIS01-UIS Manager:~# tar -czvf UIS.tar.gz UIS.conf*
UIS.conf
UIS.conf-01
UIS.conf-02
root@HZ-UIS01-UIS Manager:~# ls
UIS.conf UIS.conf-01 UIS.conf-02 UIS.tar.gz
# Extract the archive files.
root@HZ-UIS01-UIS Manager:~# ls
UIS.tar.gz
root@HZ-UIS01-UIS Manager:~# tar -xzvf UIS.tar.gz
UIS.conf
UIS.conf-01
UIS.conf-02
root@HZ-UIS01-UIS Manager:~# ls
UIS.conf UIS.conf-01 UIS.conf-02 UIS.tar.gz
System commands
Displaying the system kernel
# uname [-asrmpi]
Options and parameters:
-a: Displays all system information.
-s: Displays the system kernel name.
-r: Displays the kernel release.
-m: Displays the name of the machine’s hardware name, for example, i686 or x86_64.
-p: Displays the architecture of the CPU.
-i: Displays the hardware platform.(x86)
Example:
root@ZJ-UIS-001:~# uname -a
Linux ZJ-UIS-001 4.1.0-generic #1 SMP Wed Nov 9 02:04:23 CST 2016 x86_64 x86_64 x86_64 GNU/Linux
Displaying the uptime of the system
Example:
root@HZ-UIS01-UIS Manager:~# uptime
17:54:04 up 3 days, 23:28, 1 user, load average: 0.08, 0.12, 0.13
Displaying system resource statistics
# vmstat [-a] [delay [total monitors]]
# vmstat [-fs]
# vmstat [-S unit]
# vmstat [-d]
# vmstat [-p partition]
Options and parameters:
-a: Displays active/inactive memory.
-f: Displays the number of forks since boot.
-s: Displays a table of various event counters and memory statistics.
-S: Followed by k or K or m or M switches outputs of bytes.
-d: Lists disk statistics.
-p: Followed by some partition name for detailed statistics.
Example:
root@HZ-UIS01-CVK01:~# vmstat 1 5
procs ---------------memory----------------- -----swap---- -----io---- ----system-- -----cpu--------
r b swpd free buff cache si so bi bo in cs us sy id wa
1 0 0 60402384 58716 1712736 0 0 15 6 87 116 1 0 98 0
0 0 0 60402500 58716 1712736 0 0 1 0 631 1051 0 0 100 0
0 0 0 60402608 58756 1712752 0 0 0 840 1444 1640 2 0 98 0
0 0 0 60403360 58756 1712760 0 0 2 33 991 1346 0 0 100 0
2 0 0 60400944 58780 1712784 0 0 0 60 2225 1682 0 0 99 0
· procs
¡ r: Number of processes waiting for run time.
¡ b: Number of processes in uninterruptible sleep.
· memory
¡ swpd: The amount of virtual memory used.
¡ free: The amount of idle memory.
¡ buff: The amount of memory used as buffers
¡ cache: The amount of memory used as cache.
· swap
¡ si: The amount of memory swapped in from disk (/s).
¡ so: The amount of memory swapped to disk (/s).
¡ If the values are large, data in the memory is swapped between disks and the primary adapter, which means the system has low efficiency.
· io
¡ bi: Number of blocks written from a disk.
¡ bo: Number of blocks written to a disk. A larger value indicates that the system IO is busy.
· system
¡ in: Number of interrupts per second, including the clock.
¡ cs: Number of context switches per second. A larger value indicates more frequent communications between the system and devices such as disks, NICs, and clocks.
· CPU
¡ us: Time spent running non-kernel code.
¡ sy: Time spent running kernel code. (system time)
¡ id: Time spent idle.
¡ st: Time stolen from a VM. Supported in versions later than Linux 2.6.11.
Displaying the load on a device
Use the iostat command to display CPU and I/O usage statistics.
#iostat[parameter][time][count]
Options and parameters:
-c: Displays the CPU usage. It is mutually exclusive with the -d option.
-d: Displays the disk usage. It is mutually exclusive with the -c option.
-k: Displays statistics in kilobytes per second. The default unit is block.
-m: Displays statistics in megabytes per second.
-N: Displays logical volume mapping (LVM) statistics.
-n: Displays NFS statistics.
-p: Displays statistics for block devices and all their partitions used by the system. You can specify a device after this option, for example, # iostat -p /dev/sda. This option is mutually exclusive with the -x option.
-t: Prints the time for each report displayed.
-x: Displays detailed information.
-v: Displays version information.
Remarks:
· avg-cpu
¡ %user: Displays the percentage of CPU usage that occurred when executing at the user level.
¡ %nice: Displays the percentage of CPU usage that occurred when executing at the user level with nice priority.
¡ %user: Displays the percentage CPU usage that occurred when executing at the system (kernel) level.
¡ %steal: Displays the percentage of time spent in involuntary wait by the virtual CPU or CPUs when the hypervisor was servicing another virtual processor.
¡ %iowait: Displays the percentage of time the CPUs were idle during which the system had an outstanding disk I/O request.
¡ %idle: Displays the percentage of time the CPUs were idle.
· Device
¡ tps: Number of IO requests per second that were issued to the device.
¡ Blk_read /s: The amount of data read from the device expressed in blocks per second.
¡ Blk_wrtn/s: The amount of data written to the device expressed in blocks per second.
¡ Blk_read: Total number of blocks read.
¡ Blk_wrtn: Total number of blocks written.
|
|
IMPORTANT: · If the value of %iowait is too high, the disk has IO issues. If the value of %idle is high, the CPUs are idle. · If the value of %idle is high but the system responds slowly, the CPUs might be waiting for memory allocation. You must increase the memory capacity. · If the value of %idle keeps lower than 10, the system has low CPU processing capabilities. |
iostat outputs:
· Blk_read: Total number of blocks read.
· Blk_wrtn: Total number of blocks written.
· kB_read/s: The amount of data read from the driver expressed in kilobytes per second.
· kB_wrtn/s: The amount of data written to the driver expressed in kilobytes per second.
· kB_read: Total number of kilobytes read.
· kB_wrtn: Total number of kilobytes written.
· rrqm/s: Number of read requests merged per second that were queued to the device.
· wrqm/s: Number of write requests merged per second that were queued to the device.
· r/s: Number of read requests completed per second for the device.
· w/s: Number of write requests completed per second for the device.
· rsec/s: Number of sectors read from the device per second.
· wsec/s: Number of sectors written to the device per second.
· rkB/s: The amount of data read from the device expressed in kilobytes per second.
· wkB/s: The amount of data written to the device expressed in kilobytes per second.
· avgrq-sz: Average size (in sectors) of the requests that were issued to the device.
· avgqu-sz: Average queue length of the requests that were issued to the device.
· await: Average time (in milliseconds) for I/O requests issued to the device to be served. This includes the time spent by the requests in queue and the time spent servicing them.
· svctm: Average service time (in milliseconds) for I/O requests that were issued to the device.
· %Util: Percentage of CPU time where I/O requests were issued to the device (bandwidth utilization for the device). Device saturation occurs when this value is close to 100%.
Example:
root@HZ-UIS01-CVK01:~# iostat
Linux 3.13.6 (HZ-UIS01-CVK01) 12/16/2015 _x86_64_ (24 CPU)
avg-cpu: %user %nice %system %iowait %steal %idle
20.48 0.00 3.48 0.23 0.00 75.80
Device: tps kB_read/s kB_wrtn/s kB_read kB_wrtn
sda 10.17 1.76 269.57 1309400 201017740
sdb 16.43 181.78 202.21 135552881 150792613
Execute the iostat -d -x -m /dev/sdb 1 5 command to display detailed information about /dev/sdb.
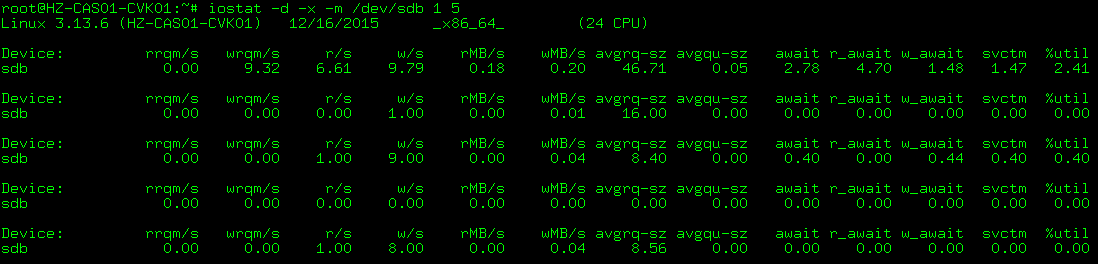
Testing the read and write performance for a disk
dd [option]
Options and parameters:
· if=file: Specifies the input file name. The default is standard input.
· of=file: Specifies the output file name. The default is standard output.
· ibs=bytes: Reads BYTES bytes at a time. One block is BYTES bytes.
· obs=bytes: Writes BYTES bytes at a time. One block is BYTES bytes.
· bs=bytes: Reads and writes BYTES bytes at a time. It can replace ibs and obs.
· cbs=bytes: Converts BYTES bytes at a time. It is the size of the conversion buffer.
· skip=blocks: Skips BLOCKS ibs-sized blocks at start of input.
· seek=blocks: Skips BLOCKS ibs-sized blocks at start of output. This option is valid only when the output file is a disk or tape.
· count=blocks: Copies only BLOCKS input blocks. The block size is the number of bytes specified by ibs.
· conv=ASCII: Converts EBCDIC to ASCII.
· conv=ebcdic: Converts ASCII to EBCDIC.
· conv=ibm: Converts ASCII to alternate EBCDIC.
· conv=block: Converts pad newline-terminated records with spaces to cbs-size.
· conv=ublock: Replaces trailing spaces in cbs-size records with newline.
· conv=uUISe: Converts lower-case letters to upper-case letters.
· conv=lUISe: Converts upper-case letters to lower-case letters.
· conv=notrunc: Does not truncate the output file.
· conv=swab: Swaps every pair of input bytes.
· conv=noerror: Ccontinue after read errors.
· conv=sync: Pads every input block with NULLs to ibs-size; when used with block or unblock, pad with spaces rather than NULLs.
The specified numbers must be multiplied by their corresponding factors if they are followed by any of the following characters: b=512, c=1, k=1024, w=2, xm=number m, kB=1000, K=1024, MB=1000*1000, M=1024*1024, GB=1000*1000*1000, G=1024*1024*1024.
Displaying the free and used memory
free [-b|-k|-m|-g] [-t]
Options and parameters:
· -b: Displays output in Kbytes. The output can also be displayed in b(bytes), m(Mbytes), k(Kbytes), and g(Gbytes).
· -t: Displays summary for physical memory + swap space.
Example:
root@HZ-UIS01-CVK01:~# free
total used free shared buffers cached
Mem: 65939360 4208888 61730472 0 83224 277944
-/+ buffers/cache: 384772062091640
Swap: 10772220 0 10772220
User commands
Creating a user group
groupadd [-g gid] groupname
Options and parameters:
-g: Group ID.
Example:
root@HZ-UIS01-CVK01:~# groupadd -g 1000 it
root@HZ-UIS01-CVK01:/etc# more /etc/group | grep it
it:x:1000:
Deleting a user group
groupdel groupname
Example:
root@HZ-UIS01-CVK01:/etc# more /etc/group | grep it
it:x:1000:
root@HZ-UIS01-CVK01:/etc# groupdel it
root@HZ-UIS01-CVK01:/etc# more /etc/group | grep it
root@HZ-UIS01-CVK01:/etc#
Creating a user
useradd [-u UID] [-g initial_group] [-G supplementary group] [-m/M] [-d home_dir] [-s shell] username
Options and parameters:
· -u: User ID.
· -g: Initial group.
· -G: A list of supplementary groups which the user is also a member of.
· -M: The user home directory will not be created.
· -m: The user’s home directory will be created if it does not exist.
· -d: Specifies a directory as the home directory.
· -s: The name of the user’s login shell. If no login shell exists, the system selects the default login shell.
Example:
root@HZ-UIS01-CVK01:~# useradd -u 1000 -g it -m -d /home/it-user01 -s /bin/bash it-user01
root@HZ-UIS01-CVK01:~# more /etc/passwd | grep it-user01
it-user01:x:1000:1000::/home/it-user01:/bin/bash
root@HZ-UIS01-CVK01:~# ls /home/
it-user01
Deleting a user
userdel [-r] username
Options and parameters:
-r: Deletes files in the user’s home directory along with the home directory itself.
Example:
root@HZ-UIS01-CVK01:~# userdel -r it-user01
root@HZ-UIS01-CVK01:~# more /etc/passwd | grep it-user01
root@HZ-UIS01-CVK01:~# ls /home
root@HZ-UIS01-CVK01:~#
Setting the password
passwd [-l] [-u] [--sdtin] [-S] [-n days] [-x days] [-w days] [-i date] username
Options and parameters:
· -l: Locks the password.
· -u: Unlocks the password.
· -S: Displays password related parameters.
· -n: Sets the minimum number of days between password changes.
· -x: Sets the maximum number of days a password remains valid. After MAX_DAYS, the password must be changed.
· -w: Sets the number of days of warning before a password change is required.
· -i: Sets the day on which the password will expire.
Example:
root@HZ-UIS01-CVK01:~# more /etc/passwd | grep it-user01
it-user01:x:1000:1000::/home/it-user01:/bin/bash
root@HZ-UIS01-CVK01:~#
root@HZ-UIS01-CVK01:~# passwd it-user01
Enter new UNIX password:
Retype new UNIX password:
passwd: password updated successfully
Switching the user account
su [-lm] [-c command] [username]
Options and parameters:
· -: starts a new login shell as another username. If you do not add a username, you switch to the root user.
· -l: Similar as the - option except that you must specify the user account.
· -m: Preserves the current environment.
· -c: Passes a command to the shell.
Example:
root@HZ-UIS01-CVK01:~# su - it-user01
it-user01@HZ-UIS01-CVK01:~$ exit
logout
it-user01@HZ-UIS01-CVK01:~$ su - root
Password:
root@HZ-UIS01-CVK01:~#
File management commands
Changing the group ownership of a file or directory
chgrp [-R] group name directory/file
Options and parameters:
-R: Recursively changes the group of the directory and each file in the directory.
Example:
root@HZ-UIS01-CVK01:/home/it-user01# ls -l
total 4
drwxr-xr-x 2 it-user01 it 4096 May 30 15:44 testFile
root@HZ-UIS01-CVK01:/home/it-user01# chgrp root testFile
root@HZ-UIS01-CVK01:/home/it-user01# ls -l
total 4
drwxr-xr-x 2 it-user01 root 4096 May 30 15:44 testFile
Changing the file owner and group
chown [-R] user file or directory
chown [-R] user:group name file or directory
Options and parameters:
-R: Recursively changes the ownership of the directory and each file in the directory.
Example:
root@HZ-UIS01-CVK01:/home/it-user01# ls -l
total 4
drwxr-xr-x 2 it-user01 it 4096 May 30 15:44 testFile
root@HZ-UIS01-CVK01:/home/it-user01# chown root:root testFile
root@HZ-UIS01-CVK01:/home/it-user01# ls -l
total 4
drwxr-xr-x 2 root root 4096 May 30 15:44 testFile
root@HZ-UIS01-CVK01:/home/it-user01#
Changing file or directory mode bits or permissions.
chmod [-R] xyz file or directory
Options and parameters:
· xyz: File attribute in number, a sum of the values for r, w, and x.
· -R: Recursively changes file mode bits of the directory and the files in the directory.
Example:
root@HZ-UIS01-CVK01:/home/it-user01# ls -l
total 4
drwxr-xr-x 2 it-user01 it 4096 May 30 15:44 testFile
root@HZ-UIS01-CVK01:/home/it-user01# chmod 777 testFile
root@HZ-UIS01-CVK01:/home/it-user01# ls -l
total 4
drwxrwxrwx 2 it-user01 it 4096 May 30 15:44 testFile
root@HZ-UIS01-CVK01:/home/it-user01#
Process management commands
Displaying all running processes
top [-d number] | top [-bnp]
Options and parameters:
· -d: Specifies the delay between screen updates in seconds. The default value is 5 seconds.
· -b: Starts top in Batch mode, which is used to send output from top to a file.
· -n: Specifies the maximum number of iterations, or frames, top can produce before ending. This option is used together with the -b option.
· -p: Monitor only processes with specified process IDs.
You can use the following interactive commands during execution of the top:
· ?: Provides a reminder of all the basic interactive commands.
· P: Sorts by CPU usage.
· M: Sorts by memory usage.
· N: Sorts by PID.
· T: Sorts by CPU time used by processes.
· k: You will be prompted for a PID and then the signal to be sent.
· r: You will be prompted for a PID and then the value to nice it to.
· q: Quits top.
Example:
top - 17:40:48 up 2:13, 1 user, load average: 0.45, 0.55, 0.66
Tasks: 257 total, 1 running, 256 sleeping, 0 stopped, 0 zombie
Cpu(s): 0.6%us, 0.1%sy, 0.0%ni, 99.2%id, 0.0%wa, 0.0%hi, 0.0%si, 0.0%st
Mem: 65939360k total, 5703848k used, 60235512k free, 85832k buffers
Swap: 10772220k total, 0k used, 10772220k free, 1746992k cached
PID USER PR NI VIRT RES SHR S %CPU %MEM TIME+ COMMAND
4939 root 20 0 4583m 1.3g 4728 S 12 2.1 17:36.67 kvm
4874 root 20 0 4520m 908m 4576 S 5 1.4 11:54.61 kvm
4043 root 20 0 10.9g 402m 16m S 1 0.6 13:43.34 java
2370 root 20 0 23676 2168 1316 S 0 0.0 0:30.29 ovs-vswitchd
3184 root 20 0 15972 744 544 S 0 0.0 0:04.78 irqbalance
1 root 20 0 24456 2444 1344 S 0 0.0 0:04.07 init
2 root 20 0 0 0 0 S 0 0.0 0:00.00 kthreadd
3 root 20 0 0 0 0 S 0 0.0 0:00.07 ksoftirqd/0
6 root RT 0 0 0 0 S 0 0.0 0:00.00 migration/0
Output description:
· The first line displays the following:
¡ Current time and length of time since last boot
¡ Total number of users
¡ System load avg over the last 1, 5 and 15 minutes
A small value indicates that the system is idle. If the value is higher than 1, you must identify whether the system is too busy.
· The second line shows total tasks or threads. If the value for zombie is not 0, you must identify which process has become a zombie process.
· The third line shows the CPU state percentages. You must focus on the %wa parameter, which represents the time waiting for I/O completion. An IO issue can cause a system to respond slowly.
· The fourth and fifth lines show the physical and virtual memory statistics. If the virtual memory usage is high, the physical memory of the system is insufficient.
The lower section displays statistics for each process.
· PID: ID of the process.
· USEr: User of the process.
· PR: Priority of the process. A smaller value means the process has a higher execution priority.
· NI: Time running niced user processes. A smaller value means the process has a higher execution priority.
· %CPU: CPU usage.
· %MEM: Memory usage.
· TIME+: CPU time.
To view information about a process:
root@HZ-UIS01-CVK01:~# top -d 2 -p 4939
top - 08:59:13 up 17:31, 1 user, load average: 0.75, 0.70, 0.58
Tasks: 1 total, 0 running, 1 sleeping, 0 stopped, 0 zombie
Cpu(s): 0.1%us, 0.1%sy, 0.0%ni, 99.8%id, 0.0%wa, 0.0%hi, 0.0%si, 0.0%st
Mem: 65939360k total, 6484728k used, 59454632k free, 229880k buffers
Swap: 10772220k total, 0k used, 10772220k free, 1995728k cached
PID USER PR NI VIRT RES SHR S %CPU %MEM TIME+ COMMAND
4939 root 20 0 4583m 1.5g 4728 S 2 2.4 100:48.79 kvm
Returning the status of a process
ps aux
ps -lA
ps axjf
Options and parameters:
· -A: Displays information about all accessible processes on the system.
· -a: Displays information about all processes that are associated with terminals.
· -u: Displays information for processes with user IDs in the userlist.
· -x: Used together with the -a option to display complete information.
Output format:
· l: Displays BSD long format.
· j: BSD job control format.
· -f: Does full-format listing.
# Display bash processes.
root@HZ-UIS01-CVK01:~# ps -l
F S UID PID PPID C PRI NI ADDR SZ WCHAN TTY TIME CMD
4 R 0 11338 32857 0 80 0 - 2102 - pts/2 00:00:00 ps
4 S 0 32857 32797 0 80 0 - 5428 wait pts/2 00:00:00 bash
Using the ps -l command only lists programs related to the operating environment (bash). The parent program will be its own bash, which extends to the init process.
· F: Flags associated with the process.
¡ 4: used super-user privileges.
¡ 1: forked but didn't exec.
· S: Process state. R: Running. S: Sleep. D: Uninterruptible sleep (typically IO).
· T: Stop. Z: defunct zombie process, terminated but not reaped by its parent.
· UID/PID/PPID: Process ID.
· C: CPU usage.
· PRI/NI: Priority and Nice.
· ADDR/SZ/WCHAN: Memory related.
¡ ADDR: Location of the process in the memory. If it is Running, a hyphen (-) is displayed.
¡ SZ: size in physical pages of the core image of the process.
¡ WCHAN: Address of the kernel function where the process is sleeping.
· TTY: Controlling tty (terminal). For a remote login, pts/2 port is used.
· CMD: Command.
# Display all processes.
root@HZ-UIS01-CVK01:~# ps aux
USER PID %CPU %MEM VSZ RSS TTY STAT START TIME COMMAND
root 1 0.0 0.0 24572 2484 ? Ss 11:20 0:04 /sbin/init
root 2 0.0 0.0 0 0 ? S 11:20 0:00 [kthreadd]
root 3 0.0 0.0 0 0 ? S 11:20 0:00 [ksoftirqd/0]
root 6 0.0 0.0 0 0 ? S 11:20 0:00 [migration/0]
root 7 0.0 0.0 0 0 ? S 11:20 0:00 [watchdog/0]
root 8 0.0 0.0 0 0 ? S 11:20 0:00 [migration/1]
...
root 55719 1.0 0.0 71272 3520 ? Ss 17:42 0:00 sshd: root@pts/3
root 55752 8.6 0.0 21712 4204 pts/3 Ss 17:43 0:00 -bash
root 55927 0.0 0.0 16872 1284 pts/3 R+ 17:43 0:00 ps aux
root 62570 0.0 0.0 0 0 ? S 14:43 0:00 [kworker/7:2]
root 62840 0.0 0.0 0 0 ? S 16:40 0:00 [kworker/u:0]
# Display information about a process.
root@HZ-UIS01-CVK01:~# ps -fu mysql
UID PID PPID C STIME TTY TIME CMD
mysql 3144 1 0 11:21 ? 00:00:46 /usr/sbin/mysqld
Ending a process
kill -signal PID
The following are the signal types:
· 1 SIGHUP: Hangs up or disconnects a process. It's often used to restart a process or to update its configuration.
· 9 SIGKILL: Immediately terminates a process, without allowing it to clean up or save any data.
· 15 SIGTERM: Requests that the process terminate gracefully, allowing it to clean up any resources or save any data before exiting.
Networking
Configuring a network interface
# Display enabled network interfaces.
root@HZ-UIS01-CVK01:/etc/network# ifconfig
eth0 Link encap:Ethernet HWaddr 2C:76:8A:5B:3F:A0
UP BROADUIST MULTIUIST MTU:1500 Metric:1
RX packets:0 errors:0 dropped:0 overruns:0 frame:0
TX packets:0 errors:0 dropped:0 overruns:0 carrier:0
collisions:0 txqueuelen:1000
RX bytes:0 (0.0 b) TX bytes:0 (0.0 b)
Interrupt:26 Memory:f6000000-f67fffff
eth1 Link encap:Ethernet HWaddr 2C:76:8A:5B:3F:A4
UP BROADUIST MULTIUIST MTU:1500 Metric:1
RX packets:0 errors:0 dropped:0 overruns:0 frame:0
TX packets:0 errors:0 dropped:0 overruns:0 carrier:0
collisions:0 txqueuelen:1000
RX bytes:0 (0.0 b) TX bytes:0 (0.0 b)
Interrupt:28 Memory:f4800000-f4ffffff
...
The ifconfig -a command displays all network interfaces, including disabled network interfaces.
# Display information about a network interface.
root@HZ-UIS01-CVK01:/etc/network# ifconfig vswitch2
vswitch2 Link encap:Ethernet HWaddr 2C:76:8A:5D:DF:A0
inet addr:192.168.1.11 BUISt:192.168.1.255 Mask:255.255.255.0
inet6 addr: fe80::2e76:8aff:fe5d:dfa0/64 Scope:Link
UP BROADUIST RUNNING PROMISC MULTIUIST MTU:1500 Metric:1
RX packets:1134578 errors:0 dropped:7658 overruns:0 frame:0
TX packets:1013948 errors:0 dropped:0 overruns:0 carrier:0
collisions:0 txqueuelen:0
RX bytes:165047129 (157.4 Mb) TX bytes:111771007 (106.5 Mb)
# Shut down a network interface.
# ifconfig vswitch2 down
# Start a network interface.
# ifconfig vswitch2 up
# Configure a network interface (the configuration does not survive an interface or system restart).
# ifconfig vswitch2 192.168.2.12 netmask 255.255.255.0
# Restart a network interface.
# /etc/init.d/networking restart
To save the network interface configuration, use the vi editor to modify the /etc/network/interfaces configuration file.
Restart the network interface to have the change take effect.
auto vswitch2
iface vswitch2 inet static
address 192.168.1.11
netmask 255.255.255.0
network 192.168.1.0
broadUISt 192.168.1.255
gateway 192.168.1.254
# dns-* options are implemented by the resolvconf package, if installed
dns-nameservers 192.168.1.254
auto eth2
iface eth0 inet static
address 0.0.0.0
netmask 0.0.0.0
Displaying physical NIC information
root@UIS-CVK02:~# ethtool eth1
Settings for eth1:
Supported ports: [ TP ]
Supported link modes: 10baseT/Half 10baseT/Full
100baseT/Half 100baseT/Full
1000baseT/Half 1000baseT/Full
Supported pause frame use: No
Supports auto-negotiation: Yes
Advertised link modes: 10baseT/Half 10baseT/Full
100baseT/Half 100baseT/Full
1000baseT/Half 1000baseT/Full
Advertised pause frame use: Symmetric
Advertised auto-negotiation: Yes
Link partner advertised link modes: 10baseT/Half 10baseT/Full
100baseT/Half 100baseT/Full
1000baseT/Full
Link partner advertised pause frame use: No
Link partner advertised auto-negotiation: Yes
Speed: 1000Mb/s
Duplex: Full
Port: Twisted Pair
PHYAD: 1
Transceiver: internal
Auto-negotiation: on
MDI-X: on
Supports Wake-on: g
Wake-on: g
Current message level: 0x000000ff (255)
drv probe link timer ifdown ifup rx_err tx_err
Link detected: yes
Displaying network statistics
netstat -[atunlp]
Options and parameters:
· -a: Displays the state of all sockets and all routing table entries.
· -t: Lists TCP network packet data.
· -u: Lists UDP network packet data.
· -n: Displays network addresses as numbers.
· -l: Lists the services that are being listened to.
· -p: Displays process PID information for the service.
# Display network connection statistics for the service that uses port 8080.
root@HZ-UIS01-CVK01:/etc/network# netstat -an | grep 8080
tcp6 0 0 :::8080 :::* LISTEN
tcp6 0 0 192.168.1.11:8080 10.165.136.197:55954 ESTABLISHED
tcp6 0 0 192.168.1.11:8080 10.165.136.197:55989 TIME_WAIT
tcp6 0 0 192.168.1.11:8080 10.165.136.197:55990 FIN_WAIT2
tcp6 0 0 192.168.1.11:8080 192.168.1.211:53366 ESTABLISHED
tcp6 0 0 192.168.1.11:8080 192.168.1.211:54850 TIME_WAIT
# Display routing information for the system.
root@HZ-UIS01-CVK01:/etc/network# netstat -rn
Kernel IP routing table
Destination Gateway Genmask Flags MSS Window irtt Iface
0.0.0.0 192.168.1.254 0.0.0.0 UG 0 0 0 vswitch2
192.168.1.0 0.0.0.0 255.255.255.0 U 0 0 0 vswitch2
192.168.2.0 0.0.0.0 255.255.255.0 U 0 0 0 vswitch-storage
192.168.3.0 0.0.0.0 255.255.255.0 U 0 0 0 vswitch-app
Capturing packets on a network
tcpdump
Options and parameters:
· -a: Converts network and broadcast addresses to names.
· -d: Displays the matching packet code in a human readable form to standard output and stop.
· -dd: Displays the matching packet code in the format of a C program segment.
· -ddd: Displays the matching packet code in decimal format.
· e: Prints data link layer header information on the output line.
· -t: Does not print timestamps on each output line.
· -vv: Outputs detailed packet information.
· -c: Stops tcpdump after receiving the specified number of packets.
· -i: Specifies the network interface to listen on.
· -w: Directly writes packet to a file without analyzing or printing it.
Example:
tcpdump -i vswitch2 -s 0 -w /tmp/test.cap host 200.1.1.1 &
Displaying routing information
# Display routing information.
root@HZ-UIS01-CVK01:/etc/network# route -n
Kernel IP routing table
Destination Gateway Genmask Flags Metric Ref Use Iface
0.0.0.0 192.168.1.254 0.0.0.0 UG 100 0 0 vswitch2
192.168.1.0 0.0.0.0 255.255.255.0 U 0 0 0 vswitch2
192.168.2.0 0.0.0.0 255.255.255.0 U 0 0 0 vswitch-storage
192.168.3.0 0.0.0.0 255.255.255.0 U 0 0 0 vswitch-app
# Add static routing information to access the network at 10.10.10.0/24.
# route add -net 10.10.10.0 netmask 255.255.255.0 gw 192.168.2.254
root@HZ-UIS01-CVK01:/etc/network#
root@HZ-UIS01-CVK01:/etc/network# route -n
Kernel IP routing table
Destination Gateway Genmask Flags Metric Ref Use Iface
0.0.0.0 192.168.1.254 0.0.0.0 UG 100 0 0 vswitch2
10.10.10.0 192.168.2.254 255.255.255.0 UG 0 0 0 vswitch-storage
192.168.1.0 0.0.0.0 255.255.255.0 U 0 0 0 vswitch2
192.168.2.0 0.0.0.0 255.255.255.0 U 0 0 0 vswitch-storage
192.168.3.0 0.0.0.0 255.255.255.0 U 0 0 0 vswitch-app
# Delete routing information.
# route del -net 10.10.10.0 netmask 255.255.255.0 gw 192.168.2.254
root@HZ-UIS01-CVK01:/etc/network# route -n
Kernel IP routing table
Destination Gateway Genmask Flags Metric Ref Use Iface
0.0.0.0 192.168.1.254 0.0.0.0 UG 100 0 0 vswitch2
192.168.1.0 0.0.0.0 255.255.255.0 U 0 0 0 vswitch2
192.168.2.0 0.0.0.0 255.255.255.0 U 0 0 0 vswitch-storage
192.168.3.0 0.0.0.0 255.255.255.0 U 0 0 0 vswitch-app
The static routing information generated by executing the command is only saved in the system's memory. For the information to take effect permanently, add the command to the system startup script so it can be executed during the startup process.
Use the vi editor in the operating system of UIS Manager to edit the /etc/rc.local file.
Add routing commands in the file. Restart the system for the modification to take effect.
root@HZ-UIS01-CVK01:/etc/network# vi /etc/rc.local
#!/bin/sh -e
#
# rc.local
#
# This script is executed at the end of each multiuser runlevel.
# Make sure that the script will "" on success or any other
# value on error.
#
# In order to enable or disable this script just change the execution
# bits.
#
# By default this script does nothing.
route add -net 192.168.5.0 netmask 255.255.255.0 gw 192.168.2.254
ulimit -s 10240
ulimit -c 1024
touch /var/run/h3c_UIS_cvk
/usr/bin/set-printk-console 2
exit 0
Disk management commands
Displaying the disk capacity
df [-ahikHTm] [directory or file]
Options and parameters:
· -a: Lists all file systems, including system-specific file systems such as /proc.
· -k: Displays the capacity of each file system in KBytes.
· -m: Displays the capacity of each file system in MBytes.
· -h: Displays the capacity of each file system in a human readable format, such as GBytes, MBytes, and KBytes.
· -H: Uses M=1000K instead of M=1024K for displaying capacities in larger units.
· -T: Lists the file system name of each partition, such as ext3.
· -i: Displays the number of inodes instead of disk usage.
# Display the partition size.
root@HZ-UIS01-CVK01:/etc/network# df -h
Filesystem Size Used Avail Use% Mounted on
/dev/sda1 28G 2.4G 25G 9% /
udev 32G 4.0K 32G 1% /dev
tmpfs 13G 396K 13G 1% /run
none 5.0M 0 5.0M 0% /run/lock
none 32G 17M 32G 1% /run/shm
/dev/sda6 241G 48G 181G 21% /vms
# Display information about a file system with partitions.
root@HZ-UIS01-CVK01:/etc/network# df -Th
Filesystem Type Size Used Avail Use% Mounted on
/dev/sda1 ext4 28G 2.4G 25G 9% /
udev devtmpfs 32G 4.0K 32G 1% /dev
tmpfs tmpfs 13G 396K 13G 1% /run
none tmpfs 5.0M 0 5.0M 0% /run/lock
none tmpfs 32G 17M 32G 1% /run/shm
/dev/sda6 ext4 241G 48G 181G 21% /vms
Displaying the disk usage
du [-ahskm] file or directory name
Options and parameters:
· -a: Lists the capacity of all files or directories.
· -h: Displays the capacity of each file system in a human readable format, such as G/M.
· -s: Displays the total capacity.
· -S: Does not include statistics from subdirectories, which is slightly different from -s.
· -k: Displays the capacity in KBytes.
· -m: Displays the capacity in MBytes.
Example:
root@HZ-UIS01-CVK01:/vms# du -sh *
15G images
11G isos
16K lost+found
3.4G rhel-server-6.1-x86_64-dvd.iso
4.0K share
4.0K share-test
17G templet
4.0K test
Partitioning a disk
fdisk [-l] disk name
Options and parameters:
-l: Lists the partition tables for the specified disk.
If no disk is specified, the system lists all partitions of all disks in the system.
Example:
root@HZ-UIS01-CVK01:~# fdisk -l
Disk /dev/sda: 300.0 GB, 299966445568 bytes
255 heads, 63 sectors/track, 36468 cylinders, total 585871964 sectors
Units = sectors of 1 * 512 = 512 bytes
Sector size (logical/physical): 512 bytes / 512 bytes
I/O size (minimum/optimal): 262144 bytes / 262144 bytes
Disk identifier: 0x00051ce2
Device Boot Start End Blocks Id System
/dev/sda1 * 512 58593791 29296640 83 Linux
/dev/sda2 58594302 585871359 263638529 5 Extended
Partition 2 does not start on physical sector boundary.
/dev/sda5 58594304 80138751 10772224 82 Linux swap / Solaris
/dev/sda6 80139264 585871359 252866048 83 Linux
Disk /dev/sdb: 4294 MB, 4294967296 bytes
133 heads, 62 sectors/track, 1017 cylinders, total 8388608 sectors
Units = sectors of 1 * 512 = 512 bytes
Sector size (logical/physical): 512 bytes / 512 bytes
I/O size (minimum/optimal): 512 bytes / 512 bytes
Disk identifier: 0x00000000
Disk /dev/sdb doesn't contain a valid partition table
# Create a partition on a disk.
root@HZ-UIS01-CVK01:~# fdisk /dev/sdb
Device contains neither a valid DOS partition table, nor Sun, SGI or OSF disklabel
Building a new DOS disklabel with disk identifier 0xeb665aa3.
Changes will remain in memory only, until you decide to write them.
After that, of course, the previous content won't be recoverable.
Warning: invalid flag 0x0000 of partition table 4 will be corrected by w(rite)
Command (m for help): m
Command action
a toggle a bootable flag
b edit bsd disklabel
c toggle the dos compatibility flag
d delete a partition
l list known partition types
m print this menu
n add a new partition
o create a new empty DOS partition table
p print the partition table
q quit without saving changes
s create a new empty Sun disklabel
t change a partition's system id
u change display/entry units
v verify the partition table
w write table to disk and exit
x extra functionality (experts only)
Command (m for help): p
Disk /dev/sdb: 4294 MB, 4294967296 bytes
133 heads, 62 sectors/track, 1017 cylinders, total 8388608 sectors
Units = sectors of 1 * 512 = 512 bytes
Sector size (logical/physical): 512 bytes / 512 bytes
I/O size (minimum/optimal): 512 bytes / 512 bytes
Disk identifier: 0xeb665aa3
Device Boot Start End Blocks Id System
Command (m for help): n
Partition type:
p primary (0 primary, 0 extended, 4 free)
e extended
Select (default p): p
Partition number (1-4, default 1): 1
First sector (2048-8388607, default 2048)
Using default value 2048
Last sector, +sectors or +size{K,M,G} (2048-8388607, default 8388607): 4000000
Command (m for help): n
Partition type:
p primary (1 primary, 0 extended, 3 free)
e extended
Select (default p): p
Partition number (1-4, default 2): 2
First sector (4000001-8388607, default 4000001)
Using default value 4000001
Last sector, +sectors or +size{K,M,G} (4000001-8388607, default 8388607): +500M
Command (m for help): p
Disk /dev/sdb: 4294 MB, 4294967296 bytes
133 heads, 62 sectors/track, 1017 cylinders, total 8388608 sectors
Units = sectors of 1 * 512 = 512 bytes
Sector size (logical/physical): 512 bytes / 512 bytes
I/O size (minimum/optimal): 512 bytes / 512 bytes
Disk identifier: 0xeb665aa3
Device Boot Start End Blocks Id System
/dev/sdb1 2048 4000000 1998976+ 83 Linux
/dev/sdb2 4000001 5024000 512000 83 Linux
Command (m for help): w
The partition table has been altered!
Calling ioctl() to re-read partition table.
Syncing disks.
# Display disk partition information.
root@HZ-UIS01-CVK01:~# fdisk -l /dev/sdb
Disk /dev/sdb: 4294 MB, 4294967296 bytes
133 heads, 62 sectors/track, 1017 cylinders, total 8388608 sectors
Units = sectors of 1 * 512 = 512 bytes
Sector size (logical/physical): 512 bytes / 512 bytes
I/O size (minimum/optimal): 512 bytes / 512 bytes
Disk identifier: 0xeb665aa3
Device Boot Start End Blocks Id System
/dev/sdb1 2048 4000000 1998976+ 83 Linux
/dev/sdb2 4000001 5024000 512000 83 Linux
Making a file system
mkfs [-t file system format] disk name
Options and parameters:
-t: Specifies the file system type, for example, ext2, ext3, ext4, or ocfs2.
# Make an ex3 file system on /dev/sdb1.
root@HZ-UIS01-CVK01:~# mkfs -t ext3 /dev/sdb1
mke2fs 1.42 (29-Nov-2011)
Filesystem label=
OS type: Linux
Block size=4096 (log=2)
Fragment size=4096 (log=2)
Stride=0 blocks, Stripe width=0 blocks
125184 inodes, 499744 blocks
24987 blocks (5.00%) reserved for the super user
First data block=0
Maximum filesystem blocks=515899392
16 block groups
32768 blocks per group, 32768 fragments per group
7824 inodes per group
Superblock backups stored on blocks:
32768, 98304, 163840, 229376, 294912
Allocating group tables: done
Writing inode tables: done
Creating journal (8192 blocks): done
Writing superblocks and filesystem accounting information: done
root@HZ-UIS01-CVK01:~#
# Make an ocfs2 file system on /dev/sdb1.
root@HZ-UIS01-CVK01:~# mkfs -t ocfs2 /dev/sdb2
mkfs.ocfs2 1.6.3
Cluster stack: classic o2cb
Label:
Features: sparse backup-super unwritten inline-data strict-journal-super xattr
Block size: 1024 (10 bits)
Cluster size: 4096 (12 bits)
Volume size: 524288000 (128000 clusters) (512000 blocks)
Cluster groups: 17 (tail covers 5120 clusters, rest cover 7680 clusters)
Extent allocator size: 2097152 (1 groups)
Journal size: 16777216
Node slots: 2
Creating bitmaps: done
Initializing superblock: done
Writing system files: done
Writing superblock: done
Writing backup superblock: 0 block(s)
Formatting Journals: done
Growing extent allocator: done
Formatting slot map: done
Formatting quota files: done
Writing lost+found: done
mkfs.ocfs2 successful
root@HZ-UIS01-CVK01:~#
Checking a disk
fsck [-t file system format] [-ACay] disk name
Options and parameters:
· -t: Specifies the file system type. This option is typically not required, because the current Linux system automatically distinguishes file system types through the superblock.
· -A: Scans the necessary disks based on the content of /etc/fstab. This command is typically executed during the boot process.
· -a: Automatically repairs detected abnormal sectors, so you don't have to keep pressing y.
· -y: Similar to -a, but some file systems only support the -y parameter.
· -C: Enables a histogram to display the current progress during the check.
# Check the /dev/sdb1 partition.
root@HZ-UIS01-CVK01:~# fsck -C /dev/sdb1
fsck from util-linux 2.20.1
e2fsck 1.42 (29-Nov-2011)
/dev/sdb1: clean, 11/125184 files, 16807/499744 blocks
Mounting a file system
mount [-t file system type] [-L Lable name] [-o additional option] [-n] disk file name mount point
Options and parameters:
· -a: Mounts all file systems based on the data in the /etc/fstab configuration file.
· -l: Displays the column label name besides the mounting information.
· -t: Specifies the type of file system to be mounted.
· -n: By default, the system writes the actual mounting information to /etc/mtab in real time to facilitate operation of other programs.
· -L: Mounts the partition that has the specified label.
· -l: Add labels in the mount output, for example, account, password, or read privilege.
# Mount /dev/sdb1 to /mnt.
root@HZ-UIS01-CVK01:~# mount /dev/sdb1 /mnt
root@HZ-UIS01-CVK01:~# df -Th
Filesystem Type Size Used Avail Use% Mounted on
/dev/sda1 ext4 28G 5.7G 21G 22% /
udev devtmpfs 32G 4.0K 32G 1% /dev
tmpfs tmpfs 13G 408K 13G 1% /run
none tmpfs 5.0M 0 5.0M 0% /run/lock
none tmpfs 32G 17M 32G 1% /run/shm
/dev/sda6 ext4 241G 48G 181G 21% /vms
/dev/sdb1 ext3 1.9G 35M 1.8G 2% /mnt
Umounting a file system
umount [-fn] disk file name
Options and parameters:
· -f: Unmounts a file system forcibly. Use this parameter if no data can be read from a network file system (NFS).
· -n: Unmounts a file system without writing in the /etc/mtab directory.
Example:
root@HZ-UIS01-CVK01:~# df -Th
Filesystem Type Size Used Avail Use% Mounted on
/dev/sda1 ext4 28G 5.7G 21G 22% /
udev devtmpfs 32G 4.0K 32G 1% /dev
tmpfs tmpfs 13G 408K 13G 1% /run
none tmpfs 5.0M 0 5.0M 0% /run/lock
none tmpfs 32G 17M 32G 1% /run/shm
/dev/sda6 ext4 241G 48G 181G 21% /vms
/dev/sdb1 ext3 1.9G 35M 1.8G 2% /mnt
root@HZ-UIS01-CVK01:~#
root@HZ-UIS01-CVK01:~# umount /mnt
root@HZ-UIS01-CVK01:~# df -Th
Filesystem Type Size Used Avail Use% Mounted on
/dev/sda1 ext4 28G 5.7G 21G 22% /
udev devtmpfs 32G 4.0K 32G 1% /dev
tmpfs tmpfs 13G 408K 13G 1% /run
none tmpfs 5.0M 0 5.0M 0% /run/lock
none tmpfs 32G 17M 32G 1% /run/shm
/dev/sda6 ext4 241G 48G 181G 21% /vms
Writing data to a disk
Use the sync command to write data not updated in the memory to a disk.
Example:
root@HZ-UIS01-CVK01:~# sync
root@HZ-UIS01-CVK01:~#
